Transcription
OptimizingProviders’ Profit in Peer NetworksApplyingAutomatic Pricing and Game TheoryPhD Defense PresentationSohel KhanOctober 24, 2005
Outline of the Presentation1. Introduction2. Automatic Price Transaction Architecture3. Providers’ Profit Optimization Method Select Strategic Price by Game Theory Minimize Congestion Cost by Optimum Routing Guarantee QoS by Traffic Engineered Network Design4. Result5. Conclusion6. Appendix2
Introduction: Problem Statement Existing Customer-Provider peer architecture and protocolsdo not support– Automatic price transaction– Customers’ option to select any provider based on competitive serviceprice– Customers’ option to broadcast their budget– Providers’ automatic mechanism to compute price and optimize Profit In competitive market In dynamic Internet traffic demand Therefore, the problem is to develop– Automatic price-transaction based network architecture– A provider’s model that compute competitive price and optimize Profit– Demonstrate the advantages of the architecture and the model throughanalysis3
Introduction: Proposed Solution This research proposes–A new Price transaction Architecture “Automatic Price Transaction-based One-to-Many Peer Network Architecture”– A new providers’ Profit optimization model “Providers Optimized Game in Internet Traffic Model”– An algorithm That implements the model in the architecture This research demonstrates– The validity of the model– Advantage of the model Customer Benefit Providers’ Benefit– Providers’ Profit optimization method– Examples of TE applications4
This Research:Introduction: Research Method Develops the Architecture– Wire-line and wireless options– Study only wire-line option Develops the Model and Algorithm– Determines strategically appropriate price By Game Theory– Minimizes the network congestion sensitive cost By optimum Routing technique– Non-linear optimization method» The Gradient Projection Algorithm and the Golden Section Line Search– Guarantees service quality By Designing Traffic Engineered Network Evaluates performance by––Mathematical AnalysisSimulation Study Studies the followings:– Advantages– Profit Optimization Strategies– Applications5
Related Research Significant Internet pricing research– In monopoly market– Congestion sensitive pricing Service per Customer’s bid Static Congestion Game– Game theory Internet Pricing: Monopoly market Congestion Issues: Monopoly market Peer providers in Series Industry Standard Activity– 3GPP Wireless Price Model– ATIS/PTSC wireline IP Peering– IETF wireline VoIP Peering On-line Exchange Research (Bandyopadday model)– We extend this model (Details later) Price-Transaction based mechanism– One provider network6
Distinguishing Characteristics of our Approach Automatic price transaction in one-to-many peer network– New idea of pricing in peer networks– Extends various industry standards Majority research are in monopoly market– We study Oligopoly market Provider’s Profit optimization in oligopoly market– New method in internet pricing and Profit optimization Network Model– A complex network, bi-directional links, multiple paths, OD&DO call legs Oligopoly Model– Bandyopadhyay et al. model Based on Bertrand Model and “Model of Sale” example Symmetric market– All parameters are fixed Commodity is not internet bandwidth Two step static game of incomplete information Homogeneous service Uses Reinforcement Learning (RL) in simulation to determine best strategy– Our model Extension to Bandyopadhyay et al. model Asymmetric market– Some parameters are sensitive to the dynamic nature of Internet traffic Commodity bandwidth “Myopic” Markovian static game of incomplete information Heterogeneous service An analytical framework to determine the best strategy in dynamic internet traffic7
Introduction: Contributions Developed a New price transaction architecture that benefits customers andproviders––––By AutomationBy providing options to select any provider based on competitive priceBy allowing customer power to specify budgetBy introducing new price transaction research in one-to-many architecture––To compute competitive price through the best strategyOptimize Profit in dynamic internet traffic demand–To verify and study providers’ game in flexible environment–In dynamic internet traffic demand–Providers improved their Profit––––Providers determined Best strategies (Bayesian-Nash equilibrium and Pareto-efficientoutcome) using our approachProviders was able to obtain fair market share of Profit and throughputProviders could implement TE applications such as optimized load balancing in the networkCustomers could enjoy market price lower than their budgets.––Our research is the first in Internet Oligopoly pricing research for disjoint providersExisting research are for monopoly market Developed a mathematical model for providers to Developed an algorithm and simulation model Introduced a New framework to determine Bayesian-Nash equilibrium Demonstrated that: Our approach yielded relative advantages over the existing Bertrand Oligopoly Model Introduced new area in Internet pricing research Introduced pricing research in a complex network model–Bi-directional links, multiple paths, Origin-Destination and Destination-Origin Call Legs.8
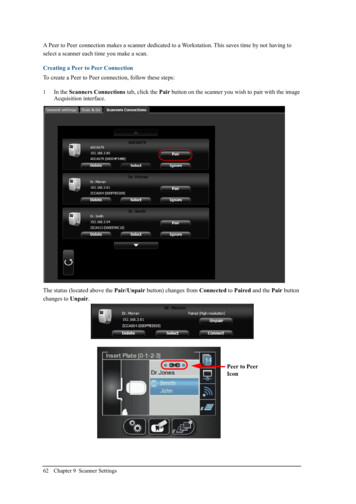
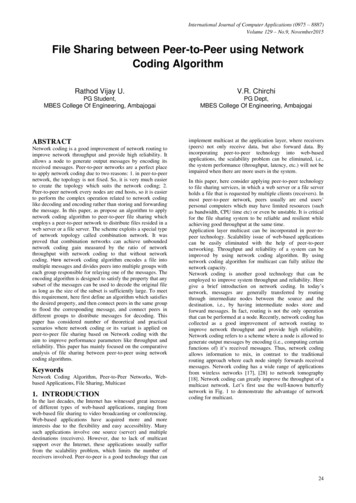
Current Managed IP Peering se.comSIP User Agents (UA)Blue.comSIP MobilePCSIP PhoneB e.comSIP User Agents (UA)SIP MobileRRPeeringAtlanta.Enterprise.comPCSIP PhoneA user@Dallas.Enterprise.comSession Control Function (e.g. SIP proxy)Bearer Function (e.g. IP Router)Security Function (e.g. Firewall)Does Not SupportAutomatic Price Transaction FunctionsEnterprises do not gain pricing advantage in provider selection9
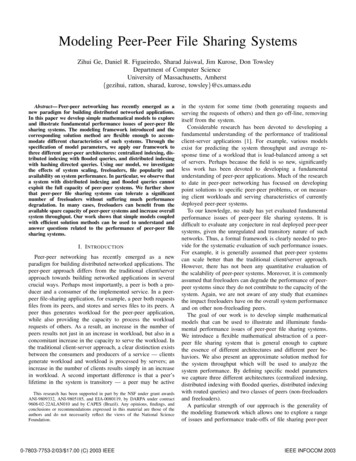
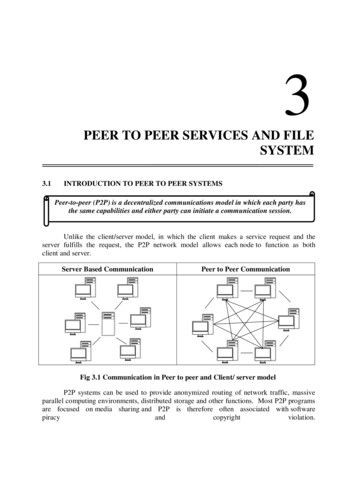
ProposedTransaction--based 1:M Peer Network ArchitectureAutomatic Price TransactionPrice BrokerPresence serverPrice BrokerNewYork.Enterprise.comAnalystSIP User Agents (UA)Blue.comChicago.Enterprise.comSIP MobilePCSIP PhoneB user@NewYork.Enterprise.comPrice BrokerAnalystRed.comSIP User Agents (UA)PeeringDallas.Enterprise.comSIP MobilePCSIP PhoneA user@Dallas.Enterprise.comSession Control Function (e.g. SIP proxy)Bearer Function (e.g. IP Router)Security Function (e.g. Firewall)Atlanta.Enterprise.comPrice BrokerOur architecture allows an enterprise customerto automatically shop from multiple providersbased on the service price they offer.10
Architecture: ATIS/PTSC IP (wireline) Peering Reference DiagramCurrent ATIS PTSC IP NNI Architecture specifies: One-to-one peer interface No pricing architecture is supportedProviderProviderAACCFECRFEBFECCFE: Call Control Functional EntityCRFE: Call Routing Functional EntityBFE: Bearer Functional EntitySignaling PlaneRouting PlaneBearer PlaneCCFECRFEBFEProviderProviderBB11
Our Extension to ATIS SRAnalystRed.comRed.comCurrent ATIS PTSC IP NNI Architecture specifies: One-to-one peer interface No pricing architecture is ustomerCustomerRegion#4Region#4EnterpriseDOur extension enhances ATIS Architecture to One-to-Many peer interface Automatic Price Transaction12
Current 3GPP (Wireless) IMS Charging ArchitectureSessionChargingFunctionO th e rIM SF u n c tio n sO n li n eC h a r g in gS y s te nctionP -C S C FEventChargingFunction3GPP On-line Charging System (WOP)P C S to w e rP C S to w e rP C S to w e rCharging ArchitectureCurrent 3GPP Architecture specifiesOne-to-one customer-providerOnline charging architecture (work on progress)Does not support one-to-many model13
Our Extension to the 3GPP (Wireless) IMS tRed.ComOnlineChargingSystemOtherIMSFunctionsP - CSCFOnlineChargingSystemP - CSCFPCS towerPCS towerPCS towerPCS towerPriceBrokerCurrent 3GPP Architecture supports One-to-one model Does not allow price negotiation Does not allows providers to compute competitive priceP-CSCF: Proxy-Call Session Control FunctionIMS: Internet Multi-media subsystemOur Extension supports OneOne--toto--many model Allows automatic price negotiation Allows providers to compute competitive price14
Proposed Price Transaction Protocol(4)EnterpriseSelectsBlue.comBecauseP 2 Min(P 1, P 2, P 3)CustomerEnterpriseBrokernsioesS)(1 of a B;:ecirBW Pay ?P,t a s: S g toansI W Cla willinmIa(1)I Want a Price of a SessionClass: S, BW: B;I am willing to Pay ?IWant(1aCla Price )sofI am s:wil S, BWa Seslingsio:nto P B;ay?The(3 ) e i s PcPri1(2)Compute Price P1by proposedGame of OligopolyAnalystProvider: Red.com(3)The Price is P2Presence(CCFE)(5)EnterpriseInitiatesSessionWith Blue.com(2)Compute Price P2by proposedGame of OligopolyAnalystProvider: Blue.comProvider: Green.comThe P (3)riceis PThe Protocol is analogous to theSealedSealed-BidBid-Reverse Auction.Customers has power to specify the highest pricePresence(CCFE)3Presence(CCFE)(2)Compute Price P3by proposedGame of OligopolyAnalyst15
BobUARegion Jayhawk CCFE(Broker, Forking Proxyand B2BUA)Provider CCFE(Presence andProxy Server)ProviderAnalyst(1) INVITESIP: Alice@Wildcat.com(3) SUBSCRIBE Class: Platinum,(2) 200 OKBW: 10 Mbps, Res Price: 100EnterpriseRegionJayhawkRegion WildcatProxy ServerBlue.com(4) 200 OKQuery(5) NOTIFY Price: 85ResponseEnterpriseRegionWildcat(3) SUBSCRIBE Class: Platinum,BW: 10 Mbps, Res Price: 100(4) 200 OK(5) NOTIFY Price: 75AliceUAQueryResponse(6) INVITE SIP: Alice@Wildcat.com(7) 200 OKRed.com (8) INVITESIP: Alice@Z.com(9) 200 OK(12) 180 Ringing(10) INVITESIP: Alice@Wildcat.com(11) 200 OK(13) ACKMedia Session(14) BYE(15) 200 OK16Example: Session Initiation Protocol (SIP) Call Flow (sketch)
Architecture: BGP ImplementationBorder Gateway Protocol(BGP)updates routing table withprice as a routing priseAComputes Price P1By ProposedGame of Oligopoly( Maximum -LSREnterpriseBComputes Price P2By ProposedGame of Oligopoly( Maximum Price)E-LSR performsLeast cost routingBased on min(p1, rpriseDMany other variants of the proposed Architecture are possible(See Table 2.1)17
ProposedTransaction--based 1:M Peer Network ArchitectureAutomatic Price TransactionPrice BrokerPresence serverPrice BrokerNewYork.Enterprise.comAnalystSIP User Agents (UA)Blue.comChicago.Enterprise.comSIP MobilePCSIP PhoneB user@NewYork.Enterprise.comPrice BrokerAnalystRed.comSIP User Agents (UA)PeeringDallas.Enterprise.comSIP MobilePCSIP PhoneA user@Dallas.Enterprise.comSession Control Function (e.g. SIP proxy)Bearer Function (e.g. IP Router)Security Function (e.g. Firewall)Atlanta.Enterprise.comPrice BrokerOur architecture allows an enterprise customerto automatically shop from multiple providersbased on the service price they offer.18
Internal Network of Each Provider of our studyNodes are fully meshedEach O-D Pair is connected with five alternative LSPsThere are 60 LSPs in each networkEach call has two legs: O-D and D-OSingle Integrated Queue per output linkFirst-in-First-Out (FIFO) non-preemptive Scheduling ererRegion#1Region#1( Chicago)( Chicago)(New(N ewYork)York)3003001100E-LSR300CustomC ustomererRRegion#3egion#3(Dallas)(D LSR300300CustomCustomererRRegion#4egion#4(A tlanta)(A tlanta)19
Traffic Model Packet:–––––Arrival Pattern: Poisson DistributedMean Service Rate: Exponentially DistributedAggregate arrival distribution: PoissonAggregate mean service rate distribution: Hyper-exponentialQueue Theory Model M/G/1 For Traffic Engineering, we will use M/G/1For Cost Analysis, we will approximate with M/M/1 Session: (No Queuing) Assumed Traffic Mix––Arrival Pattern: Poisson DistributedMean Service Rate: Exponentially Distributed––Homogeneous: GoldHeterogeneous Class: Platinum, Gold, and Silver The service class is differentiated by cost coefficient parameter.Cost coefficient parameter depends on the type of protocol and Intelligence usedExample: Level of Security guarantees, addressing (IPv4 vs. IPv6), type of DSPCost coefficient parameter distinguishes Service Class (Plat, Gold, Silver)20
Profit OptimizationUnit Utility at steady state : u( p) ( p ω)Y Our method of Providers’ ProfitOptimization:–Design Traffic-EngineeredNetwork to Guarantee QoS– Minimize congestion sensitivecost ( Y)– Select strategically appropriateprice by Game TheoryMaximize u(.)Network Architecture Constraints.t. Internet Traffic Pattern and Queue System ConstraintGame Strategy ConstraintMaximize u( p) Max ( p ω)YMax pY Max ( ωY )(Maximize pY Minimize ωY )Marginal CostTime (t)profitn Network Throughput (Y)ThroughputTime (t)dtProfit ( u(.))(.))Marginal Cost ( (.)) kMaximize u( p)( p s , t , k ω n , s , t , k ) d n , k yn , s , kp: call unit price: call marginal costd: call durationy: call bandwidthdtUnit-Profit-ProfitMarket Price to maximize revenue (pY)Price (p(.))Max ( p ω)Y21dtdt
AlgorithmSealed Bid Reverse AuctionProtocol(Signaling & Control Layer)Find bid price based on providersStrategy: P H(F(p))Perform Non-CooperativeGame of Oligopoly to developBelief Function: F(p) G( )Find bid price based on providersStrategy: pb H(F(p))Perform Minimize Marginal CostGame of Oligopoly to develop byPerformBelief Function: F(p) G( Optimum, , )Traffic RoutingApproximateDevelop CongestionDevelop OptimumDemandSensitive Cost: (M*)Mean Function:Number of (Y)Packets (M*) for Y(Based on Queuing Theory (e.g. M/M/1))Minimize Marginal CostbyBased onOptimum Traffic Routing MathematicalNon-Linear ProgrammingApproximate (GradientProjection Method andGolden Section Line Search)OptimumMean Number of Packets (M*) for Ymco.(Based on Queuing Theory (e.g. M/M/1))ACustomerDomainBearerLayeromcB.Traffic Engineering RuleBasedEnforceonNon-Linear Programming Based on(Gradient ProjectionQueuingMethod andTheory (e.g. M/G/1)Golden Section Line Search)QoS GuaranteeEnforce Traffic Engineering RuleBased on Queuing Theory (e.g. M/G/1)22
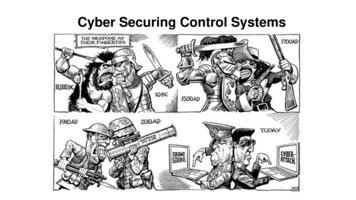
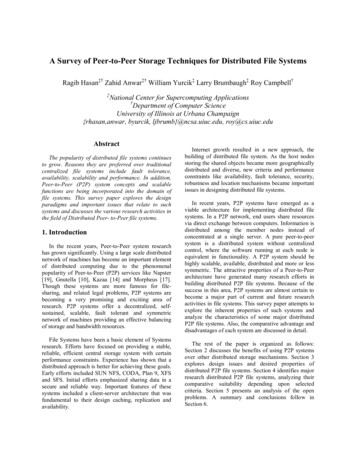
QoS Guarantee We develop TE Rules to guarantee mean delay less than 1 msec.– Homogeneous services Link Load (Green) 90%– Heterogeneous Services Link Load (Blue) 20% Link Load (Green) 30% Link Load (Red) 40%Based on M/G/1 SystemE[τ b ] E[ Lg ]E[ Lb ]E[ Lr ], E[τ g ] , E[τ r ] CCCE[ Lb ]E[τ ] 2.C2b2, E[τ ] 2.2gE[ Lg ]CλgλbλE[τ b ] E[τ g ] v E[τ r ]λλλλgλλE[τˆ 2 ] b E[τ b 2 ] E[τ g 2 ] v E[τ r 2 ]λλλE[ Ls ]λ E[τˆ 2 ] E[Ts ] 2(1 λ E[τˆ])CE[τˆ] 2M/G/1 System Delay1.61.4E[ Lr ], E[τ ] 2.C2r21.2System Delay: E[τ](msec) BlueGrenRedρb 20%ρg 30%ρr 5% -- 45%10.80.60.40.200.550.60.650.70.750.8Link Utilization (ρLINK)0.85230.90.95
Service Cost Function Assumption: Following four influences on the service cost:– Congestion in the network Degrades the service quality– causes the delay in packet transmission. The degradation of service is detrimental to the revenue Providers have to pay to the Enterprise for jitter (Expense An indicator of network congestion– Mean packet count (M) in the queue system– Protocol used to provide a service Service cost coefficient ( s)– Amount of service (commodity) Throughput (Y)– Providers’ fixed cost ( )Costn , s ,t (Yn ,t ) g (Yn ,t ) δ s Mˆ n ,tYn ,t θ nYn ,tf (Yn ,t ) M n ,t24
Minimize CostA Cost Function assumption Service cost is a functions of network congestion Mean packet count in network queue system is a congestion indicatorMinimize ωn ,t Minimize {δ s (Yn ,t Mˆ n ,t Yn ,t Mˆ n ,t ) θ n }Minimize Mˆ optimize network traffic routes applying nonlinear programMinimizeYn ,t Mˆ n ,t Yn ,troute optimization loadbalances and reduces change in Mˆ in low loadn ,t25
Minimize Marginal Cost Minimize Congestion Cost by Optimum Routing Method– Minimizing Mean Packet Count Mean Packet Count (M/M/1 Model):Mˆ j:l jE[ packets ] l Non-Linear Program:Minimize : Mˆ j :l jlSubject to :j :l JCl xjj :l jCl xjj:l jxjxjx j ρ TE C lj J ( w )x j rwxj 0We implement Gradient Projection and Golden Section line searchto satisfy Karush-Kuhn-Tucker conditionIn each game instance (each request for bid), this optimization is performed(See dissertation for details, we provide highlight in next three slides)
NonNon-linear Program: 1 x231 x241 x2431 x2341 r21 egion#3x12 x132 x142 x1342 x1432 r12 egion#1Region#1(Chicago)(Chicago)3002100x31 x321 x341 x3421 x3241 r31 0x14 x124 x134 x1324 x1234 r14 0E-LSR100NSP1NSP1x13 x123 x143 x1243 x1423 r13 0300100[H] lanta)(Atlanta)x41 x421 x431 x4231 x4321 r41 0x42 x412 x432 x4132 x4312 r42 0x24 x214 x234 x2314 x2134 r24 0x23 x213 x243 x2143 x2413 r23 0x32 x312 x342 x3412 x3142 r32 0x34 x314 x324 x3124 x3214 r34 0x12 x123 x124 x1243 x1234 x312 x3124 x3412 x4123 x412 x4312 ρTE C12 0 x43 x413 x423 x4213 x4123 r43 0x21 x321 x421 x3421 x4321 x213 x4213 x2143 x3214 x214 x2134 ρTE C21 0x13 x134 x213 x413 x132 x1342 x1324 x4132 x2134 x2413 x4213 ρTE C13 0x31 x431 x312 x314 x231 x2431 x4231 x2314 x4312 x3142 x3124 ρTE C31 0x14 x142 x214 x314 x143 x1432 x1423 x2314 x3214 x3142 x2143 ρTE C14 0G Inequality x41 x241 x412 x413 x341 x2341 x3241 x4132 x4123 x2413 x3412 ρTE C41 0x42 x142 x342 x421 x423 x1342 x1423 x3142 x3421 x4213 x4231 ρTE C42 0x24 x241 x243 x124 x324 x2431 x3241 x2413 x1243 x3124 x1324 ρTE C24 0x23 x231 x234 x123 x423 x1234 x1423 x2314 x2341 x4123 x4231 ρTE C23 0x32 x132 x432 x321 x324 x4321 x3241 x4132 x1432 x3214 x1324 ρTE C32 0x34 x134 x234 x341 x342 x1342 x1234 x2341 x2134 x3421 x3412 ρTE C34 0x43 x431 x432 x143 x243 x2431 x4321 x1432 x4312 x1243 x2143 ρTE C43 0xp: BW of an LSPEach O-D pair has Five LSPs.Total: 60 LSPs in each providernetworkCl: Capacity of each linkTE: TE loadG non neg . { x j 0, j J27
NonNon-Linear Program: Initial Feasible Point Gradient Projection Method requires an initial feasible vector (X0)Determine: New Session Route Vector (NV)– Minimum Hop Routing Step 1– Select the shortest path (one hop route) If fails Step 1, Step 2– Select either of the two hop route with equal probability If fails Step 2, Step 3– Select either of the three hop route with equal probability Anticipated Route Vector (Current Route Vector) NV Initial feasible vector (X0)Anticipated Route Vector28
NonNon-Linear Program: Gradient Projection SnapshotInequality Constraints:(12 60)G Inequaltiy(60 60) G Non negativeY (60 1)Equality Constraints:(12 1)ρTE C(60 1) 0Working Matrix: [ 72 1 0][ W] [ 12 60 H LSP ][ 60 1Y ] [ 12 1 R ] [ 12 1 0][ 12 1 H ] [ 12 1 0]G ActiveHThis working matrix is the foundation of the working surface (Aq)Direction of movement (d) is found as follows:P I AqT ( Aq AqT ) 1 Aqd P f (x)TFind Maximum distance (Max):ginactive (x) α Max ginactive (x)d bUse Golden Section Line search to find optimum point in each feasible segment:Minimizef ( xk α k d k )s.t.[ A] [ b ]Minimum is achieved at dk 0 and λ 0 such that the following FONC is satisfied f (xk ) λkT Aq 029
NonNon-Linear Program: Output Output of Non-linear program– Optimized Mean Packet CountM̂ *– Optimum Routes– Fair Load Distribution Inside the Network- Minimization of Cost30
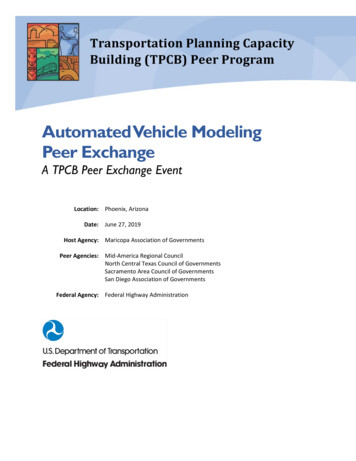
Minimizing Change in CongestionMinimize Mˆ n ,t Yn ,troute optimization loadbalances and reduces change in Mˆ in low loadn ,tWith Optimization0.12Network Load (δn) 38%Network Load (δn) 38%0.1Change in Mean Number of PacketsChange in Mean Number of Packets0.10.080.060.040.020Without Optimization0.1200.511.5Simulation Time24x 100.080.060.040.02000.511.5Simulation Time24x 1031
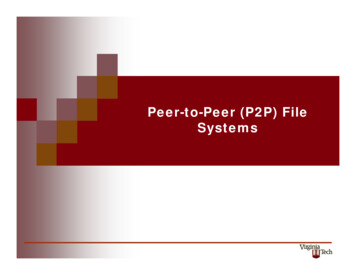
Congestion Sensitive Optimized Marginal CostWe develop the Marginal Cost Functionfromthe Optimized Mean Packet Count (M*):ωns ,t ( Mˆ ) δ s (Yn,t*n ,t Mˆ n*,t 1Marginal Cost (ω) and Cost Coefficient (δ)140140120120100δb 1.0806080202000.40.5 0.6 0.7 0.8Network Load (ρNetw ork(Y))Ω r 70δg 0.1δr 0.01Provider MˆY Mˆ 1,* t ) 101.00(1,t1 Y1,t0.10(Y1,tProvider Mˆ *2,tY1.00( Mˆ *2,t ) 102,t2 Y2,t0.10(Y2,tMˆ n*,t 1 Mˆ n*,t(bOD bDO )Simulation0.5 0.6 0.7 0.8Network Load (ρNetw ork(Y))Green*1,t Yn ,t Mˆ *n,t ) θ nThree classes (Blue, Green, Red)Cost coefficient parameterdepends on security levels(High, Medium, Low) Cost coefficient parameterdistinguishes Service ClassMean Packet Count: M/M/16040BlueΩ g 1001004000.4 Yn ,t 1160Ω b 160Marginal Cost (ω(Y)Marginal Cost (ω(Y)160 Mˆ *n ,tRed Mˆ*1,t Y1,t Mˆ *2,t Y2,t Mˆ 1,* t ) 100.01(Y1,t Mˆ *2,t ) 100.01(Y2,t Mˆ 1,* t Y1,t Mˆ *2,t Y2,t Mˆ 1,* t ) 10 Mˆ *2,t ) 1032
Game Theory Model Our Model is Our models extends– Based on Bertrand Oligopoly Model– A Myopic Markovian-Bayesian Static Game of Incomplete Information– Bandyopadhyay et al. On-Line-Exchange ModelBandyopadhyay et al. On-LineExchange Model Our Model:– Based on Bertrand Model and “ Modelof Sale” example– Extension to Bandyopadhyay et al.model– Symmetric market– Asymmetric market All parameters are fixed Demand and cost are functions of thedynamic nature of Internet traffic– Commodity is not Internet bandwidth– Commodity is internet bandwidth– Two step static game of incompleteinformation– “ Myopic” Markovian static game ofincomplete information– Homogeneous service– Heterogeneous service– Uses Reinforcement Learning (RL) insimulation to determine best strategy– An analytical framework to determinethe best strategy in dynamic internettraffic33
Oligopoly Model Selection Oligopoly– A small number of providers collectively influence Market condition such as price, capacity– A single provider alone cannot completely control the marketTwo well-established fundamental models of Oligopoly– Bertrand Model Strategic Variable: Price Strategic Variable: Capacity (quantity)– Cournot Model34
Oligopoly Model In the Internet, providers strategically interact– Long term: Adds more capacity, i.e. “ bandwidth wars” Price adjustment in fixed capacity, i.e., “ price wars”– Short term: Our Model is based on Bertrand Oligopoly Model– Short term Session arrival and departure in a relatively short time period– Capacity does not change during the game– Providers adjust price to win over customers– Customers subscribe to the service from the lowest priced provider.35
Game Model Selection Game Theory– The mathematical theory pertaining to the strategic interaction of decision makers There are four fundamental classes of gameGame ClassEquilibriumStatic Game of Complete InformationDynamic Game of Complete InformationStatic Game of Incomplete InformationDynamic Game of Incomplete InformationNash EquilibriumSubgame-perfect Nash equilibriumBayesian Nash equilibriumPerfect Bayesian Equilibrium Complete Information: Providers’ payoff or strategies are common knowledge Incomplete Information: At least one player is unware of the payoffs or strategies of other providers Static Game Players simultaneously interacts (chooses actions) without the knowledge of past Dynamic Game Players repeatedly interacts based on the knowledge of game history (e.g., payoff)36
Game Model Our model is Myopic Markovian-Bayesian Game of Incomplete Information– Each provider is a rational player– Each provider’s payoff is private information.– All providers simultaneously select bid price without past knowledge of payoffs– “ Myopic Markovian” Each session is an instance of the gameGame uses one step nearsighted information Developed based on Bayes’ Conditional Probability Rule– The game is also known as Bayesian Static Game of Incomplete Information37
Game Parameters Our Game Parameters–––––––––Strategic Players : A few Internet Service ProvidersStrategic variable : Bid Price (pbid)Commodity: the bandwidth of services in the InternetServices: Homogeneous/Heterogeneous (Plat., Gold, Silv.) ServicesCapacity: Peer capacity in bw (Fixed)Demand: Sensitive to Internet traffic throughput (Variable)Marginal Cost: Sensitive to network congestion (Variable)Customer’s limited Budget: Reservation price (Fixed)Payoff: Profit38
Bayesian Static Game of Incomplete Information Static Bayesian Game of two Providers ( A.com, B.com)– In Static Bayesian game, a provider’s strategy is to maximize its’ expected Profit– G {ActionA, ActionB; TypeA, TypeB; BeliefA(), BeliefB(); PayoffA(), PayoffB()} Action Bid price (pbid)Type Provider’s marginal cost ( )Payoff Expected Profit (E(u(.))BeliefA(.) ProbA(TypeB TypeA)– A.com’s belief or uncertainty of B’s Type given that A.com knows own type– It is a conditional probability function– It is also referred to as the Mixed Strategy Profile– A.com develops a set of feasible strategies from the belief function:strategy h Aj : Action A h Aj (., Belief A (.))39
Game Model: Belief functions and Strategies The Belief function is the main entity of this GameBelief Function: FA(p):–is the Rejection probability of A.com for A’s bid price p. A.com’s belief of B.com’s winning probability for A.com’s bid price pAFA ( p Abid ) Prob( pB p bidA ) Strategy space h is the set of functions over F(p)– Strategy is identified by the rejection probability A Strategy, hAj “ 95% probability of having the bid rejected”pnbid,s,t : Fn,s,t ( pnbid,s,t ) prob( p pnbid,s,t ) 0.9540
Belief Function (F(p)) Belief function– It is a cumulative distribution function F(p) FA(p)–A.com’s belief of B.com’s winning probability for A.com’s bid price pAbidFA ( p bid) Prob(p pABA )– A.com’s probability of having its pA bid rejected The Rejection probability of A.com A.com’s rejection probability 90%bidFA ( p bid) Prob(p pABA ) 0.90 A.com believes that B.com will select bid-prices at most pA with 90%probability A.com’s winning probability 10%41
Strategy Strategy space h is the set of functions over F(p)––The strategy space is constructed from the Type and Action spaceA.com’s set of strategies hAj is the set of all possible functions with domain (input) TypeA and range(output) ActionA.strategy h Aj : Action A h Aj ( Belief A (., Type A )) A Strategy, hAj “ 95% probability of having the bid rejected”pnbid, s ,t : Fn , s ,t ( pnbid, s ,t ) prob( p pnbid, s ,t ) 0.95 Strategy is identified by the rejection probabilityF ( pmy bid ) Prob(pothersbid pmy bid ) γ42
Game Model: Belief Parameters F(p) Game(N, , (Y) ,s,(M*))– N: Number of providers in the market– : Market Capacity– (Y): Market Demand (function of throughput)–s: Customer Reservation Price, function of service type (s)– (M*)): Marginal Cost (function of mean packet count, M)NΓ K n ρ TE ρ TEn 1Nn 1Knρ TE ( N 1) K ε N Yn , t ρ TE K , ε 0 (Y n , t ) N Yn , t ρ TE K N Yn , t M axω n , s , t ( Mˆ ) δ s (Yn , t*n ,t Mˆ*n , t Yn , t Mˆn*, t 1 Yn , t 1 Mˆ*n , t Yn , tC1(C Yn , t ) 212Mˆn*, t 1 Mˆn*, t ( bO D b DO ) Mˆ*n , t ) θ nAnalysisS im ulation43
Y)30030010011100100100100NSP1100NSP1NSP1A.com 1003B.com NEngineered access bandwidth capacities of allproviders in a market100100Γ 300300E-LSR(Y)Market Capacity ( ): Aggregate egion#3(Dallas)(Dallas)300410033002100Nn a)(Atlanta)K n ρTE ρTENn 1KnN 2TEKMarket Demand ( ):Max(Y) NY(Y) (N-1)(N-1)TEK ρTE ( N 1) K ε NYn,t ρTE K , ε 0 (Yn ,t ) NYn ,t ρTE K NYn ,t MaxTEK(N-1)TEKMaxNTEKY44
Market Demand Max Market Demand (Max)– Aggregate Bandwidth in active session by all the customers from all theproviders at a certain instant of game (t)– An NSP cannot meet the demand ( ) of the whole market TEK Max – Maximum Market Demand is less than Market Capacity – Market Demand is greater than N-1 providers’ aggregate capacity TE(N-1)K MaxProposed Market Demand is a function of traffic served (Networkoutput/production)– Network is loss-less (no packet drop occurs in the network)ρTE ( N 1) K ε NYn,t ρTE K , ε 0 (Yn ,t ) NYn ,t ρTE K NYn ,t MaxYt : Sum of output (production) traffic bandwidth in all the egress ports of an45NSP at a certain Instant of the game (t)
Reservation Price of the Institution Reservation price ( ) is the price that a customer is willing to pay in theReverse Auction– It can be considered as customer’s budget. We do not study the method of determining .We assume– Enterprises (customers) are rational Reservation price is selected during the business agreementEnterprises do not violate the agreement– Do not change the reservation price during the game– for Homogeneous services,– For Heterogeneous services, is a same fixed value for all providerss depends on the type of serviceEnterprises may adopt their own strategies to determine.– This will require another larger research For example, Enterprise selects reservation price by considering monopoly market(assume
Introduced new area in Internet pricing research - Our research is the first in Internet Oligopoly pricing research for disjoint providers - Existing research are for monopoly market Introduced pricing research in a complex network model - Bi-directional links, multiple paths, Origin-Destination and Destination-Origin Call Legs.