Transcription
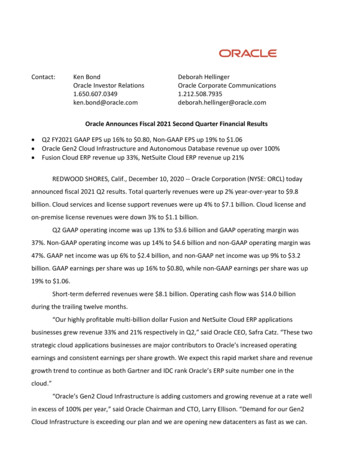
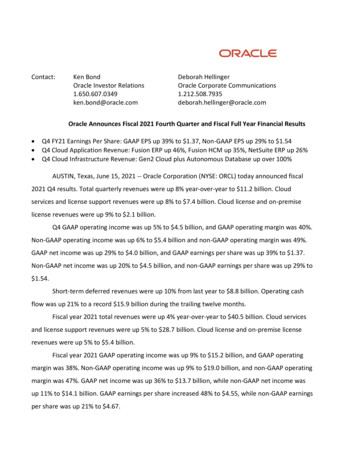
For Immediate ReleaseContact:Ken BondOracle Investor Relations1.650.607.0349ken.bond@oracle.comDeborah HellingerOracle Corporate le.comOracle Announces Fiscal 2020 Third Quarter Financial Results Q3 FY20 GAAP EPS up 4% to 0.79 and Non-GAAP EPS up 11% to 0.97Total Revenues of 9.8 billion, up 2% year-over-year and 3% in constant currencyCloud Services & License Support Revenues of 6.9 billion, up 4% year-over-year and 5% inconstant currencyFusion ERP Cloud Revenues up 37% year-over-year and 38% in constant currencyThe Board of Directors increased the authorization for share repurchases by 15.0 billionREDWOOD SHORES, Calif., March 12, 2020 -- Oracle Corporation (NYSE: ORCL) todayannounced fiscal 2020 Q3 results. Total Revenues were 9.8 billion, up 2% in USD and 3% inconstant currency compared to Q3 last year. Cloud Services and License Support revenues were 6.9 billion, up 4% in USD and 5% in constant currency. Cloud License and On-Premise Licenserevenues were 1.2 billion.GAAP Operating Income was up 4% to 3.5 billion, and GAAP Operating Margin was 36%.Non-GAAP Operating Income was up 2% to 4.4 billion, and non-GAAP Operating Margin was 44%.GAAP Net Income was 2.6 billion, and non-GAAP Net Income was 3.2 billion. GAAP Earnings PerShare was up 4% to 0.79, while non-GAAP Earnings Per Share was up 11% to 0.97.Short-term Deferred Revenues were 7.8 billion. Operating Cash Flow was 13.9 billionduring the trailing twelve months."We had an extremely strong quarter with Total Revenues growing 3% in constantcurrency,” said Oracle CEO, Safra Catz. “Subscription revenues, made up of Cloud Services andLicense Support revenues, grew 5% in constant currency. These consistently growing and recurring
subscription revenues now account for 71% of total company revenues, thus enabling a sequentialincrease in our operating margin, and double-digit non-GAAP Earnings Per Share growth in Q3.”“The Oracle Autonomous Database, the world’s only fully autonomous data managementsystem, can automatically patch security vulnerabilities while running; it keeps your data safe,” saidOracle Chairman and CTO, Larry Ellison. “Oracle Autonomous Database is also both serverless andelastic. It’s the only database that can instantaneously scale itself to an optimal level of CPU and IOresources. You only pay for what you use. Security and economy are two fundamental reasons whythousands of customers are now using the revolutionary new Oracle Autonomous Database in ourGeneration 2 Public Cloud.”The Board of Directors increased the authorization for share repurchases by 15.0 billion.The Board of Directors also declared a quarterly cash dividend of 0.24 per share of outstandingcommon stock. This dividend will be paid to stockholders of record as of the close of business onApril 9, 2020, with a payment date of April 23, 2020.Q3 Fiscal 2020 Earnings Conference Call and WebcastOracle will hold a conference call and webcast today to discuss these results at 2:00 p.m.Pacific. You may listen to the call by dialing (816) 287-5563, Passcode: 425392. To access the livewebcast, please visit the Oracle Investor Relations website at http://www.oracle.com/investor. Inaddition, Oracle’s Q3 results and fiscal 2020 financial tables are available on the Oracle InvestorRelations website.A replay of the conference call will also be available by dialing (855) 859-2056 or (404) 5373406, Passcode: 5995463.About OracleThe Oracle Cloud offers a complete suite of integrated applications for Sales, Service,Marketing, Human Resources, Finance, Supply Chain and Manufacturing, plus Highly-Automatedand Secure Generation 2 Infrastructure featuring the Oracle Autonomous Database. For moreinformation about Oracle (NYSE:ORCL), visit us at www.oracle.com or contact Investor Relations atinvestor us@oracle.com or (650) 506-4073.
# # #TrademarksOracle and Java are registered trademarks of Oracle and/or its affiliates. Other names may betrademarks of their respective owners."Safe Harbor" Statement: Statements in this press release relating to Oracle's future plans,expectations, beliefs, intentions and prospects, including statements regarding the growth of oursubscription business and our Autonomous Database business, are "forward-looking statements"and are subject to material risks and uncertainties. Many factors could affect our currentexpectations and our actual results, and could cause actual results to differ materially. Wepresently consider the following to be among the important factors that could cause actual resultsto differ materially from expectations: (1) Our success depends upon our ability to develop newproducts and services, integrate acquired products and services and enhance our existing productsand services. (2) Our cloud strategy, including our Oracle Software-as-a-Service and Infrastructureas-a-Service offerings, may adversely affect our revenues and profitability. (3) We might experiencesignificant coding, manufacturing or configuration errors in our cloud, license and hardwareofferings. (4) If the security measures for our products and services are compromised and as aresult, our customers' data or our IT systems are accessed improperly, made unavailable, orimproperly modified, our products and services may be perceived as vulnerable, our brand andreputation could be damaged, the IT services we provide to our customers could be disrupted, andcustomers may stop using our products and services, all of which could reduce our revenue andearnings, increase our expenses and expose us to legal claims and regulatory actions. (5) Ourbusiness practices with respect to data could give rise to operational interruption, liabilities orreputational harm as a result of governmental regulation, legal requirements or industry standardsrelating to consumer privacy and data protection. (6) Economic, political and market conditions canadversely affect our business, results of operations and financial condition, including our revenuegrowth and profitability, which in turn could adversely affect our stock price. (7) Our internationalsales and operations subject us to additional risks that can adversely affect our operating results.(8) Acquisitions present many risks and we may not achieve the financial and strategic goals thatwere contemplated at the time of a transaction. A detailed discussion of these factors and otherrisks that affect our business is contained in our SEC filings, including our most recent reports onForm 10-K and Form 10-Q, particularly under the heading "Risk Factors." Copies of these filings areavailable online from the SEC or by contacting Oracle Corporation's Investor Relations Departmentat (650) 506-4073 or by clicking on SEC Filings on Oracle’s Investor Relations website athttp://www.oracle.com/investor. All information set forth in this press release is current as ofMarch 12, 2020. Oracle undertakes no duty to update any statement in light of new information orfuture events.
ORACLE CORPORATIONQ3 FISCAL 2020 FINANCIAL RESULTSCONDENSED CONSOLIDATED STATEMENTS OF OPERATIONS( in millions, except per share data)February 29,2020REVENUESCloud services and license supportCloud license and on‐premise licenseHardwareServicesTotal revenues % ofRevenues% Increase(Decrease)in US % Increase(Decrease)in ConstantCurrency 1%)2%5%0%(5%)0%3%Three Months Ended% ofFebruary OPERATING EXPENSESCloud services and license supportHardwareServicesSales and marketingResearch and developmentGeneral and administrativeAmortization of intangible assetsAcquisition related and otherRestructuringTotal operating 2%1%7%(19%)2%1%5%(8%)(2%)295%47%2%OPERATING INCOMEInterest expenseNon‐operating income, %)(98%)5%(10%)(99%)INCOME BEFORE PROVISION FOR INCOME TAXESProvision for income taxes3,07650531%5%3,08834332%4%0%47%1%47%26% 2,74528%(6%)(5%) 0.780.76NET INCOME 2,571EARNINGS PER SHARE:BasicDiluted 0.810.79WEIGHTED AVERAGE COMMON SHARES OUTSTANDING:BasicDiluted3,1903,271 3,5263,617(1) We compare the percent change in the results from one period to another period using constant currency disclosure. We present constant currencyinformation to provide a framework for assessing how our underlying businesses performed excluding the effect of foreign currency rate fluctuations. Topresent this information, current and comparative prior period results for entities reporting in currencies other than United States dollars are convertedinto United States dollars at the exchange rates in effect on May 31, 2019, which was the last day of our prior fiscal year, rather than the actual exchangerates in effect during the respective periods. Movements in international currencies relative to the United States dollar during the three months endedFebruary 29, 2020 compared with the corresponding prior year period decreased our revenues by 1 percentage point, operating expenses by 1 percentagepoint and operating income by 1 percentage point.1
ORACLE CORPORATIONQ3 FISCAL 2020 FINANCIAL RESULTSRECONCILIATION OF SELECTED GAAP MEASURES TO NON‐GAAP MEASURES (1)( in millions, except per share data)February 29,2020GAAPAdj.TOTAL REVENUESCloud services and license support 9,7966,930 TOTAL OPERATING EXPENSESStock‐based compensation (3)Amortization of intangible assets (4)Acquisition related and otherRestructuring 6,268361400760 OPERATING INCOME 3,528 OPERATING MARGIN %% Increase (Decrease)in US Three Months EndedFebruary 29,February 28,20202019Non‐GAAPGAAP119,7976,931 9,6146,662 (828)(361)(400)(7)(60) 5,440‐‐‐‐ 6,215427407(4)43 829 4,357 3,399 44%GAAPNon‐GAAPGAAPNon‐GAAP 9,6186,6662%4%2%4%3%5%3%5%(873)(427)(407)4(43) %)295%47%3%****877 4,276Adj. 36%February 28,2019Non‐GAAP% Increase (Decrease) inConstant Currency (2)4435%44%4%2%5%3%65 bp.1 bp.78 bp.6 bp.(7%)INCOME TAX EFFECTS (5) 505 240 745 343 466 80947%(8%)47%NET INCOME 2,571 589 3,160 2,745 411 3,156(6%)0%(5%)1%DILUTED EARNINGS PER SHARE 0.79 0.97 0.76 0.874%11%5%12%3,617(10%)(10%)(10%)(10%)DILUTED WEIGHTED AVERAGE COMMON SHARES OUTSTANDING3,271‐3,2713,617‐(1) This presentation includes non‐GAAP measures. Our non‐GAAP measures are not meant to be considered in isolation or as a substitute for comparable GAAP measures, and should be read only in conjunction with ourconsolidated financial statements prepared in accordance with GAAP. For a detailed explanation of the adjustments made to comparable GAAP measures, the reasons why management uses these measures, theusefulness of these measures and the material limitations on the usefulness of these measures, please see Appendix A.(2) We compare the percent change in the results from one period to another period using constant currency disclosure. We present constant currency information to provide a framework for assessing how our underlyingbusinesses performed excluding the effect of foreign currency rate fluctuations. To present this information, current and comparative prior period results for entities reporting in currencies other than United Statesdollars are converted into United States dollars at the exchange rates in effect on May 31, 2019, which was the last day of our prior fiscal year, rather than the actual exchange rates in effect during the respectiveperiods.(3) Stock‐based compensation was included in the following GAAP operating expense categories:Three Months EndedFebruary 29, 2020Adj.Non‐GAAP22 (22) 1 (361) ‐GAAPCloud services and license supportHardwareServicesSales and marketingResearch and developmentGeneral and administrativeTotal stock‐based compensation Three Months EndedFebruary 28, 2019Adj.Non‐GAAP26 (26) 7 (427) ‐GAAP (4) Estimated future annual amortization expense related to intangible assets as of February 29, 2020 was as follows:Remainder of fiscal 2020Fiscal 2021Fiscal 2022Fiscal 2023Fiscal 2024Fiscal 2025ThereafterTotal intangible assets, net 3661,3451,097674445126354,088(5) Income tax effects were calculated reflecting an effective GAAP tax rate of 16.4% and 11.1% in the third quarter of fiscal 2020 and 2019, respectively, and an effective non‐GAAP tax rate of 19.1% and 20.4% in the thirdquarter of fiscal 2020 and 2019, respectively. The difference in our GAAP and non‐GAAP tax rates in the third quarter of fiscal 2020 was primarily due to the net tax effects on stock‐based compensation expense andacquisition related items, including the tax effects of amortization of intangible assets. The difference between our GAAP and non‐GAAP tax rates in the third quarter of fiscal 2019 was primarily due to adjustments inour estimates for the one‐time effects of the U.S. Tax Cuts and Jobs Act of 2017 (refer to Appendix A for additional information), the net tax effects on stock‐based compensation expense, and acquisition related items,including the tax effects of amortization of intangible assets.* Not meaningful2
ORACLE CORPORATIONQ3 FISCAL 2020 YEAR TO DATE FINANCIAL RESULTSCONDENSED CONSOLIDATED STATEMENTS OF OPERATIONS( in millions, except per share data)February 29,2020REVENUESCloud services and license supportCloud license and on‐premise licenseHardwareServicesTotal revenues % ofRevenues% Increase(Decrease)in US % Increase(Decrease)in ConstantCurrency )(6%)(2%)1%4%(4%)(5%)(1%)2%Nine Months Ended% ofFebruary 8%100%OPERATING EXPENSESCloud services and license supportHardwareServicesSales and marketingResearch and developmentGeneral and administrativeAmortization of intangible assetsAcquisition related and otherRestructuringTotal operating %)1%OPERATING INCOMEInterest expenseNon‐operating income, %4%0%27%1%27%25% 7,34326%(4%)(3%) 1.981.93INCOME BEFORE PROVISION FOR INCOME TAXESProvision for income taxesNET INCOME 7,019EARNINGS PER SHARE:BasicDiluted 2.162.10WEIGHTED AVERAGE COMMON SHARES OUTSTANDING:BasicDiluted3,2513,337 3,7163,811(1) We compare the percent change in the results from one period to another period using constant currency disclosure. We present constant currencyinformation to provide a framework for assessing how our underlying businesses performed excluding the effect of foreign currency rate fluctuations. Topresent this information, current and comparative prior period results for entities reporting in currencies other than United States dollars are convertedinto United States dollars at the exchange rates in effect on May 31, 2019, which was the last day of our prior fiscal year, rather than the actual exchangerates in effect during the respective periods. Movements in international currencies relative to the United States dollar during the nine months endedFebruary 29, 2020 compared with the corresponding prior year period decreased our revenues by 1 percentage point, operating expenses by 1 percentagepoint and operating income by 2 percentage points.3
ORACLE CORPORATIONQ3 FISCAL 2020 YEAR TO DATE FINANCIAL RESULTSRECONCILIATION OF SELECTED GAAP MEASURES TO NON‐GAAP MEASURES (1)( in millions, except per share data)February 29,2020GAAP% Increase (Decrease)in US Nine Months EndedFebruary 29,February 28,20202019Non‐GAAPGAAPAdj.Adj.TOTAL REVENUESCloud services and license support 28,62920,546 33 28,63220,549 28,36919,908 TOTAL OPERATING EXPENSESStock‐based compensation (3)Amortization of intangible assets (4)Acquisition related and otherRestructuring 19,0411,2041,22144181 (2,650)(1,204)(1,221)(44)(181) 16,391‐‐‐‐ 19,0911,2591,26529275 OPERATING INCOME 9,588 2,653 12,241 9,278 OPERATING MARGIN %33%43%February 28,2019Non‐GAAP% Increase (Decrease) inConstant Currency (2)GAAPNon‐GAAPGAAPNon‐GAAP 29)(275) %)55%(33%)2%****2,845 12,123171733%43%3%1%5%2%79 bp.5 bp.92 bp.10 bp.INCOME TAX EFFECTS (5) 1,348 769 2,117 1,059 1,122 2,18127%(3%)27%(2%)NET INCOME 7,019 1,884 8,903 7,343 1,723 9,066(4%)(2%)(3%)(1%)DILUTED EARNINGS PER SHARE 2.67 2.103,337DILUTED WEIGHTED AVERAGE COMMON SHARES OUTSTANDING ‐3,3371.933,811 ‐2.389%12%11%14%3,811(12%)(12%)(12%)(12%)(1) This presentation includes non‐GAAP measures. Our non‐GAAP measures are not meant to be considered in isolation or as a substitute for comparable GAAP measures, and should be read only in conjunction with ourconsolidated financial statements prepared in accordance with GAAP. For a detailed explanation of the adjustments made to comparable GAAP measures, the reasons why management uses these measures, the usefulnessof these measures and the material limitations on the usefulness of these measures, please see Appendix A.(2) We compare the percent change in the results from one period to another period using constant currency disclosure. We present constant currency information to provide a framework for assessing how our underlyingbusinesses performed excluding the effect of foreign currency rate fluctuations. To present this information, current and comparative prior period results for entities reporting in currencies other than United States dollars areconverted into United States dollars at the exchange rates in effect on May 31, 2019, which was the last day of our prior fiscal year, rather than the actual exchange rates in effect during the respective periods.(3) Stock‐based compensation was included in the following GAAP operating expense categories:Cloud services and license supportHardwareServicesSales and marketingResearch and developmentGeneral and administrativeTotal stock‐based compensationNine Months EndedFebruary 29, 2020GAAPAdj.Non‐GAAP 83 (83) ‐8(8)‐42(42)‐192(192)‐781(781)‐98(98)‐ 1,204 (1,204) ‐Nine Months EndedFebruary 28, 2019GAAPAdj.Non‐GAAP 74 (74) �� 1,259 (1,259) ‐(4) Estimated future annual amortization expense related to intangible assets as of February 29, 2020 was as follows:Remainder of fiscal 2020Fiscal 2021Fiscal 2022Fiscal 2023Fiscal 2024Fiscal 2025ThereafterTotal intangible assets, net 3661,3451,097674445126354,088(5) Income tax effects were calculated reflecting an effective GAAP tax rate of 16.1% and 12.6% in the first nine months of fiscal 2020 and 2019, respectively, and an effective non‐GAAP tax rate of 19.2% and 19.4% in the firstnine months of fiscal 2020 and 2019, respectively. The difference between our GAAP and non‐GAAP tax rates in the first nine months of fiscal 2020 was primarily due to the net tax effects on stock‐based compensationexpense and acquisition related items, including the tax effects of amortization of intangible assets. The difference between our GAAP and non‐GAAP tax rates in the first nine months of fiscal 2019 was primarily due toadjustments in our estimates for the one‐time effects of the U.S. Tax Cuts and Jobs Act of 2017 (refer to Appendix A for additional information), the net tax effects on stock‐based compensation expense, and acquisitionrelated items, including the tax effects of amortization of intangible assets.* Not meaningful4
ORACLE CORPORATIONQ3 FISCAL 2020 FINANCIAL RESULTSCONDENSED CONSOLIDATED BALANCE SHEETS( in millions)February 29,2020May 31,2019ASSETSCurrent Assets:Cash and cash equivalentsMarketable securitiesTrade receivables, netPrepaid expenses and other current assets Total Current AssetsNon‐Current Assets:Property, plant and equipment, netIntangible assets, netGoodwill, netDeferred tax assetsOther non‐current assetsTotal Non‐Current Assets23,8292,0294,1623,422 ,7792,6964,31763,262TOTAL ASSETS20,51417,3135,1343,42562,323 96,704 108,709 2,3555331,3177,8143,72115,740 4,4945801,6288,3743,55418,630LIABILITIES AND EQUITYCurrent Liabilities:Notes payable, currentAccounts payableAccrued compensation and related benefitsDeferred revenuesOther current liabilitiesTotal Current LiabilitiesNon‐Current Liabilities:Notes payable and other borrowings, non‐currentIncome taxes payableOther non‐current liabilitiesTotal Non‐Current 952,74867,71614,881TOTAL LIABILITIES AND EQUITY 596,70422,363 108,709
ORACLE CORPORATIONQ3 FISCAL 2020 FINANCIAL RESULTSCONDENSED CONSOLIDATED STATEMENTS OF CASH FLOWS( in millions)Nine Months EndedFebruary 29,February 28,20202019Cash Flows From Operating Activities:Net income Adjustments to reconcile net income to net cash provided by operating activities:DepreciationAmortization of intangible assetsDeferred income taxesStock‐based compensationOther, netChanges in operating assets and liabilities, net of effects from acquisitions:Decrease in trade receivables, netDecrease in prepaid expenses and other assetsDecrease in accounts payable and other liabilitiesDecrease in income taxes payableDecrease in deferred revenuesNet cash provided by operating activitiesCash Flows From Investing Activities:Purchases of marketable securities and other investmentsProceeds from maturities of marketable securities and other investmentsProceeds from sales of marketable securitiesAcquisitions, net of cash acquiredCapital expendituresNet cash provided by investing activitiesCash Flows From Financing Activities:Payments for repurchases of common stockProceeds from issuances of common stockShares repurchased for tax withholdings upon vesting of restricted stock‐based awardsPayments of dividends to stockholdersRepayments of borrowingsOther, netNet cash used for financing activitiesEffect of exchange rate changes on cash and cash equivalentsNet increase (decrease) in cash and cash equivalentsCash and cash equivalents at beginning of period7,019 65)(35,595)(44)(85)3,315(6,900)20,514 Cash and cash equivalents at end of period67,34323,82921,620 14,720
ORACLE CORPORATIONQ3 FISCAL 2020 FINANCIAL RESULTSFREE CASH FLOW ‐ TRAILING 4‐QUARTERS (1)( in millions)Fiscal 2019Q1GAAP Operating Cash Flow Capital ExpendituresFree Cash Flow % Growth over prior yearGAAP Net IncomeFree Cash Flow as a % of Net Income Q2Fiscal 2020Q3Q415,542 15,238 14,789(1,646)(1,468)(1,625)13,896 13,770 13,16410%10%3,708 3,827 375% (1%)10,619360%124% Q1Q2Q4Q314,551 13,829 13,796 13,947(1,660)(1,663)(1,591)(1,544)12,891 12,166 12,205 12,403(6%)(12%)(11%)11,083 10,955 10,933 116%111%112%(6%)10,759115%(1) To supplement our statements of cash flows presented on a GAAP basis, we use non‐GAAP measures of cash flows on a trailing 4‐quarter basis to analyze cash flow generated from operations.We believe free cash flow is also useful as one of the bases for comparing our performance with our competitors. The presentation of non‐GAAP free cash flow is not meant to be considered inisolation or as an alternative to net income as an indicator of our performance, or as an alternative to cash flows from operating activities as a measure of liquidity.7
ORACLE CORPORATIONQ3 FISCAL 2020 FINANCIAL RESULTSSUPPLEMENTAL ANALYSIS OF GAAP REVENUES (1)( in millions)Q1REVENUES BY OFFERINGSCloud services and license supportCloud license and on‐premise licenseHardwareServicesFiscal 2019Q3Q2Q4TOTALQ1Fiscal 2020Q3Q2Q4TOTAL 6,609 8679048136,637 1,2178918176,662 1,2519157866,799 26,7072,5205,8559943,7048233,240 6,805 8128157866,811 1,1268718066,9301,231857778 20,5463,1692,5422,372 9,193 9,562 9,614 11,136 39,506 9,218 9,614 9,796 (4%)(5%)(1%)2%2%3%4%3%2%1%3%2%2,580 4,0296,609 2,621 4,0166,637 2,637 4,0256,662 2,704 4,1016,805 2,753 4,0586,811 AS REPORTED REVENUE GROWTH RATESApplications cloud services and license supportInfrastructure cloud services and license supportTotal cloud services and license %3%6%2%4%5%2%3%CONSTANT CURRENCY GROWTH RATES (2)Applications cloud services and license supportInfrastructure cloud services and license supportTotal cloud services and license %4%5%6%3%4%5,161 2,5761,4569,193 5,243 2,7821,5379,562 5,150 2,5531,5159,218 5,304 2,6951,6159,614 5,3632,8351,5989,796 15,8178,0834,729 28,629Total revenuesAS REPORTED REVENUE GROWTH RATESCloud services and license supportCloud license and on‐premise licenseHardwareServicesTotal revenuesCONSTANT CURRENCY GROWTH RATES (2)Cloud services and license supportCloud license and on‐premise licenseHardwareServicesTotal revenuesCLOUD SERVICES AND LICENSE SUPPORT REVENUESBY ECOSYSTEMApplications cloud services and license supportInfrastructure cloud services and license supportTotal cloud services and license supportGEOGRAPHIC REVENUESAmericasEurope/Middle East/AfricaAsia PacificTotal revenues 2,716 10,5534,08316,1546,799 26,7075,266 6,184 21,8562,7813,13211,2701,5671,8206,3809,614 11,136 39,506 2,8094,1216,930 8,26512,281 20,546(1) The sum of the quarterly information presented may vary from the year‐to‐date information presented due to rounding.(2) We compare the percent change in the results from one period to another period using constant currency disclosure. We present constant currency information to provide a framework forassessing how our underlying businesses performed excluding the effect of foreign currency rate fluctuations. To present this information, current and comparative prior period results forentities reporting in currencies other than United States dollars are converted into United States dollars at the exchange rates in effect on May 31, 2019 and 2018 for the fiscal 2020 and fiscal2019 constant currency growth rate calculations presented, respectively, rather than the actual exchange rates in effect during the respective periods.8
APPENDIX AORACLE CORPORATIONQ3 FISCAL 2020 FINANCIAL RESULTSEXPLANATION OF NON‐GAAP MEASURESTo supplement our financial results presented on a GAAP basis, we use the non‐GAAP measures indicated in the tables, which excludecertain business combination accounting entries and expenses related to acquisitions, as well as other significant expenses includingstock‐based compensation, that we believe are helpful in understanding our past financial performance and our future results. Our non‐GAAP financial measures are not meant to be considered in isolation or as a substitute for comparable GAAP measures and should beread only in conjunction with our consolidated financial statements prepared in accordance with GAAP. Our management regularly usesour supplemental non‐GAAP financial measures internally to understand, manage and evaluate our business and make operatingdecisions. These non‐GAAP measures are among the primary factors management uses in planning for and forecasting future periods.Compensation of our executives is based in part on the performance of our business based on these non‐GAAP measures. Our non‐GAAPfinancial measures reflect adjustments based on the following items, as well as the related income tax effects related to each of thebelow items except for the impact of the U.S. Tax Cuts and Jobs Act of 2017: Cloud services and license support revenues: Business combination accounting rules require us to account for the fair values of cloudservices and license support contracts assumed in connection with our acquisitions. The non‐GAAP adjustments to our cloud servicesand license support revenues are intended to include, and thus reflect, the full amount of such revenues. We believe the adjustments tothese revenues are useful to investors as a measure of the ongoing performance of our business as we generally expect to experiencehigh renewal rates for these contracts at their stated values during the post combination periods. Stock‐based compensation expenses: We have excluded the effect of stock‐based compensation expenses from our non‐GAAPoperating expenses and net income measures. Although stock‐based compensation is a key incentive offered to our employees, and webelieve such compensation contributed to the revenues earned during the periods presented and also believe it will contribute to thegeneration of future period revenues, we continue to evaluate our business performance excluding stock‐based compensation expenses.Stock‐based compensation expenses will recur in future periods. Amortization of intangible assets: We have excluded the effect of amortization of intangible assets from our non‐GAAP operatingexpenses and net income measures. Amortization of intangible assets is inconsistent in amount and frequency and is significantly affectedby the timing and size of our acquisitions. Investors should note that the use of intangible assets contributed to our revenues earnedduring the periods presented and will contribute to our future period revenues as well. Amortization of intangible assets will recur infuture periods. Acquisition related and other expenses; and restructuring expenses: We have excluded the effect of acquisition related and otherexpenses and the effect of restructuring expenses from our non‐GAAP opera
Oracle Investor Relations Oracle Corporate Communications 1.650.607.0349 1.212.508.7935 ken.bond@oracle.com deborah.hellinger@oracle.com Oracle Announces Fiscal 2020 Third Quarter Financial Results Q3 FY20 GAAP EPS up 4% to 0.79 and Non-GAAP EPS up 11% to 0.97 Total Revenues of 9.8 billion, up 2% year-over-year and 3% in constant currency .