Transcription
Atmos. Meas. Tech., 8, 4383–4397, 4/amt-8-4383-2015 Author(s) 2015. CC Attribution 3.0 License.Real-time remote detection and measurement for airborne imagingspectroscopy: a case study with methaneD. R. Thompson1 , I. Leifer2 , H. Bovensmann3 , M. Eastwood1 , M. Fladeland4 , C. Frankenberg1 , K. Gerilowski3 ,R. O. Green1 , S. Kratwurst3 , T. Krings3 , B. Luna4 , and A. K. Thorpe11 JetPropulsion Laboratory, California Institute of Technology, Pasadena, CA, USAResearch International, Solvang, CA, USA3 University of Bremen, Institute of Environmental Physics, P.O. Box 330440, 28334 Bremen, Germany.4 NASA Ames Research Center, Moffett Field, CA, USA2 BubbleologyCorrespondence to: D. R. Thompson (david.r.thompson@jpl.nasa.gov)Received: 15 March 2015 – Published in Atmos. Meas. Tech. Discuss.: 22 June 2015Revised: 10 September 2015 – Accepted: 10 September 2015 – Published: 19 October 2015Abstract. Localized anthropogenic sources of atmosphericCH4 are highly uncertain and temporally variable. Airborneremote measurement is an effective method to detect andquantify these emissions. In a campaign context, the scienceyield can be dramatically increased by real-time retrievalsthat allow operators to coordinate multiple measurements ofthe most active areas. This can improve science outcomesfor both single- and multiple-platform missions. We describea case study of the NASA/ESA CO2 and MEthane eXperiment (COMEX) campaign in California during June and August/September 2014. COMEX was a multi-platform campaign to measure CH4 plumes released from anthropogenicsources including oil and gas infrastructure. We discuss principles for real-time spectral signature detection and measurement, and report performance on the NASA Next Generation Airborne Visible Infrared Spectrometer (AVIRISNG). AVIRIS-NG successfully detected CH4 plumes in realtime at Gb s 1 data rates, characterizing fugitive releasesin concert with other in situ and remote instruments. Theteams used these real-time CH4 detections to coordinatemeasurements across multiple platforms, including airbornein situ, airborne non-imaging remote sensing, and groundbased in situ instruments. To our knowledge this is the firstreported use of real-time trace-gas signature detection in anairborne science campaign, and presages many future applications. Post-analysis demonstrates matched filter methods providing noise-equivalent (1 ) detection sensitivity for1.0 % CH4 column enhancements equal to 141 ppm m.1IntroductionAirborne imaging spectrometers have been deployed for awide range of scientific, regulatory, and disaster responseobjectives. Traditionally these campaigns wait for favorableenvironmental conditions and then fly pre-arranged surveypatterns (typically “mowing the lawn”), recording data forpost-flight radiometric calibration and geolocation. Significant time can pass before data are analyzed fully, and results often arrive too late for mid-course corrections duringthe campaign. However, improvements in computing power,communication, and telemetry are changing this situation.Tactical remote measurement generates in-flight calibrateddata products to inform a real-time adaptive survey strategy.This can be coordinated to direct other platforms in multiplatform campaigns. We use the term “tactical” to emphasize environmental awareness and real-time decision making,with no military connotation. Its applications include the following.i. Detection of transient or rare targets – Many airbornemissions hunt isolated or nonstationary phenomena.Examples include trace-gas emissions (Aubrey et al.,2015; Gerilowski et al., 2015), algal blooms (Karaskaet al., 2004), invasive species (Ustin et al., 2002), isolated microhabitats (Thompson et al., 2013b), and hurricane intensity (Braun et al., 2013). Aircraft use radarto hunt extreme weather, and lidar to find cirrus, thunderstorms or biomass burning (Rolph, 2003). In eachcase, tactical remote measurement can identify desiredPublished by Copernicus Publications on behalf of the European Geosciences Union.
4384D. R. Thompson et al.: Real-time remote detection and measurementfeatures (and equally importantly, their absence) during flight, permitting flight plan adjustments to improvecoverage (Davis et al., 2010). This reveals features’temporal evolution and improves measurement confidence. During multi-platform campaigns, real-time environmental awareness can guide teams acquiring complementary in situ measurements.ii. Disaster response – Remote measurements play a critical role in disaster response to oil spills (Leifer et al.,2012; Clark et al., 2010; Reuter et al., 1995), searchand rescue (Eismann et al., 2009), fires (Ambrosia et al.,2003, 2011; Mandl et al., 2008; Dennison and Roberts,2009), and earthquakes (Kruse et al., 2014). In any disaster, information arrives at the incident command center from a range of sources of differing reliability. Remote measurements can contribute repeatable and objective analysis, allowing more efficient, confident allocation of ground and airborne assets while keeping responders safe. The immediate risks to human life demand short response times, for which tactical measurement can provide situational awareness.iii. Data quality assurance – Tactical remote measurementadds flexibility and confidence to flight management decisions. Currently, mid-campaign flight planning oftenoccurs without knowing the quality of data already collected. This risks wasting resources if, for example, themission continues under marginal environmental conditions. On the other hand, conservative planning canmiss opportunities. Tactical science products can informflight plans and mid-day scrub decisions to avoid spending flight hours on low-value or redundant data. For example, it may reveal interference such as cirrus clouds(Gao et al., 1993a), sun glint (Kay et al., 2009), andunacceptable aerosol scattering (Bojinski et al., 2002).This also allows instrument subsystem failures to berecognized and addressed immediately.iv. Robotic exploration – Real-time analysis can improveautonomous operations when communication opportunities are rare and bandwidth is limited, such as in spaceexploration. Remote spacecraft that are out of touchwith ground control can autonomously detect highvalue spectral signatures that guide prioritized downlinkor trigger additional measurements (Thompson et al.,2013a). Operators can generate compact map productsonboard the spacecraft and downlink them to supplement raw spectra, expanding spatial coverage at a lowbandwidth cost. Onboard cloud screening is one example of data volume reduction; it can improve yields bya factor of 2 or more for Earth orbiting instruments(Thompson et al., 2014).v. Hypothesis formation and testing – Real-time data analysis and visualization in a mapping environment, likeAtmos. Meas. Tech., 8, 4383–4397, 2015Google Earth (Google Earth, 2015), is common in surface and airborne in situ applications. Many systemsallow the scientist to visualize spatial relationships between measured parameters, forming hypotheses on thefly for immediate testing. Adaptive surveying can address new hypotheses during the campaign, while instruments are deployed and environmental conditionsare favorable. Telemetering live data allows remote investigators to observe and participate in operational decisions (Leifer et al., 2014).These techniques require high-performance data telemetryand communication. As the technologies proliferate, unanticipated applications are likely to appear – just as instant resultsfrom the digital CCD transformed chemical photography indramatic and unforeseen ways.This study demonstrates tactical remote measurement withimaging spectroscopy during a multi-aircraft, multi-platformcampaign, CO2 and MEthane eXperiment (COMEX). TheCOMEX campaign was funded by NASA and ESA to explore synergies between NASA’s proposed HyspIRI (Hyperspectral Infrared Imager) mission and ESA’s CarbonSatEarth Explorer 8 candidate mission. Greenhouse gas emissions were measured from a range of important anthropogenic sources. Investigators surveyed landfills, husbandry,and fossil-fuel production sites in southern California duringsummer and fall, 2014. A multi-scale experimental designcombined airborne and surface measurements to characterize CH4 sources on scales of meters to tens of kilometers.Ground-validated airborne imaging spectroscopy identifiedsources and their heterogeneity. This was followed by downwind surface surveys together with airborne sounding andin situ observations transecting plumes at different upwindand downwind distances. Surface mobile survey teams carried sensors to specific locations of interest. Finally, repeatedsurface in situ surveys studied longer term temporal variability and larger spatial context.COMEX exploited tactical remote measurements frommultiple platforms. We focus on one participating instrument, the Airborne Visible Infrared Spectrometer - NextGeneration (AVIRIS-NG) (Hamlin et al., 2011; Green et al.,1998), which mapped CH4 enhancements in real time. Asimple detection method based on a band ratio (BR) was sufficient to detect several sources and enhance the COMEXcampaign. These initial results motivated the development ofa more sophisticated matched filter detection approach, described in this paper, which was developed after COMEXand has been adopted by subsequent CH4 monitoring campaigns. Although prior studies quantified CH4 anomalies using Visible Shortwave Infrared (VSWIR) imaging spectrometers (Roberts et al., 2010; Bradley et al., 2011), we believethe COMEX campaign to be the first real-time tactical deployment for remote trace-gas imaging.Section 2 describes the real-time algorithms, system architecture, and implementation decisions. Section 3 reviews thewww.atmos-meas-tech.net/8/4383/2015/
D. R. Thompson et al.: Real-time remote detection and measurementcampaign results including an AVIRIS-NG sensitivity analysis and discussion of lessons learned. We conclude with adiscussion of future directions for tactical remote sensing.2Tactical imaging spectroscopyThe visible/shortwave infrared (VSWIR) imaging spectrometers serve diverse applications including mineralogical mapping (Kruse, 2012), characterization of coastal and terrestrial ecosystems (Ustin et al., 2004), and atmospheric studies (Popp et al., 2012). Imaging spectrometers are valuablefor tactical operations because they can map and localizetargets over wide areas, providing reconnaissance for otherinstruments along with spatial and spectral context. Realtime airborne imaging spectroscopy has been deployed in afew previous instances. For example, Thompson et al. (2014)demonstrated real-time cloud screening for future space missions. Bue et al. (2015) calculated reflectance products using the model-based ATREM atmospheric correction. Eismann et al. (2009) demonstrated the ARCHER system whichprovided real-time processing for search and rescue applications. They performed matched filter spectral signature detection and change detection using the chronochrome method(Schaum and Stocker, 1998). They also demonstrated spectral anomaly detection using the Reed–Xiaoli (RX) detector(Stein et al., 2002), an anomaly score based on the Mahalanobis distance (Chang and Chiang, 2002). These methodsdetected artificial objects in wilderness scenes, such as partsof aircrafts and vehicles near crash sites. Another real-timeairborne investigation used non-imaging spectroscopy for detecting dangerous volcanic plumes (Vogel et al., 2011). Onthe ground, real-time analysis has imaged these plumes’ SO2and SiF4 absorption (Lübcke et al., 2013; Stremme et al.,2012), enabling subsequent analysis to infer emission ratesKrueger et al. (2013).This section describes the real-time system used byAVIRIS-NG during the COMEX campaign. AVIRIS-NGmeasures reflected sunlight in the 0.38–2.5 µm range with0.005 µm spectral resolution. Its 1 mrad instantaneous field ofview (iFOV) provides sub-meter ground sampling distance(GSD). The real-time system characterizes CH4 plumes byanalyzing absorption features from 2.1–2.4 µm (Clark et al.,2009). Its design must balance the competing needs of speedand algorithm sensitivity, and several guiding requirementsdrive our decisions.First, the system must provide a sensitivity floor sufficientto detect the phenomena of interest reliably. In other words,it must have a signal to noise ratio (SNR) sufficient to findsources under relevant wind, illumination, and substrate conditions. Only then can planners safely act on a null detectionresult. For similar reasons, it must minimize false positives.Prior studies of CH4 with the “Classic” AVIRIS instrumentby Thorpe et al. (2014) detected local enhancements of 1 ppmwithin a kilometer-thick atmospheric model layer. Later studwww.atmos-meas-tech.net/8/4383/2015/4385ies by Thorpe et al. (2015) using AVIRIS-NG found similarenhancements in the distal regions of plumes associated withCH4 fluxes of 14.2 m3 h 1 (500 standard cubic feet per hour,scfh) under moderate (5 m s 1 ) winds. Resolving plumes ofthis magnitude under similar conditions should be possiblewith a sensitivity of 1000 ppm m. Better performance wouldfurther reduce ambiguity and improve the detail of diffuseplumes.A second requirement is high spatial resolution. The phenomena should subtend multiple pixels with sufficient resolution for the operator to identify typical morphologies. Thediagnostic shape of atmospheric plumes can be corroboratedwith ancillary wind information (Dennison et al., 2013),while in the case of oil slicks thickness asymmetry and shapeare useful cues (Leifer et al., 2012). For plumes, resolution can enhance detection sensitivity due to non-uniformity:many plumes are initially buoyant, rising abruptly in a column for tens of meters before dispersing downwind. Highspatial resolution avoids diluting this feature, which may beonly a few meters in diameter. Fine spatial resolution alsohelps exclude false positives caused by artificial features withobvious geometric shapes. For these reasons, we desired thatthe system would process AVIRIS-NG at native resolutionwithout subsampling.A third requirement is speed. Speed follows a “threshold”utility function: the system must operate at the instrumentdata rate, but additional performance provides no extra benefit. Real-time operation avoids a confusing temporal association puzzle where a detection appears at a location passedseconds or minutes ago. In addition, keeping pace with datacollection simplifies operations by permitting the system tooperate whenever the instrument collects data. We find itpossible to implement many of the most common detection methods from literature within this requirement, thoughspeed considerations determine the physical quantities thatwe retrieve. Specifically, we focus on measuring plume absorption along the optical path. This is sufficient to indicatethe relative strengths of different sources. We do not estimatethe vertical structure or flux; such products generally requirecomplex iterative retrievals involving ancillary data such aswind speed, and are less critical for real-time decisions.The real-time system first executes the standard AVIRISNG ground data pipeline to create calibrated radiance measurements. It then matches these spectra to the known gasabsorption signature of CH4 . The procedure successfully operates at instrument data rates of approximately 500 Mb s 1and allows operators to detect CH4 emissions in real time.The following sections detail specific design choices for thesoftware architecture and detection algorithms.2.1Instrument and software architectureThe AVIRIS-NG instrument acquires 598 cross-track spectra at 100 Hz. Frames are captured with a custom field programmable gate array (FPGA) frame grabber over a dediAtmos. Meas. Tech., 8, 4383–4397, 2015
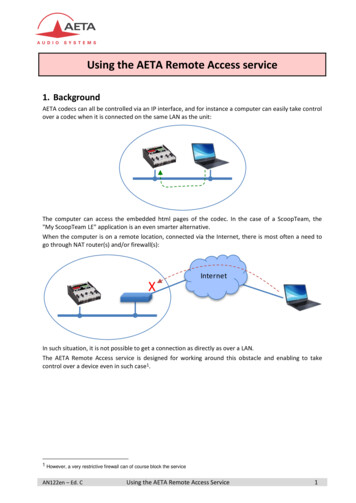
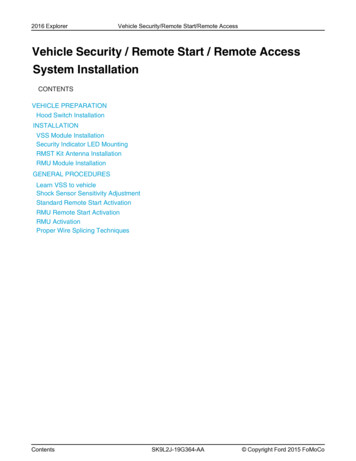
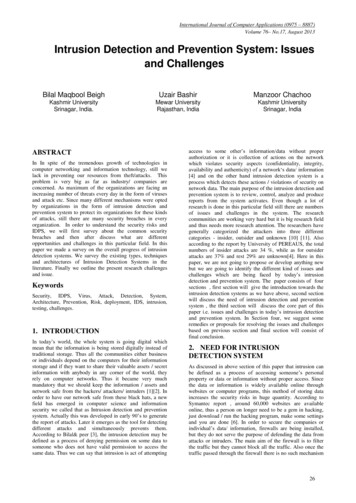
4386D. R. Thompson et al.: Real-time remote detection and measurement0 0.02 0.04 0.06Value 0.08 0.1 0.12 0.14CH4 tranmsission 1 0.16Signature x 104 0.18 0.22.12.152.22.252.32.35Wavelength (microns)2.42.452.5Figure 2. A comparison of spectral shapes between the CH4 transmission spectrum, resampled to AVIRIS-NG wavelengths, and thetarget signature t used for detection. The vertical axis plots two different quantities as noted in the legend. Both signatures were calculated from a 20-layer atmosphere based on HITRAN 2012 absorption cross sections (Brown et al., 2013).Figure 1. The computing architecture for real-time spectral analysisleverages multi-core parallelism.1cated Camera Link interface at 500 Mb s data rate. Dataare synchronized with an onboard inertial measurement unit(IMU)/GPS system (Keymeulen et al., 2014), and finallystored in a solid-state RAID array. The AVIRIS-NG consolerecords un-orthorectified raw data and displays it for the operator. A backup computer records a second copy in parallel, and the detection system runs on this machine. Real-timeanalysis requires that detection algorithms keep pace with thedata recording rate, while leaving enough CPU cycles for thebackup data recorder.Our solution exploits parallelism with multi-core CPUs(Fig. 1). A watchdog process waits for a new image to appear on disk. As the instrument writes to this file, an executive real-time process begins reading from the other end andbuffering 1000 lines at a time. The real-time analysis appliesradiometric calibrations to each 1000-line block and partitions the resulting data into spatially independent regionsfor multi-thread detection. When all threads have finished,the results are reassembled and recorded to storage, wherethey are immediately available on the operator display. Thesystem processes 10 s intervals of data in well under 10 s,achieving the real-time speed requirement.2.2Onboard radiance processingThe detection pipeline first transforms the frame (a singlecross-track slice of data) to a calibrated radiance product(Green, 1998; Hamlin et al., 2011). We calculate radiance inW cm 2 nm 1 sr 1 at each cross-track spatial location c andAtmos. Meas. Tech., 8, 4383–4397, 2015wavelengthusing:Lm (c, ) (R(c, )Rd (c, )Rp (c))r( ),f (c, )(1)where R(c, ) are the raw digital numbers from the instrument. Rd (c, ) is the electronic dark current estimated froma closed-shutter segment at the beginning of each flight line.Rp (c) are electronic “pedestal shift” effects, in which a spatially compact signal depresses the signal at other spatial locations. The onboard system estimates the pedestal shift ofeach spectrum based on the residual dark current in nonilluminated edges of the detector. r( ) and f (c, ) are theradiometric calibration coefficients and flat field corrections,respectively. Both are calculated from laboratory calibrationsequences using a known spatially uniform illuminant underfixed imaging geometry. Appendix A discusses wavelengthcalibration.2.3Onboard signature detectionFigure 2 shows a typical CH4 transmission signature, calculated using a model atmosphere with absorption coefficients of Brown et al. (2013). The detection algorithm calculates a scalar score to estimate any local enhancement ofthis background. We evaluated several detection algorithmsbased on their sensitivity and speed. At one extreme, an iterative nonlinear or “optimal estimation” solution such asiterative maximum a posteriori differential optical absorption spectroscopy (IMAP-DOAS) (Frankenberg et al., 2005;Thorpe et al., 2014) is more quantitative, but somewhat slowfor real-time operation. At the other extreme, an absorptionband depth score uses simple arithmetic, but its low SNR candetect only the strongest signatures. This paper focuses ona third approach: a novel matched filter variant with a goodbalance of sensitivity, stability, and speed, and which alsopermits a quantitative /
D. R. Thompson et al.: Real-time remote detection and measurementOur first algorithm uses a continuum interpolated band ratio (CIBR), defined as the depth of an absorption feature relative to a local linear continuum (Green et al., 1989; Brueggeet al., 1990). It is written as follows:CIBR wleft Lm (c,Lm (c, center )left ) wright Lm (c,right ),(2)where center , left , and right are wavelengths in the middleand either side of the absorption feature. The weighting coefficients w sum to unity, and make the denominator the linearly interpolated continuum at the location of the absorptioncenter center . We find the 2.37 µm feature provides the bestoverall contrast. The CIBR method is simple to implementand fast to execute. For the sources studied during COMEX,its sensitivity is sufficient to detect strong local CH4 enhancements.The second detection strategy is a classical matched filter(Manolakis et al., 2014), a variant of which was used previously for CH4 detection by Thorpe et al. (2013). The matchedfilter tests each spectrum against a target signature t whileaccounting for the background covariance. Here t is a vectorwith one element per wavelength. If the background spectraare distributed as a multivariate Gaussian N with mean vector µ and covariance matrix 6, the matched filter is equivalent to a hypothesis test between the case H0 where the targetis absent and H1 where it is present.H0 : Lm N (µ, 6)H1 : Lm N (µ t , 6)(3)(4)Here, t is the target signature. The matched filter estimatesthe scalar value , the fraction of the target (potentially largerthan unity) which perturbs the background. Larger values of signify a stronger match. The matched filter is written.(t µ̂)T 6̂ 1 (x µ̂) (x) q(t µ̂)T 6̂ 1 (t µ̂)(5)The hat symbols indicate that the background mean vectorand covariance matrix are estimated using samples from thescene. One typically draws samples from a rectangular region near the target. However, most push-broom sensors havea slightly nonuniform behavior at different cross-track positions, which violates the Gaussian background assumption.The cross-track push-broom elements are separate detectors,so it often is better to model their noise distributions independently. Thus, we apply an independent matched filter toeach column of the (non-orthorectified) image, calculating anew µ and 6 for each cross-track element. This columnwisematched filter dramatically reduces the number of samplesavailable for estimating each 6. We compensate by estimating a stable, low-rank approximation of the inverse samplecovariance as in Manolakis et al. (2009). The covariance matrix 6 decomposes as product of p column eigenvectors qwww.atmos-meas-tech.net/8/4383/2015/4387and p eigenvalues :6 pXTi qi qi .(6)i 1The top d eigenvalues approximate the inverse. With theidentity matrix I and trace operator tr, we have"#dX1i1T6̂ Iqi qi ,(7) ii 1 !dX1 tr6(8)i .p di 1We typically estimate 30 eigenvalues for vertical blocks consisting of 1000–2000 samples per column.2.4Target signaturesThe signature t should match the spectrum of the target feature. A reasonable approach is to use the transmission shapeitself (the red curve in Fig. 2). However, this is inaccuratewhen absorption is strong; further attenuation becomes nonlinear as absorption lines saturate. The matched filter assumes a linear perturbation, so the Jacobian of the radiancespectrum is an appropriate signature. We calculate it by modeling local CH4 enhancement as a uniform cell. The airborneinstrument measures absorption along a path transecting theCH4 cloud. For thin, uniform plumes, the unknown quantitiesof absorption length and concentration are interchangeable,so we consider the combined quantity, the mixing ratio lengthexpressed in ppm m (Sandsten et al., 2000). Our derivationis similar to that of Theiler et al. (2005). Following Eq. (4)the matched filter estimates , which is a multiplicative scaling of the target signal that perturbs the mean backgroundradiance µ. This background includes absorption by ambientCH4 . Under hypothesis H1 , a local enhancement acts as aconcentration-dependent absorption coefficient ( ) and absorption path length . For clarity, we write this relation witha functional form µ( ) to represent a single wavelength ofthe mean vector µ.H1 : Lm ( ) µ( )e ( ) (9)For x near zero, the first-order Taylor expansion exp(x) 1 x permitsH1 : Lm ( ) µ( ) ( ) µ( ).(10)Combining all wavelengths using vector notation, and folding unknowns into , yieldsH1 : Lm µ t 1 .(11)This is the form of the matched filter model. The target signature t 1 is the vector of negative absorption coefficients forAtmos. Meas. Tech., 8, 4383–4397, 2015
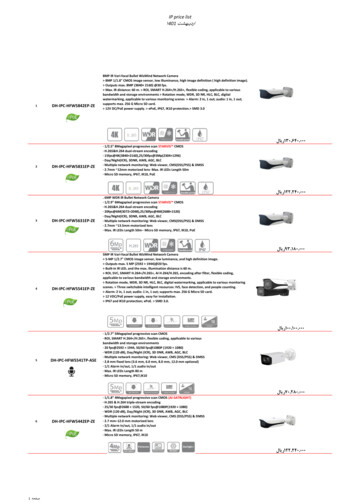
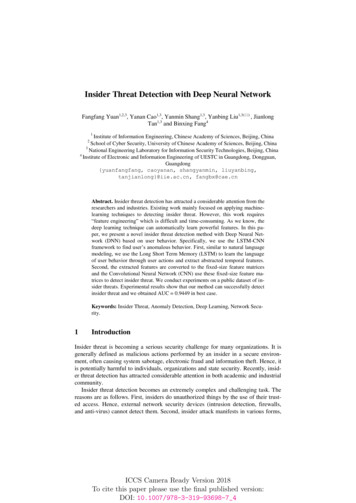
4388D. R. Thompson et al.: Real-time remote detection and measurementa near-surface plume of unit concentration and unit length,multiplied by the background mean radiance. The resultingmatched filter estimates , the scaling of the unit concentration path length. The target signature represents the perturbation, in radiance units, of the background radiance by anadditional unit mixing ratio length of CH4 absorption, whichacts as a thin Beer-Lambert attenuation of the (already attenuated) background µ. Evaluating the partial derivative ofEq. (9) at 0 gives@Lm ( ) @lµ( )e ( ) ( ) µ( ) ( ).(12)We can estimate the enhancement of CH4 using the linearscaling of a target signature that perturbs the mean radiance;that signature is defined as the negative absorption coefficient scaled by the (wavelength-dependent) radiance. Figure 2 compares the shape of the Jacobian target signature tothe typical transmission signature of ambient CH4 .The linearization works for thin plumes even when thebackground is saturated, because deviations are small andcan be modeled linearly to permit a fast yet accurate quantitative retrieval (Thorpe et al., 2013). It ignores scatteringeffects, which is a reasonable compromise at low flight altitudes; spectral features caused by actual CH4 enhancementsby far exceed typical retrieval biases that could be inducedby atmospheric scattering (Thorpe et al., 2013). In addition, Rayleigh and aerosol scattering is much lower in the2.3 µm region than in the UV and visible spectral range. Thelinearized approach is complementary to other more complete retrieval algorithms, such as the IMAP-DOAS approach(Frankenberg et al., 2005; Thorpe et al., 2014).2.5Operator displayAfter the detection stage maps plume intensities, an interface displays this information to the operator in a more tactically useful format. Specifically, the display overlays detected plumes on RGB images for visual interpretation andlocalization (Fig. 3). It supports variable detection thresholdsso the operators can set the cutoff concentration according totheir tolerance for false positives. This is important becausesource strength varies and the detection sensitivity changeswith solar zenith angle. Also, it is important that the system preserve the overlay images in memory until explicitlyreset, so that the operator has time to consider ambiguousdetections. Figure 3 was produced by playing back a Juneflight line using a recent iteration of the detection software. Asimple, intuitive interface minimizes unnecessary controls. Avertical slider scrolls the flight line to review previously collected data. During recording, the system appends data to theend of this image. A horizontal slider adjusts the detectionthreshold, allowing the operator to change the overlay sensitivity based on their tolerance for error. Bright red pixelssignify a strong signal well above the threshold, while darkred pixels signify an ambiguous signal.Atmos. Meas. Tech., 8, 4383–4397, 2015Figure 3. Screen shot of the graphical user interface, with an example of flight data from 13 June (ang20140613t184239). The redplume is displayed overprinted on RGB wavelengths. Real-time localization was implemented for use after the COMEX campaign,and we have redacted the precise coordinates in this image.3Results from the COMEX campaignCOMEX field data collection included the Kern River, KernFront, and Poso Creek Oil Fields, located to the north andnorthwest of Bakersfield, CA in the San Joaquin Valley(Fig. 4). Along with AVIRIS-NG, the COMEX campaign deployed a second aircraft: the CIRPAS Twin Otter, which carried the Methane Airborne MAPper (MAMAP) (Gerilowskiet al., 2011; Krings et al., 2011), a non-imaging spectrometer, and an in situ Picarro CH4 sensor sponsored by NASA,Ames. The campaign also deployed the AutoMObile greenhouse Gas Surveyor (AMOG) car-mounted system for in situCH4 and wind measurement (Leifer et al., 2014). These platforms used several real-time displays and communicationslinks. AMOG used a map overlay (Google Earth, 2015) displaying CH4 measurements along with the wind direction.MAMAP was modified for COMEX to deliver real-time retrieved CH4 information using a WFM-DOAS algorithm described in Krings et al. (2011, 2013). These data were displayed on the MAMAP instrument scientist aboard the aircraft, and overlaid on a map (Google Earth, 2015) for tacticaldecision making. MAMAP also transmitted its real-time CH4measurements together with telemetry and data from otherCIRPAS sensors to the CIRPAS data acquisition and assimilation system, where they were downlinked by satellite to thecommand center. All aircraft were tracked during the missionusing the Airborne Science Mission Tools Suite (Duley et al.,2011), the ground segment to the NASA Airborne ScienceSensor Network (Van Gilst and Sorenson, 2011). This systemprovided a web-based service for real-time communicationswww.atmos-meas-tech.net/8/4383/2015/
D. R. Thompson et al.: Real-time remote detection and igure 4. Kern Oil Fields, Bakersfield, CA (Google Earth, 2015).Oil field locations are from California Department of Conservation(1998). White circles indicate the locations of Figs. 6–10.CIRPAS / MAMAP!250 m!0Figure 6. Region of high activity in flight line 2 of the 2 Septemberflight lines. All values in ppm m.AV
in concert with other in situ and remote instruments. The teams used these real-time CH4 detections to coordinate measurements across multiple platforms, including airborne in situ, airborne non-imaging remote sensing, and ground-based in situ instruments. To our knowledge this is the first reported use of real-time trace-gas signature .