Transcription
Building Science Reading Fluency for Students with Disabilities withRepeated Reading to a Fluency CriterionDouglas E. Kostewicz and Richard M. Kubina Jr.The current study investigated the effects of repeated readings to a fluency criterion with science text forseven students with disabilities using multiple probe multiple baselines across participants. Results indicatedstudents met criteria on four consecutive passages. As shown on Standard Celeration Charts a majority ofstudents' correct words per minute accelerated while incorrect words per minute decelerated on successiveinitial, intervention readings demonstrating reading transfer. Students' reading scores during post-test andmaintenance out performed pre-test and baseline readings providing additional measures of reading transfer.The study also suggested a relationship with comprehension; students scored higher on oral retell measuresafter meeting criterion when compared to initial readings. Overall, repeated readings to a fluency criterionintervention improved science reading fluency for students with disabilities.In 1996, the National Research Council published a document entitled National Education Science Standards and witha sentence summarized their intent: Science standards forall students (An Overview, paragraph 4). Currently, 90% ofschools maintain the same science standards for all students(U.S. Department of Education, 2006) however; the gains forstudents with disabilities fall well behind their nondisabledpeers. In 2005, an average of 30% of students with disabilitiesin the 4th, 3th, and 12th grades scored at or above basic proficiency in science compared to an average of 60% of sameaged students without disabilities (Grigg, Lauko, & Brockway, 2006).Students with disabilities often do not experience -thesame academic success as those without disabilities. Yet thediscrepancy in science may pose an even greater problem.The Individuals with Disabilities Education Act [IDEA] (U.S.Department of Education, 2006) reports that 80% of secondary students with high incidence disabilities (e.g., specificlearning disabilities, emotional disturbance) take science withtwo-thirds receiving instruction in a general education setting.Therefore, many students with disabilities perform well belowtheir peers in science and receive instruction in the same setting with the same standards.Modifications, Accommodations, and ScienceEducation ReformTo aid students with disabilities, 65% receive some formof modification in academic areas (U.S. Department of Education, 2006). Some modifications to science instructioninclude oral instead of written answers (Cawley & Parmar,2001), changes to instructional materials (Ormsbee & Pinson,2000), and adaptations to textbooks in the form of study guides(Horton & Lovitt, 1989) and/or graphic organizers (Bergerud,Learning DisabilitiesLovitt, & Horton, 1988). Additionally, direct (McCleery &Tindal, 1999), strategy (Guastello, Beasley, & Sinatra, 2000;Smith, Dittmer, & Skinner, 2002), and mnemonic instruction(King-Sears, Mercer, & Sindelar, 1992; Mastropieri, Scruggs,McLoone, & Levin, 1985; Mastropieri, Scruggs, & Levin,1986; Scruggs, Mastropieri, Levin, & Gaffney, 1985) havehelped students with disabilities in science. Finally, somehave suggested using technology or augmentative devicessuch as a television (Williams & Hounshell, 1998), computer(Kumar & Wilson, 1997), or communication device (Davies,1994).Science instruction modifications and adaptations servea dual purpose, not only addressing difficult science content,but also attending to the documented difficulties students withdisabilities have with reading (U.S. Department of Education,2006). Teachers using science textbooks as the instructionalmedium presuppose that students can proficiently interactwith the material (Cawley, Foley, & Miller, 2003). Sciencetextbooks oftentimes read at a higher grade level than statedand contain information in a disorganized fashion (Ofiesh,2007), while students with learning disabilities traditionallyhave difficulties with decoding and comprehension (Lynch ,2007). Such a combination hinders a student's ability to improve conceptual science understanding (Cawley & Parmar,2001; Parmar, Deluca, & Janczak, 1994; Woodward, 1994).Despite reading deficits, students with disabilities must stillhave opportunities to learn and display science knowledge(Cawley & Parmar, 2001).To address the problem of science instruction for students with disabilities many researchers (e.g., Cawley & Parmar, 2001; Grumbine & Alden, 2006; Williams & Hounshell,1998) recommend reforming science education (see AAAS,2008; NSF, 2005; Rutherford & Ahlgren, 1990). One proposal advocates teachers shifting from textbook-based towardinquiry- and activity-based science instruction.89Volume 17, Number 3
Building Science Reading Fluency with RRFCInquiry- and activity-based classrooms actively engagestudents during instruction thus increasing opportunities forparticipation in discussions and other group-orientated activities (Freeman & Taylor, 2006; Le, et al., 2006). Through multiple avenues, students purportedly connect information acrosssubjects, relate new experiences to previous experiences, andfurther develop conceptual, rather than factual, scientific understanding (Champagne, Newell, & Goodnough, 1996; Freeman & Taylor; 2006; Fox, Grosso, & Tashlik, 2004; McKee& Ogle, 2005). Therefore, language-based (e.g. activity- orinquiry-based) interventions and accommodations provide away for students with disabilities to interact with, learn, anddisplay science knowledge minimizing the effect of readingdeficits (Cawley & Parmer, 2001; Rivard, 2004).To one degree or another, many of the science modifications, adaptations, and reforms have students with disabilitiesspending less time engaged in decoding and comprehensionof science text. Nevertheless, reading plays a crucial role inscience (Deshler, et al.; 2001). The ability to read competently helps continue the scientific process (e.g., communication of scientific knowledge) and allows students to integratescience with literature enhancing scientific literacy (Freeman& Taylor, 2006; McKee & Ogle, 2005). A student's ability toread fluently sets the stage for their comprehension in contentareas such as science (Bhattacharya, 2006).On the other hand, Reibert (2005) employed repeatedreadings to examine reading fluency across literature text,content (i.e., science) text, and a control group for 115 students without disabilities from three separate schools. Students reread passages a minimum of three times in a varietyof formats (i.e., teacher modeled reading, echoic readingwith the teacher, peer rereading, or choral reading). Studentsacross groups did not receive similar amounts of opportunitiesto reread, reading instruction, and error correction. Averagereading rates (and standard deviations) for students readingscience passages improved from 33 (SD 35) to 66 (SD 32)words per minute, the largest average increase of the threegroups.Given the importance of-oral reading fluency for contentarea success and the limited reading fluency research conducted with science text, a specific model of repeated readings mayprovide a well suited method for science: repeated readings toa fluency criterion. Repeated readings to a fluency criterioncompared to other models of repeated readings contain manysimilar aspects such as multiple readings through the samepassage (e.g., Staubitz, Cartledge, Yurick, & Lo, 2005; Therrien & Kubina, 2007), error correction (e.g., Martens, et al.,2007; Yurick, Robinson, Cartledge, Yo, & Evans, 2006), andfeedback (e.g., Sweeney, Ring, Malanga & Lambert, 2003).The distinguishing feature between models remains the use ofa static reading criterion a student must reach before movingto the next practice passage.Initial reading fluency criteria arose from Samuels (1979)and Dahl (1974) ranging from 85-100 words per minute. Researchers also employed criteria based on reading or gradelevel norms, ranging from 30-180 correct words per minute(e.g., Carroll, McCormick, & Cooper, 1991; Mercer, Campbell, Miller, Mercer, & Lane, 2000; Staubitz, 2005; Therrien& Kubina, 2007; Therrien, Wickstrom, & Jones, 2006; Weinstein & Cooke, 1992; Yurick, et al., 2006) or in consultationwith teachers, parents, or students ranging from 75-200 correctwords per minute (e.g., Anderson & Alber, 2003; Martens , etal., 2007; Polk & Miller, 1994; Spence, 2002; Tam, Heward, &Heng, 2006). Another group of researchers (e.g., Kostewicz,& Kubina, 2010; Kubina, Amato, Schwilk & Therrien, 2008;McDowell, Mcintyre, Owen & Keenan, 1998; Sweeney et al.,2003; Teigen, Malanga & Sweeney, 2001) based criteria fromthe behavioral fluency literature which suggested ranges from180-210. A few studies included criteria limiting the numberof errors (e.g., Carroll et al.,1991; Kubina et al., 2008) whileothers counted words per minute (e.g., Staubitz, et al., 2005;Yurick et al., 2006) rather than correct words per minute. Notsurprisingly, students reading to a fluency criterion demonstrated the ability to meet the different reading criteria (e.g.,Staubitz , et al., 2005; Yurick, et al., 2006), showed readingtransfer (e.g., Kostewicz & Kubina; 2010; Samuels, 1979),and exhibited long-term retention (e.g., Kubina et al., 2008).Reading Fluency and Repeated ReadingsReading fluency has ties to overall reading ability (Fuchs,Fuchs, Hosp, & Jenkins, 2001; Shinn & Good, 1992), servesas an access point to reading comprehension (Therrien, 2004),and influences content area success (Bhattacharya, 2006).While research shows a number of methods that promote reading fluency, repeated readings has emerged as one of the mosteffective fluency-building procedures for students with disabilities (Chard, Vaughn, & Tyler, 2002; Kuhn & Stahl, 2003;Meyer & Felton, 1999). Research (Chard, et al., (2002); Kuhn& Stahl, (2003); Meyer & Felton, 1999) has shown repeatedreadings benefits with narrative text, but rarely examined theeffect of repeated readings in science which consist mostlyof expository text. The two types of text contain differences.Expository text has a greater extent of difficult vocabulary,a more straightforward presentation of information and concepts, and content that students may not readily understand(Carnine, Silbert, Kame'enui, & Tarver, 2004).Specifically, two studies (Ellis & Graves, 1990; Reibert,2005) examined the effect of repeated readings in science.Rather than focusing on reading fluency, Ellis and Gravescompared repeated readings to a paraphrasing strategy to locate the main idea within a science passage for 4 7 studentswith learning disabilities. Students found more main ideaswith the paraphrasing strategy as compared to repeated readings and a combination of both.Learning Disabilities90Volume 17, Number 3
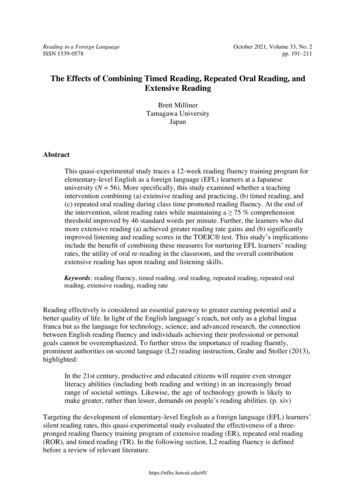
Kostewicz and KubinaPurpose and Research QuestionsMethodsPrevious repeated reading studies using science material(Ellis & Graves, 1990; Reibert, 2005) did not include a fluency criterion and either included students without disabilities(Reibert, 2005) or did not measure a reading fluency outcome(Ellis & Graves, 1990). Given that many classrooms continueto use textbooks as the primary mode of instruction and students with disabilities must still have access to science (Cawley & Parmar, 2001; Williams & Hounshell, 1998), improvingthe reading fluency of students with disabilities contributes tofuture successful outcomes within and outside of science class.Therefore, this study investigated the effects of repeated readings to a fluency criterion on reading fluency with science textfor students with disabilities. As measures of reading transfer(Faulkner & Levy, 1994; Samuels, 1979) and an indicator ofreading comprehension (Roberts, Good, & Corcoran, 2005),specific questions include:Participants and SettingSeven students (Table 1) from a public middle school in amedium-sized, suburban city participated in the current study.All students previously received special education designations based on federal definitions of each disability category(i.e., SLD and SED) and spent part of the school day in alearning support classroom which served a variety of functions (e.g., Direct Instruction reading and language instruction, essay writing, poem writing, study skills). Based onnominations from the learning support teacher, all studentsneeded assistance reading science material. Furthermore, allstudents had reading goals on their respective IndividualizedEducation Plans, received science content in another setting(i.e., general education), and had parental permission to participate. No student had experience with systematic repeatedreadings, but all had experience with timed readings. All interventions took place in the hallway outside of the classroomin one-on-one formats with the experimenter or trained datacollectors and each student.1.2.3.4.What effect will reaching a fluency criterion on onepassage have on initial, unpracticed readings of successive passages?Will reaching a fluency criterion on one passage impact the number of sessions necessary to reach fluency on successive passages?If students reach the fluency criterion on passagesfrom one chapter would that affect performance oninitial, unpracticed readings from another chapter?What effect will reaching fluency on a passage haveon students' ability to retell what they read in thatpassage?MaterialsStudy readings came from the science textbook FromBacteria to Plants (Padilla, Miaoulis, & Cyr, 2007) and basedon Fry readability procedures (Fry, 1989) had a seventh gradereadability score. The experimenter chose two separate chapters, chapter one, Living Things, and chapter four, Introduction of Plants, and typed approximately the first 2,400 wordsof each chapter verbatim. Transcribed text included only themain body of the text, including headings and subheadingswith any bolded or italicized print removed. Typed copiesTable 1Student Demographic and Group Assignment DataStudentAgeGenderEthnicityGradeSpecial NeedClassificationAssessment Score(CWPM/IWPM)Assigned 21313FFA7777778SLDSLD and 6AAAABBBMMMMFccccccNote. F Female; M Male; A African American; C Caucasian; SLD Specific learning disability; SED Seriousemotional disturbance; ADD Attention deficit disorder; CWPM Correct Words per Minute; IWPM Incorrect Words perMinute;*Group A received chapter one readings and Group B received chapter four readings.Learning Disabilities91Vqlume 17, Number 3
Building Science Reading Fluency with RRFCdid not include any other text (e.g., pronunciations, text fromfigures, figure captions, reviews, study guides).Once copied verbatim, the experimenter divided eachchapter into 12 smaller passages containing a minimum 200words (range 200-215) with each finishing at the conclusionof a sentence. Passage 1 for both chapters comprised the first200 words; passage 2 the second 200 words, and so on untilreaching passage 12. Three additional passages from chapterone required for an extended baseline for one student raisedthe total to 27 passages.The experimenter conducted two forms of analysis oneach group of passages: passage readability and word overlap. The experimenter used the Microsoft Word tool featureto determine Flesch-Kincaid readability and Flesch readingease scores (c.f. Flesch, n.d.) for each of the 27 passages.Chapter one passages had an average grade level readability of 9.6 (range, 6.9-11.6) and a reading ease of 49.2 (range,35.4-64.0). Chapter four passages had an average grade levelreadability of 8.4 (range, 7.0-10.6) and a reading ease scoreof 57.1 (range, 43.1-69.2). The second analysis determinedword overlap between passages for each chapter. The experimenter calculated number of identical words and numberof times those words overlapped for each pair of passages.Chapter one had an average word overlap between passagesof27.74% (range, 19%-46%) and chapter four had an averageword overlap of 28.19% (range, 21 %-45%).Additional materials included copies of each passage forthe experimenter and participants, a countdown timer, No. 2pencils, and a video recorder (i.e., JVC Everio hard disk camcorder), tripod, and age-appropriate participation prizes (e.g.,pencils, pens, folders, erasers). Passage copies for the experimenter had a running total of words at the end of each row anda table to score oral retells. Passage copies for participantshad no word count or numbered table.Dependent VariablesThe measurement of three dependent variables showedthe effects of the intervention. Correct words per minute, thefirst dependent variable included words pronounced correctlywithin three seconds in their proper place in the text (Shinn,1989). Self-corrections also counted as correct. Incorrectwords per minute, the second dependent variable, includedomissions, substitutions, mispronunciations, and words notread within three seconds (Shinn, 1989). Inserting words intotext also counted as incorrect. If participants skipped entirelines of text, those words did not count as correct or incorrect.Calculation of corrects involved subtracting incorrects fromtotal words read in one-minute with any insertion errors addedto the incorrect total only.The third dependent variable, oral retell fluency, consisted of the number of words correctly recalled relating to aparticular reading in one minute assessment period. Each ofthe words had to refer back to the original reading. The exLearning Disabilitiesperimenter based oral retell scoring procedures on those foundin the Dynamic Indicators of Basic Early Literacy Skills (6th ed.) (c.f. Good & Kaminski, 2007). The experimenteradministered an oral retell test immediately following eachinitial, unpracticed reading of a repeated reading passage, anddirectly after each student reached the fluency criteria for thepassage. The experimenter transcribed each retell verbatimfrom video recordings and then scored the retell per scoringprocedures.Independent VariableRepeated Readings to a Fluency Criterion ConditionIn the repeated readings to a fluency criterion (RRFC)condition, the student read one of the RRFC passages for oneminute, three times each session. The experimenter providedthe student with an unmarked copy of the passage and toldthe student that they would read the passage three times forone minute each as fast as possible and to return to the startof the passage if reaching the end. Timed for 60 seconds, thestudent started reading from the first word of the passage. Asthe student read the experimenter maintained a count of anyincorrects on the experimenter's copy of the passage. After60 seconds the timer beeped and the experimenter promptedthe student to stop reading and provided the student feedbackin the form of number of correct and incorrect words. Errorcorrection consisted of a model-lead-test procedure for all incorrects (Carnine et al., 2004). Every word mispronounced,omitted, substituted, skipped, or hesitated on for more thanthree seconds received error correction. The student had topronounce each word properly after hearing a model. To correct insertions, students listened to the pronunciation of thewords occurring just before and after the inserted word. Afterhearing these words, the student had to pronounce both wordsproperly.Experimental DesignTo show repeated readings to a fluency criterion effectson science textbook passages, the experimenter used two multiple-probe multiple baselines across students, one for eachof the two groups of students (Horner & Baer, 1978; Kennedy, 2005). The design and the Standard Celeration Charts(Graf & Lindsley, 2002; Pennypacker, Gutierrez, & Lindsley,2003), allow the comparison of celerations of initial, unpracticed readings for each student from baseline to interventionand a comparison of celerations of RRFC passages for eachstudent (c.f., Pennypacker et al., for a discussion of celeration). As some students remained in baseline for an extendedperiod, multiple probes of readings, rather than daily readings,minimized reading practice effects while still showing readingscore celerations.92Volume 17, Number 3
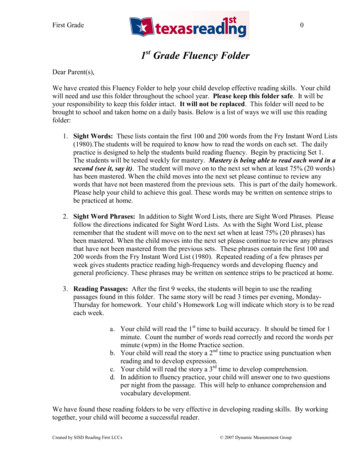
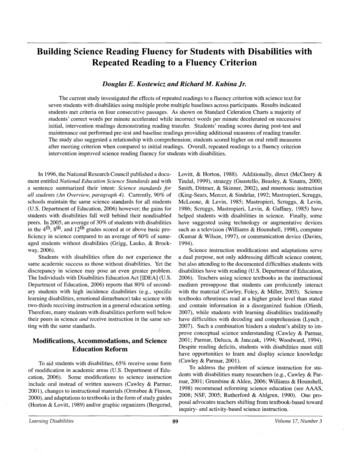
Kostewicz and KubinaProceduresAssessment/Pretest ReadingTo start the study, all students individually read one passage taken from chapter three for one minute. The passageconsisted of 221 words, 9.4 readability, 56.4 reading easescore, and an average word overlap of 27.95% with chapterone passages and 28.01 % with chapter four readings. All seven students met inclusion criteria by reading between 50 and150 correct words per minute placing them within an instructional reading range (Kubina & Starlin, 2003). The experimenter assigned students to group A or B based on approximate matching of assessment/pretest scores. Table 1 displaysassessment/pretest scores and group assignment.General ProceduresFigure 1 presents a flow chart that follows the proceduresfor one group of students although both groups A and B followed identical procedures. Students read three baseline passages each for one minute with feedback only (A). A studentdisplaying a stable or decelerating trend entered interventionwith the first RRFC passage (B 1). The other students receivedone baseline reading probe three sessions later (B2). If nostudent displayed a stable or decelerating baseline, remainingstudents continued to read one baseline passage per session(B3). The baseline probe or reading process continued untilall students started the intervention.When starting the intervention (or any initial readings ofa RRFC passage) each student read one minute with feedbackand completed an oral retell pre-test (C). During successivesessions, students followed the aforementioned RRFC procedures of three one-minute readings of the passage each followed by error correction and feedback (D). A test readingfor one-minute with feedback only followed the third re-read(E). Students meeting criterion (200 CWPM with 2 or fewerIWPM) immediately took part in an oral retell post-test (Fa)and advanced one RRFC passage during the next session (i.e.,following day) (Fb). Students not meeting criterion read thesame passage during the next session (i.e., following day) threemore times for one-minute with error correction and feedbackfollowed by another test reading (D). Each student followedall steps until meeting criterion on the four pre-determinedRRFC passages (G).Students followed the same procedures during the finalsix sessions (i.e., days): one one-minute reading with feedbackonly. The experimenter first presented one more unpracticedreading from the assigned chapter (H). During the next session, all students regardless of group read a post-test (I). Asa measure of transfer, students read the four RRFC passages,one per session (J), from the other group (i.e., Group A read.Group B RRFC passages and vice versa). Once completingthe final transfer reading, students completed the study.LearningDisabilitiesAccuracy, Inter-observer Agreement, and Procedural IntegrityBecause each session had a paired video recording (i.e.,permanent product), the experimenter examined each videoto determine accuracy, or the extent to which observed valuesapproximate the true state of nature (Johntson & Pennypacker, 2009, p. 363) of each student's reading. The experimenterused the accuracy scores on each student's test reading scoreand equaled 100% for CWPM and IWPM.Two trained data collectors implemented the proceduresduring one session and completed inter-observer agreementon oral retells and procedural integrity. To verify oral retellscores, a trained data collector verified 20% of the oral retelltest transcriptions from video. She then scored those particular retell transcripts. To calculate retell scoring agreement,the experimenter used a total agreement approach (Kennedy,2005). To calculate total agreement per observation, the experimenter divided the larger number of correct words by theFigure 193The current figure illustrates the general procedures ina flow chart format. Both groups followed identical procedures throughout the study. Note. CWPMCorrectwords per minute, RRFC Repeated reading to a fluencycriterion, IWPM Incorrect words per minute. (A) Three baseline readings with feedback(82) Remainingstudent(s)remain in baseline1 baseline probe{81} One student with a stable ordecelerating baseline forCWPM enters intervention on(93} Student(s) receive anotherbaseline reading next sessionRRFCpassage 1(C}Initial RRFCreading (with feedbackonly) and oral retell pre-test on passage(D)Nextsession, successiverepeated reading practice(3 rereads with error correction and feedback)(Fb} Advance one reading(if completing RRFCpassage 1, then move toRRFC2. If completingRRFC2, then advance toRRFC3,etc.)(E) Test reading(1 read with feedback)Did the student reach criterion on the test reading?(200 or more CWPM and 2 or less 1WPM)(Fa) The same session,oral retell post-testThe remaining sessions (one reading per session), in order:(H) Additional, initial unpracticed reading(I) Post-test reading(J) Maintenance/transfer readings(4 RRFCReadings from the other chapter)Volume 17, Number 3
Building Science Reading Fluency with RRFCsmaller amount of correct words. Average total agreementfor oral retells equaled 90%. The same data collector, whocalculated oral retell agreement, performed procedural integrity on 20% of the sessions. To calculate procedural integrity,the observer reviewed each identified session and completedexperimenter-created checklists verifying the specific steps ofthe procedure. Percent of steps completed correctly totaled99%.Social ValidityTo measure social validity, the experimenter used threedistinct measures. First, students and teachers completed aquestionnaire at the conclusion of the study targeting theirinvolvement in the study. While taped, students verbally responded to three questions: 1) Did you enjoy participating inthis study? Why or why not, 2) Do you feel this procedurehelped you with your science text? and 3) Do you feel youunderstood what you read better? The teacher responded withwritten answers to four questions: 1) Did you feel that yourstudents benefited from their participation? 2) Did you noticeanything different about your students as a group as they progressed through the study? If yes, could you elaborate briefly? 3) Did you notice anything notable about any particularstudent(s)? 4) If possible, would you try this procedure withstudents? Second, the students also anonymously completed10 questions on a 5-point Likert scale after returning to theclassroom to minimize any observer effects. The classroomteacher answered any questions students had with regards tothe questionnaire.ResultsGroup and Individual Pre- and Post-test Reading ScoresTable 2 displays the pre- and post-test scores for all students. Students participated in a pre-test/assessment readingduring the first session and a post-test reading after the extra reading session. Students' mean correct words per minute (CWPM) increased from 85.7 to 93.8 and mean incorrectwords per minute (IWPM) decreased from 10.1 to 6.8. Studentreading accuracy improved from 90.0% to 93.2% on average.Six of seven students improved CWPM and all students madethe same or fewer IWPM. Six students improved with onemaintaining reading accuracy. Group A students improvedreading accuracy more than Group B from pre- to post-test,while Group B had a higher mean accuracy score.Group and Individual Reading ScoresFigures 2 and 3 illustrate reading scores for students reading chapter one (Group A) and chapter four passages (GroupB) in a multiple baseline format. All of the data appear onStandard Celeration Charts (SCC). The SCCs show proportional behavior change, normalize variability, display learningas a straight line, accurately depict outliers, place behavior inLearning Disabilitiesreal time, and allow the calculation of celeration, a quantitative measure of learning (Graf & Lindsley, 2002; Kubina &Lin, 2010; Lindsley, 2005; McGreevy, 1983; Pennypacker, etal., 2003).On all of the SCCs dots represent CWPM and X's represent IWPM. Both figures have logarithmically scaled verticalaxes and equal interval scaled horizontal axes which correspond to calendar days. The dotted vertical line signifies thestart of intervention and solid vertical lines show each phasechange (e.g., new passages during intervention). The abbreviations refer to baseline, repeated reading 1-4 (RR1-RR4), theextra reading (*), and maintenance/transfer readings (M/T).Dotted horizontal lines at 200 and 2 each signify the criterion reading levels for CWPM and IWPM. When displayed,celeration lines lie on specific data path and can reveal accelerating (x or multiply sign) or decelerating (7 or dividesign) behavior. Celerations or the frequency of responding fora particular time unit divided by unit time (Kennedy, 2005,p. 90) provide a quantification of the change in behavior frequency. For example, a behavior that has a x2.00 celerationmeans that the behavior has doubled in a week.Standard Celeration Charts and the subsequent displayof the data via celerations provide advantages teachers andresearchers may wish to consider. For instance, celerationsshow the change in the celeration or rate of behaviors overtime and not simply absolute change from session to session(Johnson & Pennypacker, 2009). Additionally, a SCC can display multiple behaviors (e.g., CWPM and IWPM) on the samegraph to allow rate of change comparisons via multiple celerations. An important discovery of Standard Celeration Chartedbehavior established the independence of behavior (Lindsley,2005). Namely, celeration changes in CWPM, for example,do not guarantee celeration changes in IWPM. Students withaccelerating CWPM may have concomitant IWPM accelerations or vice versa. Celerations accurately reflect reading performance over time and also capture important, fi
Repeated Reading to a Fluency Criterion . for students reading science passages improved from 33 (SD 35) to 66 (SD 32) words per minute, the largest average increase of the three groups. Given the importance of-oral reading fluency for content . readings, but all had