Transcription
The Financial Illiteracy and Overconfidence of Margin TradersK. JEREMY KO, STEVEN RAPKIN 1 2March 2018SUMMARY We use survey data from 2015 to examine the financial literacy and other characteristics of USinvestors with non-retirement investment accounts (both advised and self-directed) – focusingon investors who have margin approval from their brokerages or margin-trading experience (i.e.,investors who have ever purchased securities on margin). We find that, on average, investorswho trade using margin have lower financial literacy and understand margin trading less wellthan those who do not trade using margin (either because they do not have margin approval orbecause they choose not to borrow in margin-approved accounts). Notably, only 15% of margintraders could answer a basic question about margin correctly, compared to 31% of non-margintraders.Further analysis reveals that, on average, investors with margin-trading experience and approvalhave higher risk tolerance and confidence in their investment knowledge than those without.Overconfidence in investment knowledge appears to be a key element in explaining why lowerliteracy traders gravitate toward margin.Our findings also suggest the need for additional research to study whether these findingsgeneralize to other leveraged instruments or strategies.1The U.S. Securities and Exchange Commission, as a matter of policy, disclaims responsibility for any privatepublication or statement of any of its employees. The views expressed herein are those of the author and do notnecessarily reflect the views of the Commission or of the author’s colleagues upon the staff of the Commission.The authors prepared this white paper as a part of the Division of Economic and Risk Analysis (DERA) White Paperseries.2We thank John Cook, John Fahey, Jeffrey Harris, Austin Gerig, Andrew Glickman, Lourdes Gonzales, and JonathanReuter for invaluable comments on this project as well as seminar participants at the U.S. Securities and ExchangeCommission.1
I.BackgroundThere is ongoing discussion about whether and when retail investors would benefit from increasedor decreased access to risky trading strategies and instruments. One concern is that retail investors maynot fully understand the risks to which they are being exposed as a result of low financial literacy,inadequate disclosure, complexity, or some combination thereof.This white paper uses survey data of US investors with non-retirement investment accountscollected by the FINRA Investor Education Foundation in 2015 to compare the financial literacy andother characteristics of investors who have engaged in a specific leveraged trading activity – margintrading – with those of investors who have not so engaged. 3 Our research question is whether or notmargin traders possess both a greater understanding of the risks inherent in trading on margin andgreater levels of financial literacy than other investors. The answer to this question can help to informthe debate as to whether these investors might benefit from additional protections and/or education.SEC Rule 10b-16 under the Securities Exchange Act of 1934 (Disclosure of Credit Terms in MarginTransactions) and FINRA Rule 2264 (Margin Disclosure Statement) mandate specified disclosures thatbroker-dealers must make to investors who open retail margin accounts. Required disclosures includethe credit terms in margin transactions as well as disclosures regarding the risks of trading securities onmargin. Exchange Act Rule 10b-16 is designed to parallel the scope of the Truth in Lending Act. FINRARule 4210 (Margin Requirements) describes the margin requirements that determine the amount ofcollateral customers are expected to maintain in their margin accounts. Broker-dealers that recommendmargin accounts are required to comply with specified minimum professional conduct obligations. Inparticular, a broker-dealer’s recommendation to purchase securities on margin would be considered aninvestment strategy and subject to a broker-dealer’s obligation to only make suitable recommendationspursuant to FINRA Rule 2111 (Suitability). 4 Regulations which govern retail trading in another riskyinstrument with embedded leverage – options – also require the broker to collect specific customerinformation and either approve or disapprove access to options. 5II.Related LiteratureIn studies related to ours, Heimer and Simsek (2017) and Heimer and Imas (2017) find that higherleverage is associated with losses for retail investors in the foreign exchange market. There is a largeliterature documenting a positive correlation between the level of financial literacy and the level offinancial risk-taking. Hsiao and Tsai (2017) find that Taiwanese investors with higher financial literacywere more likely to have participated in derivatives markets. In contrast, we find that US investors whoengage in certain leveraged trading strategies (i.e., margin) have lower literacy, on average, than thosewho do not. Cultural and institutional factors may account for the differences in findings between theHsaio and Tsai (2017) study and ours. Yoong (2011) uses survey data from RAND’s American Life Panel3The FINRA Investor Education Foundation data are available s.php.4See FINRA Rule 2111 (Suitability) FAQs Q4: suitability-faq.5See FINRA Rule 2360: http://finra.complinet.com/en/display/display main.html?rbid 2403&element id 6306.2
to document that US households with greater financial literacy are more likely in participate in the USstock market. Rooij, Lusardi, and Alessie (2011) document a similar pattern in Dutch survey data. Cox,Brounen, and Neuteboom (2015) also use Dutch survey data to document that households with greaterfinancial literacy are more likely to choose riskier alternative mortgage products. Using the same Dutchdata, von Gaudecker (2015) finds that lower financial literacy is associated with under-diversification ofhousehold portfolios. However, knowledge of specific financial concepts (such as stocks and mutualfunds) exhibits no statistical relation with under-diversification. Clark, Lusardi, and Mitchell (2015) findthat greater financial literacy on the part of the investor is associated with: 1) higher allocation of theinvestor’s portfolio to stocks, 2) higher portfolio expected return and volatility, and 3) lower portfolioidiosyncratic volatility within a specific employer’s defined benefit retirement plan. Hilgert, Hogarth,and Beverly (2003) show that consumers with higher investment knowledge are more likely to engage inbeneficial behaviors such as diversification and owning stocks, mutual funds, or investment accounts.Bateman, et al. (2014) show that experimental subjects with lower financial literacy are less likely tochange investment choices in response to changes in risk disclosed in various formats.There are also numerous studies exploring the relation between educational attainment or cognitiveability and likelihood of stock-market participation. Haliassos and Bertaut (1995), Calvet, Campbell, andSodini (2007, 2009a, 2009b), and Calvet and Sodini (2014) find that higher educational attainment isassociated with increased stock market participation, while Christelis, Japelli, and Padula (2010) find thathigher grade-school math scores are associated with higher levels of stock market investment.Grinblatt, Keloharju, and Linnainmaa (2011) also find that higher IQ is associated with greater likelihoodof stock-market participation as well as with investment portfolios exhibiting greater diversification,lower risk and higher Sharpe ratios. Jorring (2017) shows that consumers who make fewer financialmistakes (as captured by paying avoidable credit card fees) have higher assets including those ininvestment accounts.FINRA (2016) also uses survey data collected by the FINRA Investor Education Foundation in 2015 toprovide descriptive information on US investors. The survey asks questions related to investordemographics, general financial knowledge and attitudes, and behavior related to topics such asportfolio allocation, financial advice, disclosures, and fees. FINRA (2016) finds that roughly a third of USinvestors have margin-approved accounts, while roughly half of approved investors have traded usingmargin. They also find that margin accounts are most prevalent among younger investors, aged 18 to34. We use these same data to shed additional light on the types of investors who are most likely totrade on margin. To our knowledge, our study is the first to study the relationship between margintrading and financial literacy.III.Data and AnalysisWe analyze data from a 2015 FINRA Investor Education Foundation survey of 2,000 representativeUS investors with investments in non-retirement accounts. The survey includes information on investordemographics, beliefs and attitudes toward financial markets and intermediaries, trading activities andasset ownership, and types of investment accounts including margin accounts and various advised3
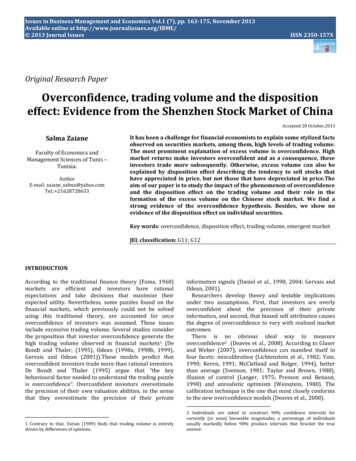
accounts. The survey also includes a 10-question quiz covering basic investment concepts such as thegeneral properties of stocks and bonds. 6 Of particular interest to us is the question intended to measurean investor’s understanding of margin trading. It reads:“You invest 500 to buy 1,000 worth of stock on margin. The value of the stock drops by 50%. Yousell it. Approximately how much of your original 500 investment are you left with in the end?”The survey offers five possible answers to this question (with (3) being the correct answer): (1) 500, (2) 250, (3) 0, (4) Don’t know, and (5) Prefer not to say. We seek to understand to what degree investorswith margin-trading experience and approval understand margin. We also seek to assess whethermargin investors have higher or lower financial literacy than non-margin investors.The average respondent was only able to answer 4.4 of the 10 quiz questions correctly, resulting inan average score of 44%. 7 Understanding of margin was even lower, with only 23% answering themargin question correctly. 8 In Figure 1, we ask how the ability to answer the quiz questions varies withmargin experience and approval. In the top panel, we find evidence that margin traders appear tounderstand margin less well than non-margin traders. In particular, only 15% of margin tradersanswered the margin question correctly, compared to 31% of non-margin traders. This difference isdriven by incorrect answers and not by omitted answers on the part of margin traders. Only 4.3% ofmargin traders responded either “do not know” or “prefer not to answer” while 18.3% of non-margintraders provided either of these responses. Therefore, 81% of margin traders gave an incorrectresponse of either (1) or (2) to this question, while only 49% of non-margin traders provided one ofthese incorrect responses.Margin traders also exhibit lower levels of overall investor literacy. On average, margin tradersanswered 41% of the 10 questions correctly, compared to 50% for non-margin traders. Both differences(total score and response to the margin question) between margin and non-margin traders arestatistically significant at the 1% level.The bottom panel of Figure 1 focuses on margin approval instead of margin experience. Differencesin literacy between margin-approved and non-margin approved investors are not as dramatic as theyare between margin users and non-users of margin. For example, margin-approved investors answered46% of the 10 questions correctly, on average, while non-margin approved investors answered 49%correctly. This difference is still significant at the 5% level, however. In addition, 26% of marginapproved investors could answer the margin question correctly versus 28% of non-margin-approvedinvestors. This difference is not statistically significant at the 10% level.6The FINRA Investor Education Investor Survey can be found here: php.7Responses of “do not know” and “prefer not to say” for literacy quiz questions were scored as incorrect in accordwith other survey-based studies of financial literacy.8Throughout our analysis, we use averages with weighted observation to account for statistical over- or underrepresentation in the sample. The two exceptions are the probit regression and correlation analyses in tables 1-3.4
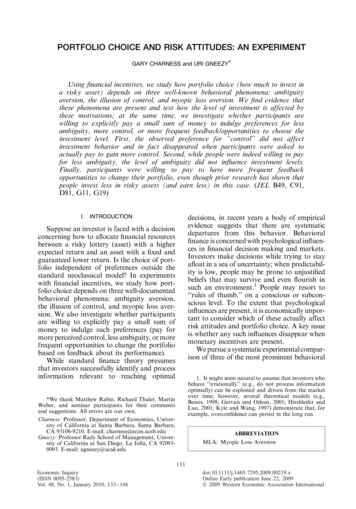
These patterns imply that the most interesting variation is related to the choice to utilize marginrather than the choice to obtain margin approval. This finding is not surprising given that marginapproval is not necessarily an affirmative choice by investors. Some brokerage accounts feature marginapproval as the default option or the only option. Therefore, investor choice plays a weaker role inmargin approval than in margin trading. However, margin approval often requires a proactive requestby the investor and/or certain credit-related screening by the brokerage firm. For this reason, weanalyze which variables are associated with margin approval to determine which ones are related toinvestors’ propensity to request margin approval or brokerages’ propensity to grant such approval.We next compare the confidence and risk-aversion of margin traders and non-margin traders. Ourprediction is that margin traders will exhibit both higher levels of confidence and lower levels of riskaversion. The survey includes two questions that allow us to measure confidence in one’s ability andknowledge as an investor:1) “Over the next 12 months, how well do you expect your portfolio of investments to perform?(1) Worse than the market, (2) About the same as the market, (3) Better than the market”2) “On a scale from 1 to 7, where 1 means very low and 7 means very high, how would you assessyour overall knowledge about investing?”These questions also offered “do not know” and “prefer not to say” as possible responses. We createtwo measures of confidence based on these questions. We define Confidence1 to be the percentiledegree of outperformance expressed in question 1, measured across all respondents. This measure hasa mean of 0.23 and a standard deviation of 0.31. We define Confidence2 to be the percentile selfassessed knowledge in question 2 minus the percentile score on the 10-question quiz, which has a meanof 0.00 and a standard deviation of 0.37. 9 Barber and Odean (2000) find empirical evidence consistentwith systematic overconfidence on the part of retail discount-brokerage clients. 10 Therefore, it is likelythat our measures capture overconfidence on the part of retail investors. However, we cannotdefinitively say that the particular value of either confidence measure is excessive relative to a rationalbenchmark. We subsequently discuss alternative evidence consistent with overconfidence by margintraders. Regardless of which measure we use, Figure 2 reveals that investors with margin-tradingexperience and approval have higher levels of confidence than those without. Both differences(Confidence1 and Confidence2) between margin and non-margin traders are statistically significant atthe 1% level.The survey also includes two questions intended to measure an investor’s level of risk-aversion:1) “Which of the following statements comes closest to describing the amount of financial riskthat you are willing to take when you save or make investments? (1) Take substantial financial9Any participants who responded “do not know” and “prefer not to say” were given a missing value for all of ourvariables except for our investor literacy variables for which these responses were scored as incorrect.10Barber and Odean (2000) find that retail investors trade excessively, thereby incurring costs andunderperforming the market. They conclude that these investors are overconfident in that they overestimate theirability to earn extraordinary returns from their trading.5
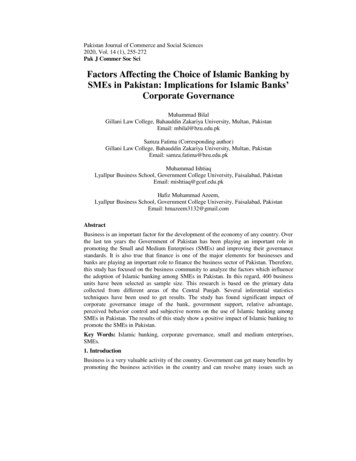
risks, (2) Take above average financial risks, (3) Take average financial risks, (4) Not willing totake any financial risks”1) “How much of your non-retirement portfolio is invested in stocks or mutual funds that containstocks? (1) More than half, (2) Less than half, (3) None”Again, these questions also offered “do not know” and “prefer not to say” as possible responses. Ourtwo measures of risk-aversion, Risk Avers1 and Risk Avers2, reflect the degree of risk-aversionindicated by responses to these two questions in percentile terms across subjects. As predicted, Figure3 reveals that risk-aversion is lower among both margin traders and margin-approved investors thanamong other investors. Both differences (Risk Avers1 and Risk Avers2) between margin and nonmargin traders are statistically significant at the 1% level.We next turn to multivariate regression analyses to shed light on which of these factors is related tomargin trading and margin approval, controlling for other factors. We provide a series of probitregressions. 11 In Table 1, the dependent variable equals one if the investor is a margin trader; in Table 2,the dependent variable equals one if the investor is margin-approved. The set of independent variablesincludes dummy variables to capture gender, age, ethnicity, family structure, educational attainment,income level, and portfolio value; the measures of financial literacy, risk aversion, and confidenceintroduced above; and measures of optimism and trust. The measures of optimism and trust aredefined in the appendix to this paper. These findings show that the following variables reliably increasethe propensity to have margin approval and engage in margin trading across regressions (at the 5%significance level): being under 55, having children, risk-tolerance (the inverse of either Risk Avers1 orRisk Avers2), investor literacy quiz score, and confidence as measured by self-assessed investmentknowledge minus actual knowledge (Confidence2). 12Therefore, higher investor literacy appears to increase the propensity to possess margin approval orengage in margin trading when controlling for other factors. Further analysis indicates thatoverconfidence about investment knowledge (as measured by Confidence2) by margin traders may be acritical factor in explaining low literacy among margin traders on average. First, an investor’s score onthe literacy quiz is negatively related to Confidence2. Table 3 shows the correlation matrix for overalland margin quiz scores and the five significant variables across regressions mentioned above (being 55or older, having children, Risk Avers1, Risk Avers2, and Confidence2). The correlation between overallquiz score and Confidence2 has the highest magnitude estimated coefficient of -0.64. This relation is notsurprising since the two are related mechanically, i.e., Confidence2 is computed by subtracting the quizscore in percentile terms from self-assessed investment knowledge. 13 Margin traders also appear to11Our findings are robust to alternative regression models such as OLS with heteroscedasticity-consistent standarderrors. These results are available upon request.12The effects of age and portfolio value on margin trading and approval are not surprising if these variables arepositively and negatively related to risk-aversion, respectively. However, the effect of having children is a novelfinding which may deserve further examination in future research.13In addition, the (unreported) regression coefficient for quiz score becomes negative and significant (at the 10%level) if Confidence2 is removed from the probit regression with margin trading as the dependent variable.Therefore, Confidence2 can account for the negative unconditional relationship between margin trading andliteracy.6
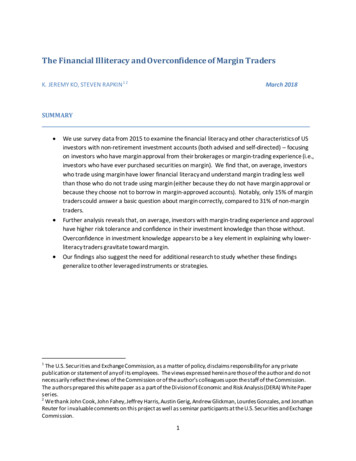
have more confidence in their understanding of margin than non-margin traders since only 3.8% ofmargin traders answered “I don’t know” to the margin literacy question, whereas 17.8% of non-margintraders gave this response. 14 However, this pattern of responses indicates excessive confidence on thepart of margin traders (relative to non-margin traders) since fewer margin traders answered thisquestion correctly.These findings naturally raise the question of whether they apply to other instruments andactivities – particularly those with embedded leverage or other types of risk. The FINRA InvestorEducation Foundation survey contains some information on ownership of the following asset types:individual stocks, individual bonds, mutual funds, ETFs, annuities (fixed, indexed, or variable), whole lifeinsurance, commodities or futures, and other (e.g., REITs, options, private placements, and structurednotes). Figure 4 shows how the average literacy-quiz score differs between owners and non-owners ofeach these asset types. These findings suggest that literacy may be lower for ownership of commoditiesand futures. 15 However, this finding is not statistically significant.IV.ConclusionOur analysis has uncovered a marked lack of financial literacy and understanding of margin by retailmargin traders. It also suggests that overconfidence in financial knowledge is a key factor in driving lowliteracy investors to pursue higher-risk leveraged trading strategies. Additional research is needed todetermine whether investors in other leveraged instruments and strategies exhibit different literacy andunderstanding of the associated risks as compared to investors who don’t engage in these risks.14As mentioned previously, the percent of margin traders who answered both “I don’t know” and “I prefer not toanswer” is 4.3% versus 18.3% for non-margin traders.15Figure 3 indicates that investor literacy is significantly lower for owners of insurance-related investmentproducts (i.e., whole life insurance and annuities).7
V.AppendixWe measure optimism using the percentile across respondents of the sum of the responses to thefollowing two questions:1) “How confident are you that U.S financial markets offer good long-term opportunities forinvestors?” (responses on 1-10 scale)2) “What do you expect the approximate average annual return of the S&P 500 stock index to beover the next 10 years (without adjusting for inflation)? (responses on 1-6 scale ranging from 0% return to 20% return).We include three measures of trust in our regression analyses.Trust1 captures the degree of perceived fairness in financial markets and is measured by theresponse to the following question, as a percentile across respondents:“How confident are you that U.S financial markets - Are fair to all investors?” (responses on 1-10scale)Trust2 captures the degree of concern about financial fraud and is measured by the response to thefollowing question, as a percentile across respondents:“How strongly do you agree or disagree with the following statement? – I am worried about beingvictimized by investment fraud?” (responses on a 1-7 scale, transformed so that 1 represents themost worry)Trust3 captures the degree of confidence in regulators and is measured by the sum of the responsesto the following three questions, as a percentile across respondents:1) “How confident are you that - U.S. financial markets are effectively regulated to protectinvestors from fraud and abusive sales practices?” (responses on 1-10 scale)2) “How confident are you that - U.S. financial regulators are able to keep up with new marketdevelopments, investment vehicles and investment technologies?” (responses on 1-10 scale)3) “How confident are you that - The regulators of U.S. financial markets are looking out forordinary investors?” (responses on 1-10 scale)Our measures treat “do not know” and “prefer not to say” responses as missing observations.8
VI.ReferencesBarber, Brad M. and Terrance Odean. 2000. Trading is Hazardous to Your Wealth: The Common StockInvestment Performance of Individual Investors. The Journal of Finance 55(2): 773-806.Barnett, Renee. 2000. Online Trading and the National Association of Securities Dealers' Suitability Rule:Are Online Investors Adequately Protected? American University Law Review: 49(5), Article 4.Bateman, Hazel, C. Eckert, J. Geweke, J. Louviere, S. Satchell and Susan Thorpe, 2014, FinancialCompetence, Risk Presentation, and Retirement Portfolio Preferences, Journal of Pension Economics andFinance, Vol. 13, 27-61.Calvet, Laurent, John Campbell, and Paolo Sodini. 2007. Down or Out: Assessing the WelfareCosts of Household Investment Mistakes. Journal of Political Economy 115: 707-747Calvet, Laurent, John Campbell, and Paolo Sodini. 2009a. Fight or Flight? Portfolio Rebalancingby Individual Investors. Quarterly Journal of Economics 301-348.Calvet, Laurent E., John Campbell, and Paolo Sodini. 2009b. Measuring the FinancialSophistication of Households. American Economic Review, Papers & Proceedings. 99:2,393–398Calvet, Laurent E. and Paolo Sodini. 2014. Twin Picks: Disentangling the Determinants of RiskTaking in Household Portfolios. Journal of Finance. 69(2): 897-906.Christelis, Dimitris, Tullio Jappelli, and Mario Padula. 2010. Cognitive Abilities and PortfolioChoice. European Economic Review 54(1): 18–38.Clark, Robert, Annamaria Lusardi, and Olivia S. Mitchell. 2015. Financial Knowledge and 401(k)Investment Performance: A Case Study. GFLEC Working Paper 2015-3.Cox, Ruben, Dirk Brounen, and Peter Neuteboom. 2015. Financial Literacy, Risk Aversion, and Choice ofMortgage Type by Households. The Journal of Real Estate Finance and Economics 50(1): 74-112.FINRA Investor Education Foundation. 2016. Investors in the United States 2016. FINRA InvestorEducation Foundation Report.Grinblatt, Mark, Matti Keloharju, and Juhani Linnainmaa. 2011. IQ and Stock Market Participation.The Journal of Finance 66(6): 2121-2164.Haliassos, Michael and Carol Bertaut. 1995. Why Do So Few Hold Stocks? The EconomicJournal 105, 1110-1129Heimer, Rawley Z. and Alp Simsek. 2017. Should Retail Investors’ Leverage Be Limited? Journal ofFinancial Economics Forthcoming.Heimer, Rawley Z. and Alex Imas. 2017. Doing Less with More. Working Paper.9
Hsiao, Yu-Jen and Wei-Che Tsai. 2017. Financial Literacy and Participation in the Derivatives Markets.Journal of Banking and Finance Forthcoming.Hilgert, Marianne A., Jeanne M. Hogarth, and Sondra G. Beverly. 2003. Household FinancialManagement: The Connection Between Knowledge and Behavior. Federal Reserve Bulletin (July): 309322.Jorring, Adam T. 2017. The Costs of Financial Mistakes: Evidence from U.S. Consumers. University ofChicago Working Paper.Rooij, Maarten van, Annamaria Lusardi, and Rob Alessie. 2011. Financial Literacy and Stock MarketParticipation. Journal of Financial Economics 101: 449-472.Yoong, Joanne. 2011. Financial Illiteracy and Stock Market Participation: Evidence from the RANDAmerican Life Panel. In Financial Literacy: Implications for Retirement Security and the FinancialMarketplace. Eds O. S. Mitchell and A. Lusardi. Oxford: Oxford University Press: 76-97.10
Figure 1: Investor Literacy by Margin Trading and ApprovalThe bar charts below show weighted averages for the following two variables: Inv Lit Total refers to theaverage fraction of the 10 total quiz questions answered correctly, while Inv Lit Margin refers to thefraction of respondents who answered the margin question correctly.11
Figure 2: Confidence by Margin Trading and ApprovalThe bar charts below show weighted averages for the following two variables: Confidence1 is thepercentile degree of outperformance predicted for one’s portfolio across respondents, whileConfidence2 is the percentile of one’s self-assessed investment knowledge minus the percentile score onthe quiz.12
Figure 3: Risk Aversion by Margin Trading and ApprovalThe bar charts below show weighted averages for the following two variables: Risk Avers1 is theinvestor’s stated unwillingness to take risks in percentile terms across respondents, while Risk Avers2 isthe investor’s approximate avoidance of stocks in her non-retirement portfolio in percentile terms.13
Figure 4: Investor Literacy by Ownership Across Types of AssetsThe bar chart below shows weighted averages for Inv Lit Total , which is the fraction of the 10 quizquestions answered correctly. The “Other” category below includes REITS, options, private placements,and structured notes.14
Table 1: Margin Trading and Investor CharacteristicsThe table reports the coefficient estimates and p-values from probit regressions of indicators for margintrading versus the following investor characteristics: indicator variables for being female; being a collegegraduate; non-white ethnicity; being married; being aged 35-54 years; being aged 55 years or older;having children; household income of 50-100K; income of 100K or greater; portfolio value of 50200K; portfolio value of 200K or greater; residing in the Midwest, South, and West regions;Inv Lit Total (the fraction of the 10 total quiz questions answered correctly); Inv Lit Margin (anindicator for answering the quiz question on margin correctly); Risk Avers1 (the stated unwillingness totake risks as a percentile); Risk Avers2 (allocation to non-equity securities as a percentile); Trust1 (theinvestor’s trust in financial markets and institutions as a percentile); Trust2 (the lack of worry aboutfraud as a percentile); Trust3 (confidence in regulators as a percentile); Confidence1 (degree ofoutperformance predicted for the investor’s portfolio as a percentile); Confidence2 (self-assessedinvestment knowledge as a percentile minus quiz score as a percentile. (***), (**), and (*) indicatestatistical significance at the 0.01, 0.05 and 0.10 levels, respectively.FemaleAge: 35-54Age: 55 and upIncome: 50- 100KIncome: 100KCollege GradNon-whiteMarriedChildrenMidwest RegionSouth RegionWest RegionPortfolio Value: 50- 200KPortfolio Value: 200KInv Lit TotalInv Lit MarginRisk Avers1Risk nce2(Intercept)Number of ObservationsEstimate p-valueEstimate p-value0.007-0.286**-0.462***-0.218-0.2950.24
(total score and response to the margin question) between margin and non- margin traders are statistically significant at the 1% level. The bottom panel of Figure 1 focuses on margin approval instead of margin experience. Differences in literacy between margin-approved and non-margin approved investors are not as dramatic as they