Transcription
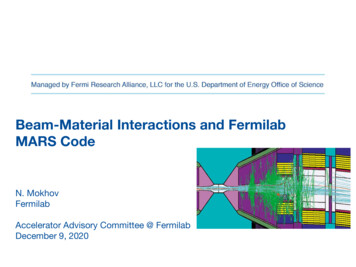
Columbia University REU at Fermilab 2005L. GladstoneSummer 2005The MiniBooNE experiment [1] is a νµ νe oscillation search at FermiNational Accelerator Laboratory designed to confirm or rule out the LSNDsignal [2]. The Fermilab Booster accelerates protons to 8 GeV; these protons strike a beryllium target, generating mesons which decay to produce theMiniBooNE νµ beam. The neutrinos interact in a 12 m diameter sphere filledwith mineral oil of food-grade purity, and the Čerenkov light from chargedparticles produced in these interactions is detected by 8 inch Hamamatsu [3]photomultiplier tubes (PMTs) lining the sphere. There are 1280 PMTs inthe light-tight inner signal region: 956 are Hamamatsu model R1408, inherited from the LSND experiment; the remainder are Hamamatsu modelR5912. Light produced in the outer concentric veto region is detected by anadditional 240 R5912 PMTs. A typical tube is pictured in Figure 1. Lightsignatures recorded by the PMTs are used to reconstruct events within thedetector. Leptons from charged current neutrino interactions are of particular interest, since these leptons tag the incoming neutrino flavor.It is important to sufficiently understand the operating characteristics ofthe PMTs, since they are the only active detector element in MiniBooNE.MiniBooNE uses a Monte Carlo simulation to understand the detector’s response to neutrino interactions. This program simulates photons travelingthrough the detector from creation to detection, and models all intermediateprocesses. The geometry of all detector elements is coded into the simulation,including that of the PMTs.Photons striking the photocathode in a PMT produce photoelectrons(PEs), whose number is amplified via a dynode chain; the magnitude of thecurrent so produced is proportional to the number of incident photons whoseenergy is above a certain threshold. A specific operating voltage had beenbfound for each PMT so that all tubes have the proper gain. Gain is definedhere as observed output charge (divided by charge per electron) per inputphotoelectron. The charge and timing information recorded from each PMTcan then be used to reconstruct the events off-line. Ideally, this information,1
2along with photocathode efficiency as determined by Hamamatsu, specifiesexactly when and how many photons hit the PMT. Each PMT had beentested in several ways to determine: basic functionality, timing resolution,charge resolution, dark rate and operating voltage. The operating voltagewas chosen so that the gain is closest to the desired 1.6 107 signal electronsper photoelectron. These tests were done previous to summer 2005, and theresults were used in subsequent testing.In addition to these global PMT tests, specialty tests were done duringmy summer REU at Fermilab on seven PMTs. The purpose of these testsis the following. In order for the Monte Carlo simulation to properly modelthe behavior of the PMTs, it is necessary to correctly include their efficiencyas a function of incident photon angle. The dominant effect comes simplyfrom the solid angle subtended by a PMT as a function of angle, and thisis handled by coding an approximate PMT shape into the simulation. Anyremaining efficiency function must be measured and entered into the code.The measurement, however, will itself contain the solid angle effects; thesemust be factored out of the measured angular efficiency to avoid doublecounting. A thorough understanding of the angle-dependent response, timeand charge resolution, and individual variations of the photomultiplier tubeswill help accurately identify neutrino events within the MiniBooNE detector.The main objective of the angular tests was to find how the response of thePMTs depended on the angle of incident light. There were three additionaltests. One tested a few tubes at various voltages. Another rotated the tubesabout two orthogonal axes arbitrarily labelled “yaw” and “pitch” to test theassumption that the tubes are rotationally symmetric. The last tested tubesin air, without the oil present in the other tests. The angular dependencedata from R1408 and R5912 tubes were kept separate until the final analyses.1ApparatusThe apparatus used for these tests is designed to replicate as closely as possible the characteristics of the MiniBooNE detector, on a much smaller andmore manageable scale. The central part of the apparatus is a 40 gallon,stainless steel tank, painted on the inside with the paint used in the detectortank: a primer and black top coat. The primer is Hydralon P water-basedepoxy primer (Sherwin Williams E72AC500/V66VC503 Hydralon P waterbased epoxy primer), and the black topcoat is a flat black moisture curealiphatic polyurethane chemical agent resistive coating (F93B102 Flat blackmoisture cure polyurethane). The tank can be filled with MiniBooNE oilwhen tests require it. It houses a single PMT, which can be rotated along
Columbia REU at Fermilab, L. Gladstone3Figure 1: A typical phototube used in the MiniBooNE detector: an 8 inchR1408 mounted on its wire frame. The base is coated with Masterbondbefore the PMT is installed into the detector.
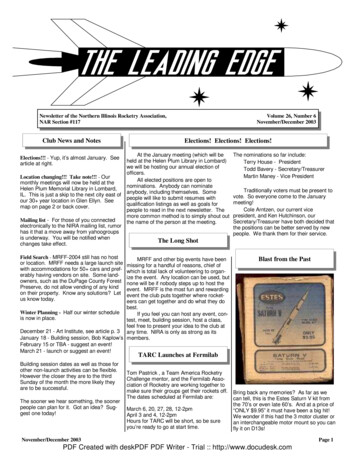
4the polar or azimuthal angle of the tube, using two precision rotary tables,one for pitch and one for yaw with respect to the table. The tubes were fixedto these tables with an arbitrary rotation, so “pitch” and “yaw” refer only tothe mechanical apparatus and not any characteristic of the tubes. These tables have externally-coupled mechanical controls which allow the phototubeposition angle to be changed without opening the tank and exposing thetube to light. A 10.25 inch diameter window at the front of the tank allowsthe tests to simulate the light in MiniBooNE events by propagating the lightseveral meters before it strikes the phototube. Because of this window, theentire testing room must be kept dark throughout each test.The light source is a PicoQuant PLS 450, a sub-nanosecond pulsed LED.Its center wavelength is 460 nm, with 50 µW average power at 40 MHz,approximately 30 nm spectral width, and typically 800 ps pulse width. Itwas used in 10 second sample periods at about 106 Hz. The light wasfiltered to produce a low-intensity beam ( 1 photoelectron per pulse). Thelight was directed through an optical cable to face the tank from a distanceof approximately 3 meters. The light from this source makes a cone withhalf-angle about 23 , with greatest intensity along the centerline. The 3 mdistance is great enough that one can assume that the entire face of the tubeis uniformly illuminated with light in parallel rays.The signals from the tube in the testing tank can be read out via anoscilloscope/GPIB card, or via the MiniBooNE data acquisition system. Forthe angular tests, a specialized data aquisition system was used (Fig. 2).The signal from the tube in the tank is amplified by a factor of 100, sent to adiscriminator with 30 mV threshold, and finally put into coincidence with thedelayed sync out signal from the LED pulser. The number of coincidencesand the number of input light pulses each go to a scaler; they are thenrecorded and used to calculate the relative efficiency.Figure 2: Testing tank data acquisition system block diagram. [5]The tank is magnetically shielded with a µ-metal box. This was donebecause ambient magnetic fields (e.g., the Earth’s) can influence the relative
Columbia REU at Fermilab, L. Gladstone5efficiency of the tubes, and thus rotation within these fields may change theshape of the relative efficiency results. To see if ambient magnetic fields couldhave a significant effect, the tank was rotated (while holding the configurationof the tube and internal light source constant). The resulting effect wassmaller than (but on the same order as) the angular dependence. When thetank was shielded and the same tests were performed, this dependence onorientation within ambient fields was not seen.2ProceduresThe apparatus detailed above was used to study relative efficiency (Erel ) as afunction of angle. Using rapid, short-duration pulses of the LED, the Erel ofthe tube was measured at a given position by taking the ratio of the numberof responses which coincided with LED pulses to the total number of pulses,with about 107 pulses per datum.Ãcoincidences outpulser pulses in! relative efficiency (Erel )Erel values were measured at 5 increments through the entire 360 ofresponse, with two repetitions at each point and two rotations of the tube(from θ 180 to θ 180 and back again) for a total of four measurements at each tube position. Data were recorded directly into a spreadsheet,providing an ongoing real-time check.This rotational test was performed on four R1408 and three R5912 tubes.Most of these tubes had been previously tested with the global testing, so theexpected dark rate was known, and known to be comparable to that for theother tubes. The global testing results also specified tube operating voltages.It was necessary to dark adapt each tube for at least 12 hours to obtain adark rate comparable to that of the tubes in the detector, which have notbeen exposed to bright light for over three years.The phototubes are essentially rotationally symmetric about their central vertical axis, with variation only in the dynode structure below the maindome. The R1408 tubes have “venetian blind” style dynodes; the R5912tubes have “box and line” style dynodes. No significant differences were observed when the dynodes at the starting position were oriented horizontally,vertically, or at 45 . Additionally, a test was performed on one tube varyingthe yaw angle (similar to the pitch measurements performed on all tubes);again no significant differences were observed. The equivalence of pitch andyaw implies that that the roll orientation of the tube does not affect theresults. This simplified the measurements greatly.
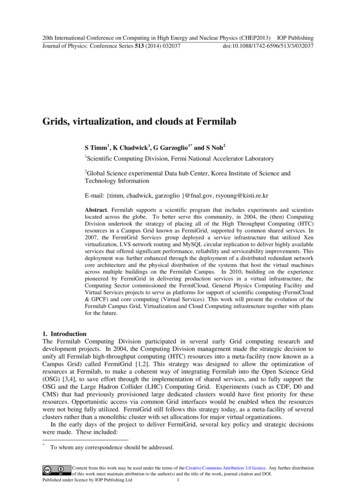
6Another test was performed by varying the operating voltages by 50 Vabove and below the nominal voltages found by previous MiniBooNE tests.The gain variation with voltage, which determines the max Erel , was alreadyknown, so this test checked for variation in the shape of the Erel curve morethan the expected variations in amplitude. None of significance was observed.3ResultsPlots of relative efficiency as a function of angle were made for each set ofmeasurements; these are roughly bell-shaped, as one would expect from theshape of the tubes. Typical results from an R1408 and an R5912 (with thefits as described below) are included in Figures 3 and 4. These plots aresimilar from tube to tube (see Figure 5). The parameters for the fits, as wellas the average which will be used in the MiniBooNE Monte Carlo simulation,are included in Table 1. The results obtained were compared to expectationsfrom the shape of the PMTs and results obtained by the SNO [6] experiment.The initial data were analyzed in the following way. Because the PMTrotator mount inside the tank does not precisely specify the initial angle,max Erel is found for each curve; the angle corresponding to max Erel is assumed to correspond to θ 0. Each plot’s horizontal axis is shifted accordingly before the plots are compared. Each y-axis is scaled to max Erel 1.An initial quadratic fit is performed on the central points of each plot to determine the horizontal shift. A 6-degree polynomial fit is then performed oneach plot in the region θ 150 to θ 150 . Outside of this region, statistics were significantly lower, making the data less comparable from tube totube. The fit polynomial is forced to be symmetric by employing only evenpowers of the incident angle. The polynomial coefficients are varied to minimize the χ2 . Finally, before comparing the functions, each fit is normalized bydividing by its constant term (which equals max Erel ), forcing max Erel 1.The results of the fits are shown in Table 1 and superimposed on Figures 5and 9.The errors on these data are dominated by tube-to-tube variation. Thetests on each tube individually had very high statistics, typically around2 107 light pulses at each measured angle, and about 600 000 responsesat central angles or 4 000 at extreme angles (where the tube was facingbackwards). Thus, to describe the error, it is more important to look at therelatively large differences between data sets from different tubes. This wasdone by examining the parameters of the fits. The average of the seven fittedvalues of each parameter and their standard deviation from that average aregiven in Table 1. Figure 5 compares each PMT to the average fit, and
relative efficiencyColumbia REU at Fermilab, L. 0incident angle (degrees)Figure 3: A typical data set from an R1408 tube (19s3) with its symmetric polynomial fit. This fit uses the horizontal shift and maximum relativeefficiency found from the initial quadratic fit.
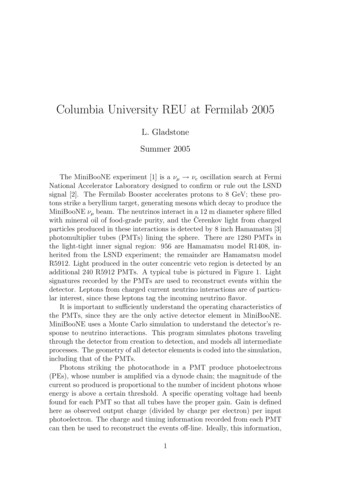
relative 00incident angle (degrees)Figure 4: A typical data set from an R5912 tube (SA2761) with its symmetricpolynomial fit, analogous to Figure 3.
relative efficiencyColumbia REU at Fermilab, L. 0incident angle (degrees)Figure 5: Composite relative efficiency data. The data in each series werefitted to a polynomial, and normalized to max Erel 1 at θ 0 . Theaverage fit is shown.
10Table 1: Normalized parameters from all all tubes tested. The error is thestandard deviation from the average of the seven tubes tested. These parameters are to be used in the following function for the Monte Carlo simulation,where θ is the angle of the incident light from the tube axis measured indegrees.Erel 1 a2 θ2 a4 θ4 a6 θ6 .tube ror% errora2-1.182 10 4-1.234 10 4-1.162 10 4-1.156 10 4-1.101 10 4-1.177 10 4-1.264 10 4-1.182 10 45.337 10 64.5a45.018 10 95.436 10 94.818 10 94.725 10 94.191 10 94.964 10 95.563 10 94.959 10 94.583 10 109.2a6-7.624 10 14-8.468 10 14-7.136 10 14-6.728 10 14-5.539 10 14-7.552 10 14-8.549 10 14-7.371 10 141.042 10 1414.1deviations from the average fit are shown in Fig. 6.The even-polynomial fits are sufficiently accurate and consistent for theR1408 tubes. For the R5912 tubes, the fits are less accurate on one side(see Figure 4). To describe this difference, several other fits of the R5912tube data were attempted. The main attempted non-symmetric fits used adifferent 5-degree polynomial for angles above or below zero, requiring onlythat they meet at θ 0. The same horizontal shift and max Erel were usedfor this fit as for the initial, even polynomial fit. However, it was found thatthe variation between individual tubes was larger than the average differencebetween R5912 tubes and R1408 tubes, so the even polynomial fit was usedfor all tubes.4Comparison to predictions and to SNO dataMiniBooNE’s relative efficiency angular data were compared to several geometrical models, and to data from previous tests from the Sudbury NeutrinoObservatory (SNO) experiment [6]. The three geometrical models assumedthe photocathode was a flat disk, a hemisphere, and the shape from the
percent deviation from average fitColumbia REU at Fermilab, L. 50incident angle (degrees)Figure 6: Comparison of the data for each tube to the average fit. This plotshows, for each tube, the percent difference between the data and the averagefit (i.e., 100 (Erel f (θ))/f (θ)).
12relative efficiencyHamamatsu technical specifications. The data from SNO were taken fromtests on two R1408 PMTs in air and water, for a total of four tests. ThePMTs in their detector are all Hamamatsu R1408 PMTs (the same as theMiniBooNE R1408 tubes), making comparisons with them particularly useful. These seven results are shown together in Figure 7. Note that all of theSNO results lie between the hemisphere and the ovoid shape predictions onthe top and the flat disk prediction on the bottom. SNO used water insteadof oil because the SNO detector contains water.10.80.60.40.20020406080100120 140 160incident angle (degrees)Figure 7: Relative efficiency predicted by assuming that the PMT is a flatdisk (black), a hemisphere (red), or ovoid shaped as in the Hamamatsu technical drawing (figure ?) (blue), and the results found by SNO from testingtwo PMTs each in air (purple) and water (cyan).While developing the testing procedure, one tube was tested withoutfilling the testing tank with oil. The results from this test, normalized tomax Erel 1, were very similar to the air tests done by SNO. This comparisonis shown in Figure 9.Comparisons among the angular response measurements, SNO data, andgeometrical models reveal overall similarities. The present data are alsoobserved to be closer to the geometrical model from the Hamamatsu ovoid
relative efficiencyColumbia REU at Fermilab, L. Gladstone1310.80.60.40.20020406080100120 140 160 180incident angle (degrees)Figure 8: Comparison of the average MiniBooNE Erel function (black curve)with the SNO results from testing two PMTs each in air (purple) and water(cyan) and the geometrical Erel function based on the Hamamatsu drawing(blue points).
relative efficiency1410.80.60.40.20020406080100120 140 160 180incident angle (degrees)Figure 9: Comparison of MiniBooNE data from the tube tested in air (black)to SNO test data taken in air (purple).
Columbia REU at Fermilab, L. Gladstone15shape description than to the results obtained in either air or water by SNO.This may be the case because these data were taken in oil, where the indexof refraction is much closer to that of glass than either air or water, resultingin less reflection at the oil-glass interface.5ConclusionThis paper has reported on angular tests of the R1408 and R5912 photomultiplier tubes used in the MiniBooNE experiment. The angular response ofthe tubes determined a sixth order polynomial function describing the angular response. This resultant fit made sense when compared to similar dataand geometric predictions.References[1] Proposal for the MiniBooNE http://www-[2] C. Athanassopoulos et al. [LSND Collaboration], Phys. Rev. Lett. 77,3082 (1996) [arXiv:nucl-ex/9605003].[3] Hamamatsu Catalog, “Large Photocathode Area PMTs”, p://www.hpk.co.jp/Eng/main.htm .[4] B. T. Fleming, L. Bugel, E. Hawker, V. Sandberg, S. Koutsoliotas,S. McKenney and D. Smith, IEEE Trans. Nucl. Sci. 49, 984 (2002).[5] J. May, M. Wysocki, L. Bugel, B.T. Fleming, P. Nienaber, andD. Smith, Nuclear Science Symposium Conference Record, IEEE, 1,10-16 Nov. 2002, pp. 446-449, vol. 1.[6] M.T. Lyon, PhD thesis, University of Oxford 59 (2002).
Columbia REU at Fermilab, L. Gladstone 5 e-ciency of the tubes, and thus rotation within these flelds may change the shape of the relative e-ciency results. To see if ambient magnetic flelds could have a signiflcant efiect, the tank was rotated (while holding the conflguration of the tube and internal light source constant).