Transcription
2014-2015ANNUAL REPORTCOVER CROP SURVEYA Synopsis of the information collected during the 2014-2015 Cover Crop SurveyJULY 2015
AbstractThis document summarizes information collected from more than 1,200 farmers across theUnited States who completed an online survey on cover crops in early 2015. A large majorityof respondents (84%) planted cover crops; 16% have not. The report sheds light on farmers’motivations for planting cover crops, their expectations of the benefits of the practice, users’concerns about cover crops and barriers to adoption among non-users.For the third year in a row, this survey charted a statistically significant increase in corn and soybeanyields following cover crops. Corn yields rose 3.7 bushels per acre, or 2.1%, following cover crops,while soybean yields increased a mean of 2.2 bushels per acre, or 4.2%.Acreage of cover crops also continues to climb steadily higher. The total reported acreage of covercrops planted by surveyed farmers in 2014 was 20% higher than in 2013, despite lower commodityprices.This year’s survey revealed an increase over last year’s in the number of respondents plantingbrassicas and cover crop mixes. In addition to hinting at a growing sophistication among covercrop users, the data on the most-planted cover crop species—led strongly by cereal rye, but alsoincluding a range of grasses, brassicas and legumes—will help seed producers and dealers focus theirdevelopment, training and promotional efforts.Details on where cover crop users source their seed, and where they would like to buy cover cropseed in the future, points to growth opportunities for cover crop seed specialists, and challenges forag retailers and commodity crop seed dealers eager to enter or expand in the growing cover cropmarket.Among the most interesting observations are the differences in motivation to plant cover cropsbetween current cover crop users and non-users. Insight into the motivations and influencesthat non-users say could inspire them to adopt cover crops can provide invaluable direction topolicymakers, advisors and communicators.Ninety-two percent of the farmers who do not currently plant cover crops say economic incentiveswould somewhat or always influence cover crop adoption. Similarly, while about half (46 percent) ofcover crop users say they would be motivated to plant more cover crops if the practice reduced theircrop insurance premiums, that number jumps up to 70 percent of non-users who said reduced cropinsurance premiums could or would influence them to plant cover crops.A significant finding—through a new question in this year’s survey—is that almost three-quarters ofthe cover crop users said the market outlook for cash crop prices would have little to no impact ontheir decision to plant cover crops. That challenges assumptions that cover crop acreage is closelytied to commodity prices.Finally, insight from both users and non-users on the developments they would like to see in covercrops could help set a positive, productive research agenda for the years to come.2
ContentsAbstract2Table of al Information7Cover Crop Users9Cover Crop Non-Users12Cover Crop Species13Cover Crops in Rotation16Sourcing Cover Crop Seed17Managing Cover Crops19Cover Crops and Yield23Benefits of Cover Crops26Cover Crop Challenges29Incentives to Using Cover Crops30Influences on Cover Crop Adoption35Cover Crops and Pollinators41Research Priorities for Cover Crop Development43Conclusion453
AcknowledgementThis report is the third in a series of annual cover crop survey reports that started by evaluating farmers’ use of cover cropsduring the 2012 cropping season.There are many people who deserve a thank you for their contributions to this survey and report. First and foremost are thefarmers and others who have contributed their information to this survey. Without the input from farmers, both those usingcover crops and those who have not used them, this survey would not contain the robust insights and learning opportunitiesthat it continues to produce. There are several detailed questions associated with this survey, and we appreciate the time thatall participants have taken to provide thoughtful answers and contribute personal insights and anecdotes. The partners on thissurvey are eternally grateful to all those who are willing to contribute to the information and knowledge base in this survey.As always, Dr. Rob Myers with the North Central Sustainable Agriculture Research and Education (SARE) programdeserves the lion’s share of the credit for making this survey happen. Without the guidance and vision of Dr. Myers and hiscommitment to the promotion and education of soil health, cover crops and conservation farming systems, this survey wouldnot be what it is today. His vision on how to use the information to educate everyone from farmers to policymakers hasmultiplied the usefulness of this survey and the information that comes out of it many times over.This year, SARE and the Conservation Technology Information Center (CTIC) welcomed the American Seed TradeAssociation (ASTA) to the list of partners who contributed to this survey. Jane DeMarchi, who represented ASTA on theplanning committee for this survey, did a fantastic job of collecting information from key members of her organization andusing that insight to improve the variety of questions asked in this year’s survey. The contributions from Ms. DeMarchi andher colleagues at ASTA most certainly improved the quality and variety of questions that were included in this survey.Penton once again partnered with CTIC, SARE and ASTA on this year’s survey. Through the company’s renowned Corn andSoybean Digest, Kurt Lawton and Scott Grau helped distribute the survey link to a wide range of farmers across the agriculturalUnited States. Their relationship with their readers most certainly contributed to the great response to this year’s survey.Dr. Wally Tyner and Myriam Bounaffaa from Purdue University were instrumental in performing the statistical analysis of theraw data gathered from this year’s respondents. Their analysis and insight contributed greatly to the accuracy and reliability ofthe numbers in this survey.Also from Purdue University, Dr. Linda Prokopy used her vast knowledge and experience with surveys to help us craftquestions that would provide the best and most accurate information. Her expertise guided the development of questionsthat delivered insightful responses.Steve Werblow is once again the author of this report. Steve’s ability to review and synthesize information and his ability toput that information into words has helped information from this survey reach multiple audiences across many sectors ofagriculture.The Conservation Technology Information Center (CTIC) also deserves credit for this survey. Convening the planninggroup, collecting and crafting the questions, distributing the survey link, collecting and analyzing the data, and troubleshootingproblems with the online survey instrument are all necessary tasks that contribute to the success of the survey and enhancethe ability of survey users to accurately and easily report their information.Ultimately, there are many people who contributed to this survey and report. Unfortunately, I cannot list each and everyperson who contributed, as the list would be too long. For all who contributed, I offer you a sincere thank you for thecontribution of your time, knowledge and expertise to this project. This survey and report would not be what it is without thecontributions of so many dedicated and qualified people. Thank you!Chad Watts, Project DirectorConservation Technology Information CenterWest Lafayette, IndianaJune 20154
IntroductionFor the third year in a row, a nationwide survey of U.S. farmers reveals the expansion of covercrop acres on cropland. A growing number of farmers and crop advisors recognize the benefits ofplanting grasses, legumes, brassicas and other seasonal crops—or a mixture of species—to protectsoil from erosion, increase organic matter and build healthier soils between cash crops.In March and April, 2015, the Sustainable Agriculture Research and Education (SARE) programand the Conservation Technology Information Center (CTIC) invited farmers across the UnitedStates to take an online survey at QuestionPro.com about their use of and thoughts on cover crops.More than 2,472 people answered at least some of the survey questions. Of that group, 1,229respondents—representing 47 states—completed the entire survey.The survey was quite detailed; respondents who completed the survey spent an average of 16minutes answering the questions. The survey instrument was designed to follow up on two previousyears of farmer questionnaires on cover crops.Though there may have been overlap between the respondent pools in 2013-2014 and 20122013, the respondent pools were not exactly the same set of farmers. Therefore, there are somelimitations to how data from previous surveys may be combined with or compared to results of thisone. However, the data in this report contribute significantly to our understanding of the growinginterest in cover crops, as well as the appeal and barriers to adoption.Information from this survey is available online at: www.sare.org/covercropsurveyUsing cover crops and reducing soil disturbance can improve soil biota.5
MethodThe 2014-2015 SARE/CTIC Cover Crop Survey instrument was developed by SARE and CTICin cooperation with researchers from Purdue University and posted online via QuestionPro.com.Invitations to participate in the survey were distributed nationwide via email to a broad farmer base,including: More than 50,000 farmers from the subscriber lists of Penton Farm Progress publications,via email blasts from the publisher;Participants in CTIC activities including the Center’s popular Conservation in Action toursand demonstration plot tours;Steering committees of the Indian Creek Watershed Project and the ConservationAgriculture Systems Alliance (CASA);Email addresses collected from various lists of farmers and farm advisors;Respondents inspired to participate after reading press releases on the survey published in avariety of farm media, websites and organizational email blasts.Respondents in earlier SARE/CTIC Cover Crop Surveys.After indicating whether they had planted cover crops in the past five years, respondents were splitinto two groups—users and non-users of cover crops. Often, some respondents to these kinds ofsurveys begin the process simply to view the questions that are being asked. To maintain the purityof our data and use only data provided by farmers, all non-farmers were directed to a location wherethey could download the questions and did not have to pass through all the survey questions. Thisminimized the chances of using data that does not reflect on-farm perspective. As with previousSARE/CTIC Cover Crop Surveys, the respondent pool skewed toward cover crop users, whichmeans the questionnaire yielded richer data on users’ practices and opinions, but represents asignificant over-reporting of cover crop use compared to the general population of farmers.Of 2,472 people who began the survey, 1,229 completed the questionnaire. We believe there werea variety of reasons that the survey was not completed by all who started it, including time to finishthe survey, relevance of some of the questions, and occasional software issues. Although everysurvey method has challenges, the results of the survey provide an excellent and detailed look at thehopes, concerns and approaches of a wide range of cover crop users, as well as respondents whodo not employ cover crops. These results can help guide a wide range of activities that promotethe adoption of cover crops, from strategic planning to crop development, technology transfer andpromotion.6
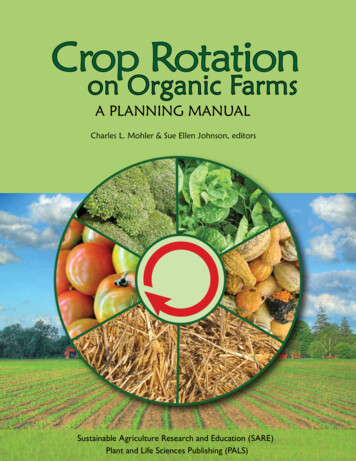
General InformationRespondents to the survey represented 47 U.S. states—all but Delaware, Nevada and Wyoming.States with the highest numbers of respondents were Iowa, Illinois and Indiana. Minnesota,Wisconsin, Kansas and Ohio represented the states in the second-highest tier of responses.More than half of the respondents farmed crops only with 47% describing themselves ascommodity crop producers in a question in which commodity crops were listed as “corn, soybeans,wheat, cotton, sorghum, etc.” and an additional 14% describing themselves as horticultural crop orvegetable growers. Respondents with livestock included livestock-only producers (4%), producers ofboth commodity crops and livestock (16%), horticultural/vegetable farmers with livestock (5%) andproducers of commodity and horticulture/vegetable crops with livestock (3%).NationwideRespondentPool2015 CoverCrop SurveyUser RespondentsWashingtonNorth South oKansasMissouriMaineVermontNew HampshireMichiganNew YorkMassachusettsConnecticutPennsylvaniaOhioNew JerseyIndianaWest OklahomaArizonaNew MexicoTennesseeNorth CarolinaArkansasSouth CarolinaMississippi Alabama GeorgiaTexasLouisianaLegendFloridastatesCover Crop Users0. 56 - 137 - 4647 - 8081 - 13302154308601 in 473 miles71,290Miles1,720
How Would You Characterize Yourself?Asked about specific crops planted on their farm, cover crop users provided the following details:75% (of 1,151) reported planting corn, 68% (of 1,136) said they planted soybeans, 7% of 1,116planted sorghum, 34% of 1,122 planted wheat and 1% of 1,122 respondents planted cotton.A soil pit shows the true soil health benefits of using cover crops.8
Cover Crop UsersAsked whether they had ever used cover crops on their farm, 84% of 1,702 respondentsanswering the question reported that they had. Just 16% said they did not use cover crops. Basedupon the answer to this question, respondents were channeled into “user” and “non-user” stringsof questions. The balance did not answer the question and likely did not proceed with the rest ofthe survey.The mean amount of experience with cover crops among cover crop users in this survey was 7.33years, based on 1,366 responses to the question.Cover Crop Users: Acres Farmed in 2014Of 1,388 cover crop users who provided data on the number of acres they farmed during the2014 cropping season, a narrow majority—51%—reported farming 500 acres or more. Thelargest segments of respondents, 18% each, fell into the 500-to-999-acre and 1,000-to-1,999-acreand 1-to-9-acre categories. An additional 14% farmed 180 to 499 acres in 2014.Average Cover Crop Acreage per Respondent9
Asked to report on the acres of cover crops they had planted in previous years and how manyacres they expected to plant in 2015, cover crop users in this survey projected a mean cover cropaverage of 300 acres. Those farmers also reported planting a mean of 259 acres in cover crops in2014 and a mean of 225 acres in 2013—a steady and rapid increase in cover crops on their farmsover the past several years.In fact, the average number of acres planted to cover crops by cover crop users in this year’sstudy nearly tripled between 2010 and 2015, rising from 119 to 300 acres. Reported cover cropacreage from 2010 to 2013 in the most recent survey very closely tracked results of the 2014SARE/CTIC Cover Crop Survey.Comparing the current survey with last year’s survey data, the mean area that the 2015respondents reported planting to cover crops in 2014 was 259, 15% higher than the 232 acresreported as the intended acreage to be planted in 2013 by respondents to the 2013-2014 survey. Itis interesting to note that the larger the farm, the lower the proportion of acreage planted to covercrops.Because of both a rise in acreage per farm and additional farmers using cover crops for the firsttime in 2014, total reported acreage rose among survey participants by 20.8% in 2014 versus2013 (326,441 acres vs. 270,308 acres). The total acreage of cover crops reported per year in themost recent survey was somewhat lower than the 2013-14 survey because fewer farmers reportedtheir acreage this year. However, the pattern in year-over-year increase is very similar for bothsurveys.Total Cover Crops Reported by Year10
% of Farmed Acres where Cover Crops are UsedAnnual Ryegrass used as cover crop on a farm in Michigan.11
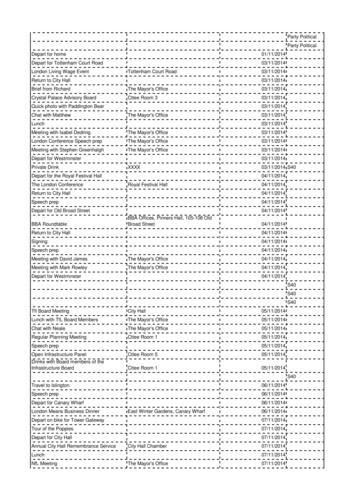
Cover Crop Non-UsersThe largest portion—27%—of non-users in the 2015 survey reported farming 500 to 999 acres andthe second-largest group, 22%, farming 1,000 to 1,999 acres. In fact, 60% of the 272 non-users whoresponded to the acreage question farm more than 500 acres.The vast majority of the non-users responding to the survey employ some means of conservationtillage. Nearly 25% of the 238 non-users practice continuous no-till, 21% use no-till in rotation, 20%report using reduced tillage methods and 7% use only vertical tillage. Conventional, full-width tillageis employed by 28%.What Tillage Practice Do You Use the Most On Your Farm?(Non-Users)Continuous no-till24.75%Conventional (fullwidth) tillage27.72%Vertical tillage only(i.e. Aerway, Turbo-till,Salford, etc.)6.93%Rotational no-till (i.e.no-till soybeans andtillage prior to planting corn)20.79%Reduced tillage (i.e.strip-tillage, mulchtillage, etc.)19.80%12
Cover Crop SpeciesFarmers plant a wide range of cover crop species based on an array of variables, from suitability tolocal conditions to ease of management, specific effects on soil properties, and others.Cereal grains and grasses were the most popular cover crops, planted by 84% of the 1,287cover crop users who answered this question. Cereal rye was by far the leading species of covercrops, accounting for approximately 44% of the total 2014 cover crops reported in the survey.Respondents predicted that they would also plant 44% of their cover crop acreage to cereal rye in2015.Annual ryegrass covered about half that acreage to capture a distant second place, with 23% of thetotal cover crop acres planted in 2014 and the same percentage projected for 2015. Among cerealsand grasses, oats were third most popular, covering 17% pf respondents’ farmland in 2014, with thesame proportion slated for planting in 2015. Tritcale and winter barley were also noted on the list ofthe top five cereals and grasses.Annual Grass and Cereal Grain UseOf 1,302 cover crop users who answered a question about planting brassica cover crops, 61% repliedthat they had planted a brassica cover in 2014 and/or intended to do so in the 2015 cropping season.Of the brassicas planted or planned on, radish represented by far the greatest number of acres in2014 and 2015 (33% and 32%, respectively), while rapeseed and turnips were neck-and-neck forsecond place, with rapeseed on 14.5% of the acreage, turnips on 12% of the acreage in 2014 and aprojection of 19% of the 2015 acreage in rapeseed and 15% in turnips.13
Percentage of Reported Cropland Acreswhere Brassicas were used as Cover CropsOf 1,251 respondents who answered a question about planting legume cover crops, 57% said theydid. Of the legumes, crimson clover was the leading species, with 18% of the acres planted in 2015and slightly less – 15% - projected for 2015. It is interesting to note that the projected plantingof crimson clover was the only cover crop species in the survey to reflect a slight decrease in 2015compared to 2014.By contrast, respondents expected to increase their acreage of hairy vetch from 7% of the 2014acres to 8% of the acreage projected for 2015, and to boost their sunn hemp acres from 3% to 4%in that period.Winter peas (9% of the acres in 2014 and 2015), cowpea (6% both years), red clover (projected toremain steady at 5% of the acreage in 2014 and 2015) and “other clovers” also made the legume list.Percentage of Reported Acreage Dedicated to Legume UseNon-legume summer annuals, including buckwheat, sorghum sudan and millet, were planted by 33%of 1,240 respondents.14
Percentage of Reported AcreageDedicated to Summer Annual UseCover crop mixes were extremely popular. Of 1,233 respondents who answered a question aboutplanting mixes in 2014 or 2015, 67% said they had or would. Mixes of four or more species of covercrop were most popular, accounting for 62,255 acres (26.3%) of respondents’ land in 2014 andprojected to cover 81,685 acres (21.9%) in 2015—a notable acreage increase of 31%.Two-way mixes held a steady second place with 57,253 acres in 2014 and 59,708 acres projected for2015, while three-way mixes accounted for 33,505 acres in 2014 and 42,959 acres expected for 2015.Reported Acres that are Dedicated to Cover Crop MixesIt is interesting to note that respondents in this year’s SARE/CTIC Cover Crop Survey were moreinclined to plant brassicas and cover crop mixes than their counterparts in last year’s survey. Thisyear, 61% planted brassicas compared to 55% last year, and 67% planted cover crop mixes of two ormore species, vs. 60% of last year’s respondents.15
Cover Crops in RotationRow crop producers who reported using cover crops were asked where cover crops fit into theirrotations. The largest percentage—25% of the 1,544 respondents to this question—reportedplanting cover crops before both corn and soybeans. Cover crops following small grains was a closesecond place, accounting for 21% of the responses.Equal numbers of respondents—16% each—reported planting cover crops after soybeans/beforecorn and after corn/before soybeans. Cover crops in a continuous corn program tallied 16% of theresponses, while 3% of the farmers reported using cover crops in continuous soybeans. Sorghumand cotton garnered fewer responses; “other” accounted for 9% of the tally.Where Do Cover Crops Fit Into Your Rotation?(Row Crop Producers)Of 264 vegetable/horticulture crop producers who responded to a question about the timing ofcover crops, 71% reported planting cover crops after they harvested their cash crops, while 29% saidthey planted cover crops before harvesting their cash crops. Row crop growers exhibited a similarratio: 68% (of 720) planted cover crops after harvesting their cash crops, while 32% seeded covercrops while their cash crops were still in the field.16
Sourcing Cover Crop SeedUnderstanding where farmers source their cover crop seed is important to developing strategies forsharing information, making new seed available and predicting the ease or challenges of sourcingseed.The most popular source of cover crop seed among 1,350 cover crop users in the survey was“company specializing in cover crop seed sales,” a selection made by 36% of the farmers. Ag retailerswere a cover crop seed source for 31% of the respondents. Less popular were commodity crop seeddealers—the providers of seed for corn, soybean and wheat crops, for instance—with 13%, anotherfarmer with 12% and “other” with 9%.Asked where they would like to source cover crop seed in the future, the survey’s results predict arise in market share among cover crop seed specialists, at the cost of ag retailers and commoditycrop seed dealers. Of 1,038 cover crop users who answered the question, 41% said they would liketo buy cover crop seed from a company that specializes in cover crop seed sales. Ag retailers’ sharedropped from 31% to 25%, and commodity crop seed dealers fell from 13% to 9.5%.That hints at exciting business opportunities for cover crop seed specialists and challenges forag retailers and conventional seed channels in serving the growing cover crop market. However,one reviewer of the data questioned whether this result will accurately predict buying behavior, asrespondents chose the least convenient—but best-sounding—option.Where Do You Currently Purchase Your Cover Crop Seed?Please Choose All That Apply17
Where Would You Like to Purchase Most ofYour Cover Crop Seed From in the Future?Sourcing Cover Crop SeedCover crop users were also asked which information on cover crop seed tags was most important.Germination led the list with 30%; noxious weed content (29%) and purity (28%) were close behind.Only 9% said they do not consider the information on the seed tag, indicating that the large majorityof respondents are very quality conscious about their seed.18
Managing Cover CropsA series of questions explored the methods of planting and terminating cover crops. Data fromthese questions were analyzed in two groups—row crop producers and vegetable/horticulture cropproducers—to minimize the chances that differences in tillage and other crop management systemsbetween the two widely differing types of crops would skew the results. Respondents were allowedto select more than one answer; the results below reflect the percentage of times each answer wasselected among the total number of responses. As a result, the “n” value is the number of responses,not the number of respondents.Row crop producers were most likely to drill their cover crop seed (38% of 1,288 responses), whilebroadcast seeding with light incorporation—which was used by 14% of the row crop farmers—wasmost popular among vegetable and horticulture crop growers (45% of 387 responses). Among thevegetable/horticulture producers, drilling cover crop seed was the third most used choice, with 16%of the responses.Aerial seeding was the second most popular means of planting cover crops among row cropproducers, with 23% of the responses. By contrast, just 4% of the vegetable/horticulture growersflew on their cover crop seed. Instead, 9% of the vegetable/horticulture respondents reportedbroadcasting cover crop seed with a high-clearance seeder and 18% used some other surface-seedingtechnique such as a fertilizer spreader.Among 1,105 cover crop users, 70% planted and established their own cover crops. Another 20%hired an aerial applicator to seed their cover crops, 6% contracted with an ag retailer, and 4%reported “other.”Which of the Following Methods DidYou Use to Plant Your Cover Crops?(Row Crop Producers)19
Which of the Following Methods DidYou Use to Plant Your Cover Crops?(Vegetable/Horticulture Crop Producers)Termination of cover crops also differed between row crop and vegetable/horticulture groups. Asignificant majority of row crop producers—59% of 934 respondents—named herbicides as theirprimary method of terminating their most recent cover crop. Among row crop producers, 23%said they relied on winter kill as their principal means of termination, and 24% use winter kill as anadditional (non-primary) way to terminate cover crops.Non-chemical means of termination are more popular with vegetable/horticultural crop producersthan they are with row crop farmers. Nearly half of the vegetable/horticulture producers—49%of 269 farmers who answered the question—employed tillage as the primary means of terminatingtheir last cover crop. Twenty percent plant cover crops that winter kill, and 19% mowed their mostrecent cover crop to terminate it. By contrast, just 4% of the row crop respondents mowed theircover crop as the primary means of termination.Listing methods of terminating cover crops used to a lesser degree, 28% of the vegetable/horticulture crop producers reported mowing, 25% relied on winter kill and 20% used tillage.20
What Is the Primary Cover Crop Termination MethodYou Used on Your Most Recent Cover Crop?(Row Crop Producers)Do You Use Any Other Methods of CoverCrop Termination to a Lesser Degree?(Row Crop Producers)21
What Is the Primary Cover Crop Termination MethodYou Used on Your Most Recent Cover Crop?(Vegetable/Horticulture Crop Producers)Do You Use Any Other Methods of CoverCrop Termination to a Lesser Degree?(Vegetable/Horticulture Crop Producers)22
Cover Crops and YieldFor the third year in a row, SARE/CTIC Cover Crop Survey results revealed a yield benefit to the use of covercrops in corn and soybeans.In corn, a mean national yield advantage of 3.7 bushels per acre—a 2.1% increase—was reported on fields that hadbeen planted to cover crops, compared to similar fields that had not been cover cropped.Data on the 2014 season reported by 401 farmers provided the corn yield figures. Farmers reported a mean cornyield of 172.5 bushels per acre on fields that had not been planted to cover crops in 2013 and a mean yield of 176.2bushels per acre on fields that had been cover cropped the winter before planting.For soybeans, the use of cover crops in 2014 corresponded to a mean 2.2-bushel (4.2%) yield increase nationallyduring the 2014 growing season, based on analysis of data reported from 362 farms. Mean soybean yields in theanalysis were 51.4 bushels per acre on fields without cover crops and 53.6 bushels per acre following cover crops.Those yield benefits are in line with results from previous SARE/CTIC Cover Crop Survey results. Last year’ssurvey found a 4.98 bushel (3.2%) average increase in corn yields and 2.0 bushel (4.3%) mean boost in soybeanyields following cover crops. The first survey, conducted in 2012-2013, charted an average increase of 11.1 bushelsof corn (9%) per acre and 4.9 bushels of soybeans (10%) for the 2012 crop season. Data indicate that yield impactfrom cover crops may be more dramatic when cash crop growing conditions are more challenging—for instance,drought conditions in 2012 may have made the moisture-enhancing benefits of cover crops more vital.Mean Corn Yield With and without Covers23
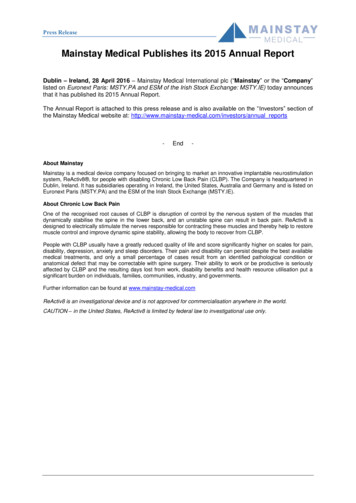
Mean Soybean Yields with and without CoversTo help ensure the highest validity of data, analysts removed answers that were clearly space holders (for instance,yield estimates of zero or extremely high values such as 1,000). In the same process used in the analysis of datafrom the 2013-2014 SARE/CTIC Cover Crop Survey, the top and bottom 1% were “trimmed off ” the dataset to minimize the impact of outliers, and the mean calculated from the remaining values. As a result, the yieldadvantages are considered statistically significant.Data were analyzed by Myriam Bounaffaa at Purdue University, under the guidance of
2014-2015 ANNUAL REPORT COVER CROP SURVEY A Synopsis of the information collected during the 2014-2015 Cover Crop Survey JULY 2015. . Though there may have been overlap between the respondent pools in 2013-2014 and 2012-2013, the respondent pools were not exactly the same set of farmers. Therefore, there are some .