Transcription
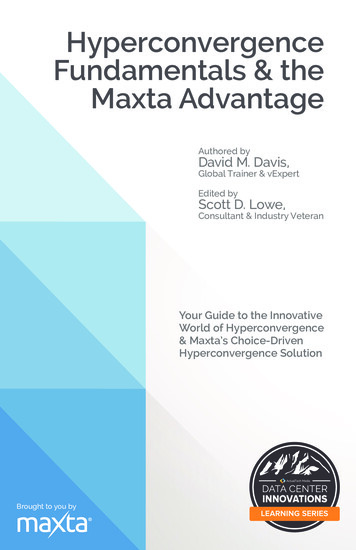
SARE TECHNICAL BULLETINAg Innovations SeriesTECHNICALBULLETINCONTENTSIntroduction.1How to Get a Faster Returnfrom Cover Crops.3An In-Depth Look atManagement Situations WhereCover Crops Pay Off Faster.8The Off-Farm Impactsof Cover Crops. 20The Bottom Line onCover Crops.23Resources and References.24Available at:www.sare.org/cover-cropeconomics, or order freehard copies at (301) 779-1007.June 2019www.SARE.orgPeer-reviewed researchfindings and practicalstrategies for advancingsustainable agriculturesystemsCereal rye is the most widely planted cover crop in the United States, being used on several million acres for erosion control,weed suppression and soil improvement. Photo by Edwin RemsbergCover Crop EconomicsOpportunities to Improve Your BottomLine in Row CropsWhen it comes to making the big decisions about managing a farm,whether it’s to grow a new crop, buy an expensive piece of equipmentor upgrade infrastructure, farmers are business people first. If the ideadoesn’t work out on paper, either by cutting costs or raising revenue, then it likelywon’t happen.With the decision to adopt cover crops, a conservation practice that is becoming increasinglypopular throughout the country, the economic picture can admittedly be hard to decipher atfirst. This is because a simple, one-year budget analysis of cover crops, one that just comparesthe cost of seed and seeding to the impact on the next crop yield, may indeed show a loss.Yet most farmers who have long-term experience with cover crops and who carefully keeptheir books have discovered that cover crops do in fact pay. These farmers usually look atcover crops from the broad, holistic standpoint of how they will improve the efficiency andresiliency of the entire farm over time.“Look at cover crops as an investment rather than a cost,” advises Justin Zahradka, whofarms 900 acres in North Dakota and has been planting cover crops since 2011. Cover cropsallow Zahradka to extend the grazing season for his livestock, grow his soil’s organic matterand maintain more consistent yields in wet or dry years.Or, as he puts it, cover crops help him “be more productive on each acre.” (Zahradka’s farmis profiled later in this bulletin.)Cover Crop Economics: Opportunities to Improve Your Bottom Line in Row Crops 1
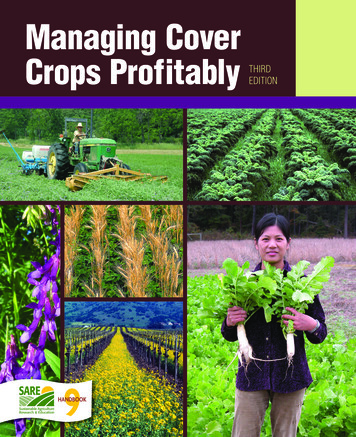
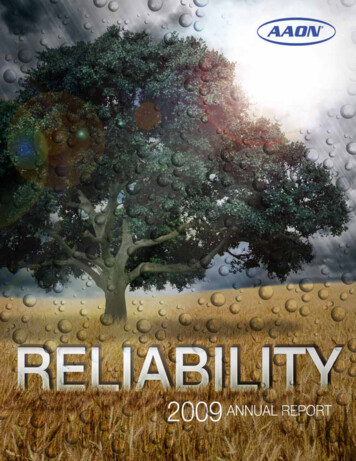
SARE TECHNICAL BULLETINCover crop acreageincreased 50%nationally from2012 to 2017.(USDA Census of Agriculture)Every business-savvy farmer knows thatsome purchases cannot be evaluated solelyon their first-year financial impact. Buyingnew farm machinery or applying lime toacidic soils are typical examples of purchases that come with longer pay-back periods.Similarly, crop insurance seldom pays for itself the year it is bought. In the same manner, because cover crops gradually improvesoil health and the productivity of fields,their economic value is best understoodover a multi-year period.Under circumstances where cover cropsare the only change made to farm management, it can take a few years for cover cropsto fully pay for themselves. But, as farmersgain experience and expand the number offields that are cover cropped, they find avariety of ways to accelerate the return ontheir investment. In some situations, covercrops can provide a positive return in thefirst year or two of use.This bulletin will describe seven specificsituations in which the profitability of covercrops can be accelerated. These situationsreflect both common production challenges that row crop farmers face (for example,herbicide-resistant weeds) and opportunities (for example, the transition to no-till).Much of the baseline economic information that underlies the financial analysis ofthese situations derives from five years ofdata from the National Cover Crop Surveyconducted by SARE and the ConservationTechnology Information Center (CTIC) forthe 2012–2016 growing seasons. Farmer profiles share real-world examples of how themultifaceted benefits of cover crops translate into profitability.Three key takeaways on cover crop economics have become clear through ouranalysis:1. A thorough evaluation of cover cropeconomics looks at the overall changesfarmers typically make to crop management over a multi-year period of usingcover crops. Farmers who are most satis-Tennessee farmer Ray Sneed plants a five-species cover crop mix to accomplish multiple management goals, in particularto control weeds and improve irrigation efficiency. Photo by Pete Nelson, AgLaunch Initiativefied with their return on investment takea holistic look at how they manage theiroverall cropping system and often makea suite of changes that improve overall efficiency, rather than alter just onepractice (such as planting a cover crop).2. In most cases, farmers need to use amulti-year timeline to evaluate the returnfrom cover crops, much as they would forapplying lime or buying equipment. Whilean economic return can come relativelyquickly in certain situations, such aswhen using cover crops for grazing or tocontrol herbicide-resistant weeds, themaximum return will build steadily over2 Cover Crop Economics: Opportunities to Improve Your Bottom Line in Row Cropsseveral years as the soil improves and asthe farmer gains experience incorporating cover crops into their overall system.3. One of the most-often-cited economicbenefits of cover crops by experiencedusers is their impact on the resiliency ofthe cropping system. Farmers are findingthat by helping to minimize droughtrelated yield losses or sometimes allowing earlier planting in a wet spring, covercrops serve as a type of crop insurance.As with ordinary crop insurance, the premium you pay for cover crops will payoff big in some years, but not every year.www.SARE.org
SARE TECHNICAL BULLETINHow to Get a Faster Return from Cover CropsWhen evaluating average fields in average weather conditions, it can take three or more years for cover cropsto pay off if no incentive payments are obtained and no special circumstances exist. However, every farmerhas their own challenges and opportunities that can affect this picture. Therefore, when evaluating theeconomics of cover crops, it can be helpful to consider common situations or scenarios under which they will pay forthemselves more quickly, often within a year or two. Seven situations in which cover crop profits are accelerated arelisted here and then described in more detail in a later section of this bulletin.Cover crops can pay their way more quickly when:1. Herbicide-resistant weeds are a problem2. Cover crops are grazed3. Soil compaction is an issue4. Cover crops are used to speed up and ease the transition to no-till5. Soil moisture is at a deficit or irrigation is needed6. Fertilizer costs are high or manure nutrients need to be sequestered7. Incentive payments are received for using cover cropsMany farmers may experience more thanone of these situations. Cover crops willquickly pay off when two or more of thesesituations occur together. The farmers profiled in this bulletin reflect this view thatcover crops are most profitable when theyprovide benefits in multiple areas.For example, Tennessee farmer RaySneed plants a five-species cover cropmix with multiple goals in mind. “Each species has a job, and those jobs are based onwhere I have problems,” says Sneed, whofarms 10,000 acres of corn, soybeans, wheatand cotton.His mix includes tillage radishes, crimsonclover, wheat, cereal rye and turnips. Theirprimary jobs are to scavenge nutrients, alleviate compaction, improve water infiltration and suppress weeds. After six yearsof cover cropping, Sneed is saving moneyby using less irrigation water, fertilizer andherbicide. “We’re learning that we can usesome of these species to offset the costsof growing our crops,” he says.Before getting into the detailed economics of these seven situations, the first stepin this bulletin is to summarize some base1line data on cover crop yield impacts andto outline assumptions on cover crop costsand returns. These numbers will provide abaseline for the seven specific situations inwhich cover crops can provide a reasonablyfast economic return.How Do Cover CropsImpact Yield Over Time?Almost any farmer with several years ofcover crop experience will report thatthey have seen improvements in both thesoil and crop performance over time. “Youwill have a cost savings if you stay with it,”Sneed says. To better understand how thenumber of years spent planting a covercrop impacts crop yield, data was collectedfrom farmers responding to the SARE/CTICNational Cover Crop Survey.1 Farmers whoplanted cover crops on some fields but noton others, and who otherwise managedthose fields similarly, were asked to reporton respective yields (Table 1). Though notall farmers had comparable fields with andwithout covers to report on, there werestill several hundred farmers who providedyield data each year. The biggest yield differences were reported after the droughtyear of 2012, with average reported yieldincreases of 9.6% in corn and 11.6% in soybeans. Based on the high corn and soybeanprices following the 2012 drought year,cover crops provided a helpful profit boostthat year.It is important to point out that althoughthe several hundred farms reporting datarepresent a good-sized data set, these wereself-reported numbers. Also, it was clearthat yields from field to field varied, withTABLE 1. Percent increase in yield for corn and soybeans following cover cropsversus comparably managed fields with no cover crops11CROP .2%20151.9%2.8%20161.3%3.8%Data is from the SARE/CTIC National Cover Crop Surveys conducted annually for crop years 2012–2016.The National Cover Crop Survey was conducted for five years covering the 2012–2016 cropping seasons. The survey was done by Conservation Technology InformationCenter staff with funding from SARE. In years three to five of the survey, partial funding was also provided by the American Seed Trade Association. Typically, about2,000 farmers filled out the survey in years two to five of the survey, while in the first year 759 farmers responded. The full reports on the survey are available at www.sare.org/covercropsurvey.www.SARE.orgCover Crop Economics: Opportunities to Improve Your Bottom Line in Row Crops 3
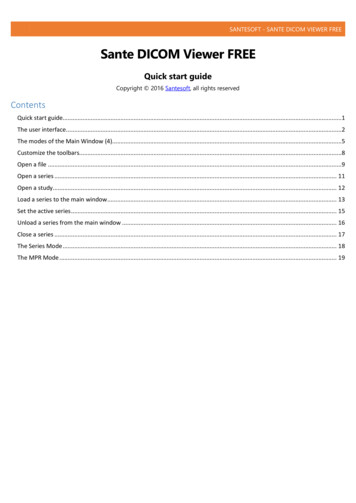
SARE TECHNICAL BULLETINCrimson clover is the most popular legume cover crop in the United States. Photo by Rob Myers, North Central SAREa few fields having yield losses after covercrops and with some fields showing no difference. Many farmers reported a yield increase on their fields, but individual experiences varied. While the SARE/CTIC surveydata set is by far the largest set available oncover crop yield impacts, it is worth notingthat other cover crop studies have reporteda range of yield impacts, from minor lossesto minor increases in corn yields. For soybeans, some studies have shown that yieldsare unchanged with cover crops, while others have shown a modest improvement inyields. Fewer data reports are available onthe yield impact of cover crops on othercash crops.For cropping years 2015 and 2016, the survey included an additional question: Howmany years have you consecutively usedcover crops in the fields for which you arereporting yields? Using those two years ofdata, a simple linear regression analysis wasdone to look at yield response. The farmerdata set for those two years is very similar in a number of metrics, indicating a highpercentage of the same farmers filled outthe survey both years, so it was deemedvalid to take an average of the two yearsof data (crop years 2015 and 2016), covering yields of about 500 farmers each year.From that regression analysis, Table 2 wasconstructed to look at how yields changein response to duration of cover crop usein a field.The regression analysis of yields based onduration of cover cropping clearly showedthat corn and soybean yields increased inTABLE 2. Percent increase in corn and soybean yields after one, three and fiveyears of consecutive cover crop use on a field, based on a regression analysis ofdata for crop years 2015 and 20161ONE YEARTHREE YEARSFIVE s shown are an average of yields from the 2015 and 2016 growing seasons, with yield data obtained from about500 farmers each year through the SARE/CTIC National Cover Crop Survey.14 Cover Crop Economics: Opportunities to Improve Your Bottom Line in Row Cropsresponse to the number of years that covercrops were planted in a field. This is presumably a reflection of improvements insoil health.Creating a Baseline forCover Crop Costs andReturnsTable 3 shows the typical costs of seedingcover crops. Some farmers are able to buycover crops for as little as 5– 10 an acre ifthey are using common cereals such as oats,wheat or rye, and especially if the seed isavailable locally with no shipping costs orhas been grown by the farmer. At the otherend of the spectrum, for complex mixesthat include pricier legumes, it is possible tospend as much as 50 per acre on cover cropseed. However, this is not typical amonggrain farmers when planting cover crops onlarge acreages. (Expensive cover crop mixeswith legumes are more common on organicfarms and vegetable farms.)Likewise, the cost of seeding cover cropscan really vary. If someone is hiring covercrop seed spreading, an aerial applicatormay charge 12– 18 per acre, while a fertilizer dealer might charge 8– 15 per acre. Ifthe seed is broadcast with a fall fertilizerwww.SARE.org
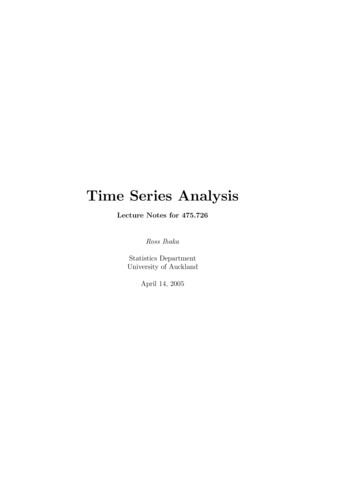
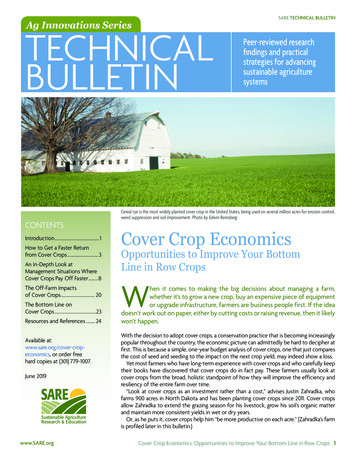
SARE TECHNICAL BULLETINA cover crop interseeder can broadcast several hundred acres of cover crop seed in a day, allowing ag retailers and farmers to get cover crop seed established efficiently and early in the fall. Photo by Rob Myers, North Central SAREapplication, the cost of seeding is basicallycovered as part of the fertilization cost.If cover crop seeding is done using thefarmer’s own equipment, the cost will depend on the width of seeding equipmentand whether it is done as a separate tripover the field or combined with anotherfield operation. A small 10-foot drill mighthave an operation cost of over 10 per acrewhen labor is included, while operating a40-foot row crop planter will likely cost under 10 per acre. If broadcasting cover cropseed and lightly incorporating it with a vertical till tool, there is no extra labor or fuelcost since the vertical tillage is done anyway. However, there would be a one-timecost for modifying the tillage tool with anair seeder, which might amortize to 4– 5per acre depending on the amount of use.In short, it is possible to buy and seed covercrops for as little as 10– 15 per acre, or tospend three to four times that amount.The national SARE/CTIC survey showeda median seeding cost of 25 per acre in2012. Although seed costs for some covercrop species have declined since 2012, thatfigure will be used for the analysis reported on here. The same survey had farmersreporting a median seeding cost of 12 peracre if they hired it out, making a totalcost of 37 per acre for seeds and seeding.If the cover crop overwinters and needsto be terminated in spring, that can add anextra cost of 10– 12, but for this analysisit is assumed that a burndown spring herbicide application is being made anyway,since this is a common practice amongcorn and soybean farmers.To better show how the economics ofcover crops change with improvementsin soil health and under special situations,www.SARE.orgtables 4 and 5 on corn and soybeans (respectively) were compiled from a varietyof data sources. (See table footnotes.) Thenumbers are based on a combination ofSARE/CTIC survey data, published inputprices, research data and analysis by the authors of this bulletin. Prices shown are fromspring 2019 unless otherwise noted. Whereestimates were made on a few of the numbers, the goal was to be as realistic as possible based on reported farmer experiences.Some farmers report higher cost savings orgreater yield increases than what is shown,but for the majority of situations, tables 4and 5 should give an idea of approximatereturns on typical corn and soybean farms.Similar tables could be built for othersummer annual crops that might be rotatedwith cover crops, such as cotton, sorghumor sunflowers, but less farm-based data iscurrently available on the yield impact ofcover crops with other commodities. Theauthors did not attempt to do an analysisof cover crop economics for vegetables,fruits or other specialty crops but expecta similar pattern of increasing economicreturn would be found as soil health improves over time.Tables 4 and 5 show the impact of covercrops on farm profitability under each ofthe seven situations outlined in the previous section. An important thing to keepin mind when reviewing the tables is thatwhile some farmers will have none of theseven special situations that apply to them,others will have more than one. For example, they may be grazing a cover crop whilealso cutting back on their use of fertilizer, orthey may be getting an incentive paymentwhile at the same time addressing a compaction issue. Thus, there is an opportunityto gain even more net profit by combiningstrategies or by addressing more than oneyield-limiting factor in a field through useof cover crops. Again, this becomes especially true as soil health improves over time.Another consideration is that tables 4and 5 present information on corn andsoybeans separately. Farmers are encouraged to look at their overall system andthink about how cover crops fit into theircrop rotations. For example, some farmers have gone back to adding a small graininto their rotation with corn and soybeans.If the small grain is winter wheat, it maybe possible to either double crop beansor plant a cover crop “cocktail” mix afterwheat harvest. Then the cover crop mix canbe grazed in early fall and possibly again inlate fall and/or spring, depending on thebalance of warm season annuals and coolseason annuals in the cover crop mix. Sucha system may provide faster soil healthbenefits as well as a nice income from thegrazing, but of course it depends on havingaccess to grazing animals.Finally, the details about how the economic assumptions were established foreach cover cropping situation are capturedin the table footnotes. Each farmer’s experience with cover crops will vary based ontheir particular situation. Readers are encouraged to substitute their own local conditions and numbers to evaluate the potential return from cover crops over time.TABLE 3. Cost of seeding cover cropsITEMCOST PER ACRECover crop seed 10– 50Seeding the cover crops 5– 18Termination 0– 10Subtotal range 15– 78Median cost from survey 37Cover Crop Economics: Opportunities to Improve Your Bottom Line in Row Crops 5
SARE TECHNICAL BULLETINTABLE 4. Impact of cover crops on costs, returns and net profit for corn following one, three and five years of cover cropuse and with various management scenariosBUDGET ITEMYEARS OF COVER CROPPINGAll figures are per acreOneThreeFiveEstimated input savings when using cover cropsFertilizer1 0 14.10 21.902 0– 15 10– 25 10– 253 2– 4 2– 4 2– 4 2– 19 26.10– 43.10 33.90– 50.90 2 26.10 33.90 3.64 12.32 21 37 37 37- 31.36 1.42 17.90 27 27 27- 4.36 28.42 44.90II. Potential grazing income 49.23 49.23 49.23Adjusted net return 17.87 50.65 67.13 15.30 15.30 15.30- 16.06 16.72 33.20 23.96 23.96 23.96- 7.40 25.38 41.86 58.70 75.73 92.55 27.34 77.15 110.45 15.20 15.20 15.20- 16.16 16.62 33.10 50 50 50 18.64 51.42 67.90Weed controlErosion repairSubtotala. Savings on inputs (the low end of the subtotal range from above)b. Income from extra yield in normal weather year (survey data)4c. Cost of seed and seeding (survey data)5Net return in a normal weather year (a b - c)Special situations where cover crops can pay off fasterI. When facing severe herbicide-resistant weeds6Adjusted net return7III. Compaction addressed by cover crops8Adjusted net returnIV. Assisting the conversion to no-till from conventional9Adjusted net returnV. Income from extra yield in a drought year (survey data)10Adjusted net returnVI. Extra fertilizer savings from improved fertility11Adjusted net returnVII. Federal or state incentive payments received12Adjusted net return123456789101112Assumes no fertilizer savings in year one, then a savings of 15 pounds of nitrogen per acre in year three and 30 pounds per acre in year five, at 0.38 per pound. Also assumes aphosphorus saving of 20 pounds per acre in year three and 25 pounds per acre in year five, at 0.42 per pound.The first year assumes a reduction of one herbicide pass if sufficient cover crop biomass is achieved. Savings are higher in later years due to reducing by two passes or by using lessexpensive herbicide products.Based on the cost of machinery operations and labor to repair gullies and clean ditches (assumes average cost, but fields will vary).Assumes a corn price of 3.50 per bushel and a 200-bushel yield times the percent yield increases shown in Table 2.Costs for seed, seeding and termination can vary from a low of about 10 to over 50 per acre; most farms estimated to be 25– 40 per acre.In a field with a severe herbicide-resistant weed infestation, this figure assumes that a thick-biomass cover crop will reduce herbicide and labor costs and will reduce dockage forweed seed at harvest.Assumes that grazing a cover crop (cereal rye in this example) results in a reduction of 1,093 pounds of hay fed per acre of cover crops. This is based on 1,500 pounds per acre ofdry matter generated by rye, then reduced effective use of the rye by 50% due to hoof action and selective grazing. Assumes average feedlot waste of 22% for hay fed (88% drymatter). The hay is valued at 80 per ton. Additional savings of approximately 5.50 per acre generated due to lower labor, fuel and machinery depreciation from reduced hay fed.Assumes grazer already has water access for their grazing area and an electric fencing system.This is based on a University of Minnesota machinery cost estimate for subsoiling at 15.30 per acre (2017 data used for machinery costs).No-till savings versus conventional: No fall chisel plow ( 11.22 per acre) and savings on two field cultivator passes in the spring (2 x 6.37 per acre).Assumes a corn price in drought of 6.89 per bushel and reduced base yield of 142 bushels per acre x percent yield increase for drought. Numbers are based on actual national average corn yield for 2012 and national average corn price in the 2012–13 marketing year (USDA-NASS).Assumes using legumes as a cover crop and that overall improved soil health allow nitrogen to be cut by an extra 40 pounds per acre over basic fertilizer savings.The basic NRCS EQIP rate in the majority of Corn Belt states starts at 50 per acre or higher; some states have lower rates.6 Cover Crop Economics: Opportunities to Improve Your Bottom Line in Row Cropswww.SARE.org
SARE TECHNICAL BULLETINTABLE 5. Impact of cover crops on costs, returns and net profit for soybeans following one, three, and five years of covercrop use and with various management scenariosBUDGET ITEMYEARS OF COVER CROPPINGAll figures are per acreOneThreeFiveEstimated input savings when using cover cropsFertilizer1Weed control2 0 6.30 8.40 0– 15 10– 25 10– 25Erosion repair 2– 4 2– 4 2– 4Subtotal 2- 19 18.30- 35.30 20.40- 37.40 2 18.30 20.40 11.45 19.12 26.78 37 37 37- 23.55 0.42 10.183a. Savings on inputs (the low end of the range from above)b. Income from extra yield in normal weather year (survey data)4c. Cost of seed and seeding (survey data)5Net return in a normal weather year (a b - c)Special situations where cover crops can pay off fasterI. When facing severe herbicide-resistant weeds6 27 27 27Adjusted net return 3.45 27.42 37.18II. Potential grazing income7 49.23 49.23 49.23 25.68 49.65 59.41 15.30 15.30 15.30Adjusted net returnIII. Compaction addressed by cover crops8Adjusted net returnIV. Assisting the conversion to no-till from conventional9Adjusted net returnV. Income from extra yield in a drought year (survey data)10Adjusted net returnVI. Extra fertilizer savings from improved fertility11Adjusted net returnVII. Federal or state incentive payments receivedAdjusted net return12345678910111212- 8.25 15.72 25.48 23.96 23.96 23.96 0.41 24.38 34.14 65.24 69.80 74.36 41.69 70.22 84.54 7 7 7- 16.55 7.42 17.18 50 50 50 26.45 50.42 60.18Assumes no fertilizer savings in year one, then a savings of 15 pounds of phosphorus per acre in year three and 20 pounds per acre in year five, at 0.42 per pound.The first year assumes either no herbicide savings or a possible saving of 15 per acre by avoiding a fall herbicide pass ( 7.50 per acre for the chemical and 7.50 per acre for application). The third and fifth years assume using a less expensive residual chemistry that costs 10 per acre, with the possibility of saving 15 per acre in the fall.Based on the cost of machinery operations and labor to repair gullies and clean ditches (assumes average cost, but fields will vary).Assumes a soybean price of 9 per bushel and a 60-bushel yield times the percent yield increases shown in Table 2.Costs for seed, seeding and termination can vary from a low of about 10 to over 50 per acre; most farms estimated to be 25– 40 per acre.In a field with a severe herbicide-resistant weed infestation, this figure assumes that a thick-biomass cover crop will reduce herbicide and labor costs and will reduce dockage forweed seed at harvest.Assumes that grazing a cover crop (cereal rye in this example) results in a reduction of 1,093 pounds of hay fed per acre of cover crops. This is based on 1,500 pounds per acre ofdry matter generated by rye, then reduced effective use of the rye by 50% due to hoof action and selective grazing. Assumes average feedlot waste of 22% for hay fed (88% drymatter). The hay is valued at 80 per ton. Additional savings of approximately 5.50 per acre generated due to lower labor, fuel and machinery depreciation from reduced hay fed.Assumes grazer already has water access for their grazing area and an electric fencing system.This is based on a University of Minnesota machinery cost estimate for subsoiling at 15.30 per acre (2017 data used for machinery costs).No-till savings versus conventional: No fall chisel plow ( 11.22 per acre) and savings on two field cultivator passes in the spring (2 x 6.37 per acre).Assumes a soybean price in drought of 14.40 per bushel and reduced yield of 39.6 bushels per acre x percent yield increase for drought. Numbers are based on actual nationalaverage soybean yield for 2012 and national average price in the 2012-13 marketing year (USDA-NASS).Assumes that overall improved soil health allows an additional reduction in phosphorus of 10 pounds per acre ( 0.42 per pound) and 10 pounds per acre of potassium ( 0.28 perpound) over basic fertilizer savings.The basic NRCS EQIP rate in the majority of Corn Belt states starts at 50 per acre or higher; some states have lower rates.www.SARE.orgCover Crop Economics: Opportunities to Improve Your Bottom Line in Row Crops 7
SARE TECHNICAL BULLETINAn In-Depth Look at Management SituationsWhere Cover Crops Pay Off FasterAs outlined earlier, there are several different management situations where cover crops pay off faster than usual.Generally, these faster returns occur where farmers are either addressing a specific problem such as herbicideresistant weeds or soil compaction, and/or where they are seizing opportunities in other aspects of their cropand soil management in order to be more economically efficient overall.For example, Alabama farmer Annie Deehas been combining cover crops with otherconservation practices for many years because of the multiple cost-saving benefitsshe sees. “If we get a big rain, the covercrops help keep soil from washing away,”says Dee, who farms 4,000 acres of cornand soybeans, with another 3,500 acres offorages and cattle pasture. “They also helpbuild up the fertility of the soil and keepthe weeds down.”By using the baseline numbers on covercrops from the preceding section and thenadding in the economic impact of thesevarious management scenarios, a morespecific set of economic numbers can begenerated. These management-specificnumbers are summarized in the “Snapshot”sections at the end of each managementsection. The intent here is to help producers identify those profitability factors thatare relevant to their own farms.When looking at the management situations that follow, producers or farmer advisors should keep in mind their goals for thecover crops they plan to use on each field,such as helping with compaction (Figure 1).This can help guide their selection of covercrops, help set realistic expectations on potential returns and help suggest what othermanagement changes might be needed toimprove overall efficiency.1. When HerbicideResistant Weeds are aProblemIn the 2016–17 National Cover Crop Survey,59% of farmers reported having herbicideresistant weeds on some of their fields, andthat percentage is expected to continuerising. Due to the rapid spread of herbicideresistant marestail, Palmer amaranth andwaterhemp, along with other herbicide-resistant weeds, farmers are having to spendmore on herbicides while often gettingFIGURE 1: The many benefits of cover cropsThe many benefits that cover crops provide contribute to increasing yield response and lower input costs over time.Illustration by Carlyn Iversonworse results. In some situations, entirecrop fields have been abandoned to weeds,particularly in the South. Even where partial control of these challenging weeds isobtained, yield losses occur and the cropdelivered to the grain elevator may bedocked substantially in price for weed seedcontamination. This problem is only goingto get worse in many areas. For example, aweed scientist from Southern Illinois University recently rep
4 Cover Crop Economics: Opportunities to Improve Your Bottom Line in Row Crops www.SARE.org SARE TECHNICAL BULLETIN a few fields having yield losses after cover crops and with some fields showing no dif-ference. Many farmers reported a yield in-crease on their fields, but ind