Transcription
MUNICIPALWASTEWATERTREATMENTCANADIAN ENVIRONMENTALSUSTAINABILITY INDICATORS
Suggested citation for this document: Environment and Climate Change Canada (2020) CanadianEnvironmental Sustainability Indicators: Municipal wastewater treatment. Consulted on Month day, year.Available at: eatment.html.Cat. No.: En4-144/8-2020E-PDFISBN: 978-0-660-36892-4Unless otherwise specified, you may not reproduce materials in this publication, in whole or in part, for thepurposes of commercial redistribution without prior written permission from Environment and Climate ChangeCanada's copyright administrator. To obtain permission to reproduce Government of Canada materials forcommercial purposes, apply for Crown Copyright Clearance by contacting:Environment and Climate Change CanadaPublic Inquiries Centre12th Floor Fontaine Building200 Sacré-Coeur BlvdGatineau QC K1A 0H3Telephone: 1-800-668-6767 (in Canada only) or 819-938-3860Fax: 819-938-3318Email: ec.enviroinfo.ec@canada.caPhotos: Environment and Climate Change Canada Her Majesty the Queen in Right of Canada, represented by the Minister of Environment and Climate Change,2020Aussi disponible en françaisMunicipal wastewater treatmentPage 2 of 19
CANADIAN ENVIRONMENTALSUSTAINABILITY INDICATORSMUNICIPAL WASTEWATERTREATMENTDecember 2020Table of contentsMunicipal wastewater treatment. 5Population served by municipal wastewater systems . 5Key results . 5Population served by municipal wastewater systems by province and territory. 7Key results . 7Population served by municipal wastewater systems in selected countries . 8Key results . 8Municipal wastewater volume discharged by treatment category . 9Key results . 9Municipal wastewater volume discharged by treatment category by province and territory . 10Key results . 10About the indicators . 11What the indicators measure . 11Why these indicators are important. 11Related indicators . 11Data sources and methods . 11Data sources . 11Methods . 12Recent changes . 14Caveats and limitations. 14Resources . 14References . 14Canadian Environmental Sustainability IndicatorsPage 3 of 19
Related information. 15Annex . 16Annex A. Data tables for the figures presented in this document. 16List of FiguresFigure 1. Proportion of population served by municipal wastewater systems, Canada, 2013 to 2017 . 5Figure 2. Proportion of population served by municipal wastewater systems by province and territory, Canada,2017 . 7Figure 3. Proportion of population served by municipal wastewater systems, selected countries, 2017. 8Figure 4. Proportion of municipal wastewater volume discharged by treatment category, Canada, 2013 to 2017. 9Figure 5. Volume and proportion of municipal wastewater discharged by treatment category by province andterritory, Canada, 2017 . 10List of TablesTable 1. Description of wastewater treatment category. 12Table A.1. Data for Figure 1. Proportion of population served by municipal wastewater systems, Canada, 2013to 2017. 16Table A.2. Data for Figure 2. Proportion of population served by municipal wastewater systems by provinceand territory, Canada, 2017 . 16Table A.3. Data for Figure 3. Proportion of population served by municipal wastewater systems, selectedcountries, 2017 . 17Table A.4. Data for Figure 4. Proportion of municipal wastewater volume discharged by treatment category,Canada, 2013 to 2017 . 17Table A.5. Data for Figure 5. Volume and proportion of municipal wastewater discharged by treatmentcategory by province and territory, Canada, 2017. 18Municipal wastewater treatmentPage 4 of 19
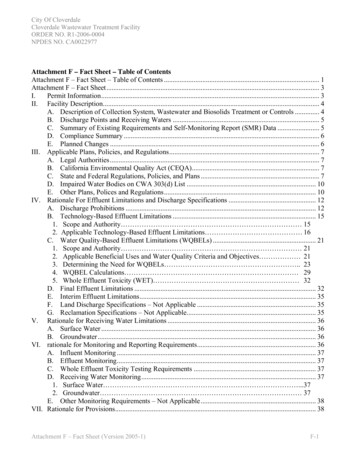
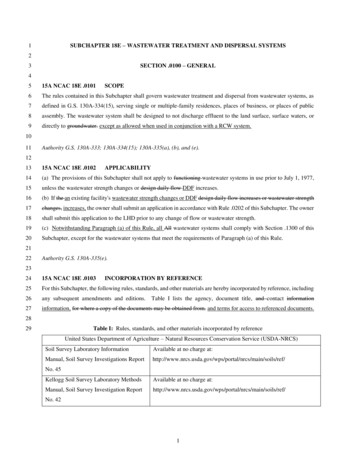
Municipal wastewater treatmentEvery day, millions of cubic metres of wastewater are discharged from homes, businesses, institutions andindustries into city sewer systems. Municipal wastewater is one of the largest sources of pollution to surface waterin Canada. Before being released to the environment, wastewater needs to be treated. A higher level ofwastewater treatment leads to a cleaner effluent and a smaller impact on the environment. The indicators showthe level of wastewater treatment provided to the Canadian population.Population served by municipal wastewater systemsKey results Over the 2013 to 2017 period, the proportion of the population served by municipal wastewater systemsremained stable at 86%Since 2013, the proportion of population served by each treatment category remained stable:o Around 28%, 43% and 14% for tertiary, secondary and primary treatments, respectivelyo Around 2% of the population was served by systems discharging untreated wastewaterIn 2017, 14% of the population was not served by municipal wastewater systems1Figure 1. Proportion of population served by municipal wastewater systems, Canada, 2013 to 2017Data for Figure 1Note: Only the population served by municipal wastewater systems with a daily flow of 100 cubic metres or more was considered. Data wereunavailable for the populations located in the Northwest Territories, Nunavut and north of the 54th parallel in the provinces of Quebec andNewfoundland and Labrador.Source: Statistics Canada (2020) Table 38-10-0125-01 Population served by municipal wastewater systems by treatment category andStatistics Canada (2017) Population and dwelling count highlight tables. 2016 census.1The population not served by municipal wastewater systems corresponds to the population that either had their own on-site wastewatersystem (such as septic systems) or were served by other systems with daily flows of less than 100 cubic metres per day, or by other facilitiesoutside the scope of the surveys.Canadian Environmental Sustainability IndicatorsPage 5 of 19
Municipal wastewater refers to used water from homes, businesses, industries and institutions that drain intosewers. It contains sanitary sewage and is sometimes combined with stormwater from rain or melting snowdraining off rooftops, lawns, parking lots and roads. Municipal wastewater can contain human and other organicwaste, nutrients, pathogens, microorganisms, suspended solids and household and industrial chemicals. Treatingwastewater before it is released into lakes and rivers reduces the risks posed to human health and theenvironment. 2The treatment processes presented in Figure 1 can be summarized as follows: No treatment: No treatment process or only screening and/or grit removalPrimary treatment: Removing a portion of suspended solids and organic matter by physical and/orchemical processesSecondary treatment: Removing organic matter and suspended solids using biological treatmentprocesses and secondary settlementTertiary treatment: Removing specific substances of concern (solids, nutrients and/or contaminants) aftersecondary treatment using a number of physical, chemical or biological processesA variety of factors, including Canada's physical geography and population density influence the proportion ofpopulation served by municipal sewers. For example, communities where population is spread over a largegeographical area are challenged when it comes to providing centralized infrastructures to collect and treatwastewater. Those communities tend to rely on independent systems, such as septic systems, or small scalecollective systems. In this indicator, their populations would be considered as "not served" by municipalwastewater systems. The efficiency of those treatment systems can be similar to larger municipal wastewatersystems.2Canadian Council of Ministers of the Environment (2020) Municipal Wastewater Effluent Strategy. Retrieved on 7 August, 2020.Municipal wastewater treatmentPage 6 of 19
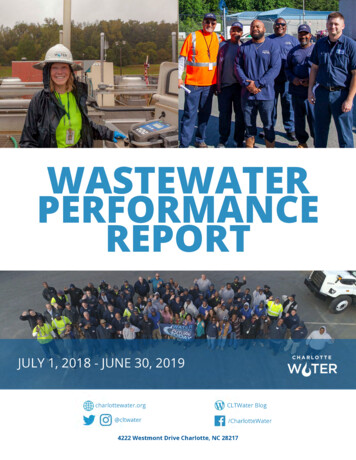
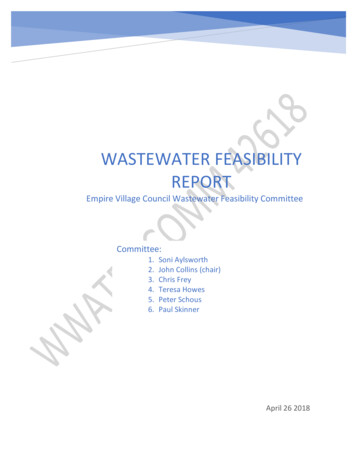
Population served by municipal wastewater systems by province andterritoryKey resultsIn 2017, The proportion of population served by municipal wastewater systems varied from 54% in Prince EdwardIsland to 90% in British Columbia3Alberta had the highest proportion of population (70%) served by tertiary-level wastewater treatmentNova Scotia had the highest proportion of population (35%) served by primary-level wastewater treatmentA significant proportion of the Newfoundland and Labrador population (33%) was served by municipalsystems that discharge wastewater to the environment with no prior treatmentFigure 2. Proportion of population served by municipal wastewater systems by province and territory,Canada, 2017Data for Figure 2Note: Only the population served by municipal wastewater systems with a daily flow of 100 cubic metres or more was considered. Data wereunavailable for the populations located in the Northwest Territories, Nunavut and north of the 54th parallel in the provinces of Quebec andNewfoundland and Labrador.Source: Statistics Canada (2020) Table 38-10-0125-01 Population served by municipal wastewater systems by treatment category andStatistics Canada (2017) Population and dwelling count highlight tables. 2016 census.Much of the Canadian population is served by wastewater collection and treatment systems; however, theproportion of population served and the level of treatment applied to wastewater varies widely by province andterritory. The majority of systems that discharge untreated wastewater are located in coastal communities. Inlandprovinces tend to have higher levels of treatment in order to protect freshwater resources.3The population not served by municipal wastewater systems corresponds to the population that either had their own on-site wastewatersystem or were served by other systems with daily flows of less than 100 cubic metres per day, or by other facilities outside the scope of thesurveys.Canadian Environmental Sustainability IndicatorsPage 7 of 19
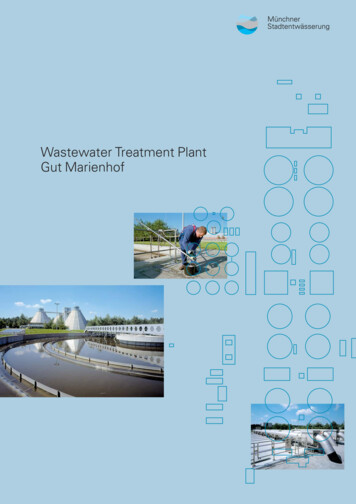
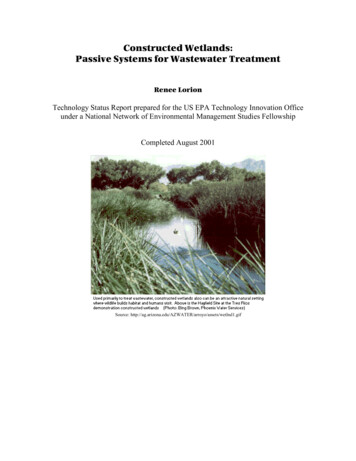
Population served by municipal wastewater systems in selected countriesThis indicator compares the proportion of the population served by municipal wastewater systems in Canada withthe 24 countries from the Organisation for Economic Co-operation and Development for which data wereavailable for the year 2017.Key resultsIn 2017: Canada ranked 12th out of 24 countries for proportion of population served by municipal wastewatersystems at 86%4,5Luxembourg and Chile reported that 100% of their population was served by a municipal wastewatersystem38% to 99% of the population from the selected countries were served by a municipal wastewater systemusing a tertiary treatment, which is more than in Canada (28%)Figure 3. Proportion of population served by municipal wastewater systems, selected countries, 2017Data for Figure 3Note: The graph shows the 12 member countries from the Organisation for Economic Co-operation and Development with the highestproportion of population served by public sewerage systems in 2017. The year 2017 was the most recent year for which data was available forCanada in the Organisation for Economic Co-operation and Development's database. For Canada, only the population served by municipalwastewater systems with a daily flow of 100 cubic metres or more was considered.Source: Organisation for Economic Co-operation and Development (2020) Wastewater treatment database.4For Canada, the population not served by municipal wastewater systems corresponds to the population that either had their own on-sitewastewater system or were served by other systems with daily flows o f less than 100 cubic metres per day, or by other facilities outside thescope of the surveys.5Canada's proportion of the population served by municipal wastewater systems differs from the data presented in in the national indicatorbecause different population estimates were used. For more information, please consult th e Caveats and limitations section.Municipal wastewater treatmentPage 8 of 19
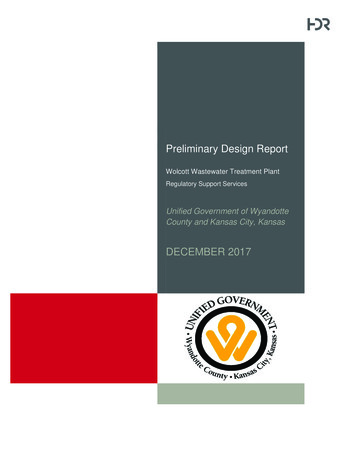
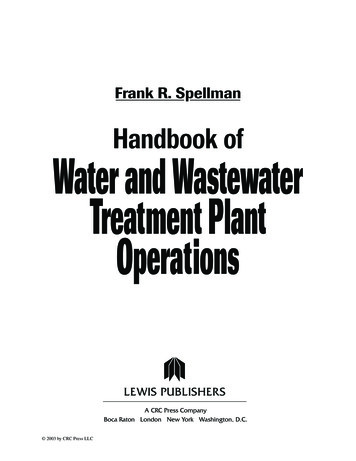
The countries with the highest proportion of population connected by treatment category were: Chile for the primary treatment with 27%Portugal for the secondary treatment with 47%the Netherlands for the tertiary treatment with 99%After Australia, Canada has the lowest population density among the selected countries and one of the lowestproportion of urban population.6 These factors could have an influence on the development of centralizedwastewater treatment infrastructures.Municipal wastewater volume discharged by treatment categoryKey results Over the 2013 to 2017 period, 95.3% to 96.0% of the municipal wastewater collected underwent atreatment (primary, secondary or tertiary) before being dischargedIn 2017, 4.4% of the volume of municipal wastewater discharged was untreated 7Figure 4. Proportion of municipal wastewater volume discharged by treatment category, Canada, 2013 to2017Data for Figure 4Note: Combined sewer overflows correspond to the stormwater and wastewater conveyed into a combined sewer that are discharged directlyinto receiving waters because they exceed the capacity of the sewer system or treatment plant. Data were unavailable for the sewer systemslocated in the Northwest Territories, Nunavut and north of the 54th parallel in the provinces of Quebec and Newfoundland and Labrador.Source: Statistics Canada (2020) Table 38-10-0124-01 Wastewater volumes discharged from municipal sewage systems by treatmentcategory (x 1,000,000) and Table 38-10-0100-01 Combined sewer overflow discharge volumes (x 1,000,000).Between 2013 and 2017, the volume of municipal wastewater discharged remained relatively stable, ranging from5 689 million cubic metres to 6 074 million cubic metres.6World Bank (2020) World Development Indicators. Retrieved on August 4, 2020.7The wastewater considered untreated includes combined sewer overflows. Combined sewer overflows correspond to the stormwater andwastewater conveyed into a combined sewer that are discharged directly into receiving waters because they exceed the capacity of the sewersystem or treatment plant.Canadian Environmental Sustainability IndicatorsPage 9 of 19
In 2017, the volume of municipal wastewater discharged with no treatment was 270 million cubic metres,corresponding to 4.4% of the total volume discharged. This includes 164 million cubic metres from combinedsewer overflows. In 2016, the volume of untreated wastewater discharged amounted to 233 million cubic metres(including 134 million cubic metres from combined sewer overflows), or 4.0% of the total volume conveyed bymunicipal wastewater systems in Canada.Municipal wastewater volume discharged by treatment category byprovince and territoryKey resultsIn 2017: Quebec and Ontario accounted for the majority of wastewater discharged nationally, with respectivevolumes of 2 227 and 2 082 million cubic metresMunicipal wastewater was almost entirely treated at secondary or tertiary levels in Alberta, Ontario, PrinceEdward Island, Saskatchewan, Yukon, and, to a lesser extent, ManitobaMunicipal wastewater in Newfoundland and Labrador, Nova Scotia, and Quebec were mostly, at best,treated at a primary levelFigure 5. Volume and proportion of municipal wastewater discharged by treatment category by provinceand territory, Canada, 2017Data for Figure 5Note: Combined sewer overflows correspond to the stormwater and wastewater conveyed into a combined sewer that are discharged directlyinto receiving waters because they exceed the capacity of the sewer system or treatment plant. Data were unavailable for the sewer systemslocated in the Northwest Territories, Nunavut and north of the 54th parallel in the provinces of Quebec and Newfoundland and Labrador.Source: Statistics Canada (2020) Table 38-10-0124-01 Wastewater volumes discharged from municipal sewage systems by treatmentcategory (x 1,000,000) and Table 38-10-0100-01 Combined sewer overflow discharge volumes (x 1,000,000).The level of treatment applied to wastewater varies widely by province and territory. In 2017, the provinces andterritory with the highest proportion of wastewater discharged by treatment category were: Newfoundland and Labrador for untreated wastewater with 37%Quebec for primary treatment, with 50%Yukon for secondary treatment, with 100%Alberta for tertiary treatment, with 81%Municipal wastewater treatmentPage 10 of 19
About the indicatorsWhat the indicators measureThe Municipal wastewater treatment indicators measure the level of wastewater treatment provided to theCanadian population. Higher treatment levels of wastewater reduce the risk of raw wastewater pollutants enteringthe environment, where they pose risks to human health and the environment. These indicators are not ameasure of municipalities' compliance with municipal, provincial, territorial or federal wastewater regulations ortreatment standards.Why these indicators are importantMunicipal wastewater is one of the largest sources of pollution, by volume, to surface water in Canada. 8 Despitetreatment, pollutants remain in treated wastewater discharged into surface waters. Treated wastewater maycontain grit, debris, biological wastes, disease-causing bacteria, nutrients, and hundreds of chemicals such asthose found in drugs and in personal care products like shampoo and cosmetics. The higher the level of treatmentprovided by a wastewater system, the cleaner the effluent and the lesser the impact on the effluent receivingenvironment.Insufficient wastewater treatment could result in environmental, human health and economic impacts, such asoxygen depletion, beach closures and other restrictions on recreational water use, on fish and shellfish harvestingand consumption and on drinking water.Pristine lakes and riversThese indicators support the measurement of progress towards the following 2019 to 2022 Federal SustainableDevelopment Strategy long-term goal: Clean and healthy lakes and rivers support economic prosperity and thewell-being of Canadians.In addition, the indicators contribute to the Sustainable Development Goals of the 2030 Agenda for SustainableDevelopment. They are linked to Goal 6, Clean water and sanitation, and Target 6.3, "By 2030, improve waterquality by reducing pollution, eliminating dumping and minimizing release of hazardous chemicals and materials,halving the proportion of untreated wastewater and substantially increasing recycling and safe reuse globally."Related indicatorsThe Water quality in Canadian rivers indicators provide a measure of the ability of river water across Canada tosupport plants and animals.The Metal and diamond mining effluent quality indicator summarizes the results achieved since the Metal andDiamond Mining Effluent Regulations came into effect in 2002.The Pulp and paper effluent quality indicator summarizes the degree of compliance achieved since 1985 underthe Pulp and Paper Effluent Regulations.Data sources and methodsData sourcesData for 2013 to 2017 come from Statistics Canada's Municipal Wastewater Systems in Canada statisticalprogram.8Government of Canada (2012) Wastewater Systems Effluent Regulations. Retrieved on November 3, 2020.Canadian Environmental Sustainability IndicatorsPage 11 of 19
The 2017 data for the international comparison of population served by municipal wastewater systems indicatorwere retrieved from the Organisation for Economic Co-operation and Development's Wastewater treatmentdatabase.More informationSpatial coverageThe Municipal Wastewater Systems in Canada statistical program captures data from all the wastewatersystems that collect a daily average volume of 100 cubic metres or more. These estimates excludesystems that service First Nations reserves, government institutions, commercial and industrialestablishments, and provincial parks.Temporal coverageThe Municipal Wastewater Systems in Canada was published for the first time in 2019 and presented thedata for the years 2013 to 2017. It will be updated annually.Data completenessThe Municipal Wastewater Systems in Canada lists approximately 2 000 wastewater (sewage) systemsserving communities with a daily flow of 100 cubic metres or more. This list is established from owners ofwastewater systems that report under the federal Wastewater Systems Effluent Regulations. Othersystems not reporting under these regulations, such as those in northern regions under an equivalencyagreement are also considered. In 2017, the listed systems were serving 30 415 372 Canadians.MethodsThe Municipal Wastewater Systems in Canada data are presented under 5 datasets: Population served by municipal wastewater systemsPopulation served by municipal wastewater systems by treatment categoryWastewater volumes processed by municipal sewage systemsWastewater volumes discharged from municipal sewage systems by treatment category, andCombined sewer overflow discharge volumesThe treatment levels are categorized as none, primary, secondary, secondary with additional phosphorousremoval or tertiary treatment.For the purposes of these indicators, the population not served by municipal wastewater systems corresponds tothe population that either had their own on-site wastewater system (such as septic systems) or were served byother systems with daily flows of less than 100 cubic metres per day, or by other facilities outside the scope of thesurveys.In 2012, the Wastewater Systems Effluent Regulations were established under the Fisheries Act and includedmandatory minimum effluent quality standards that can be achieved through secondary wastewater treatment.The regulations apply to wastewater systems that collect an average daily volume of 100 cubic metres or more.More informationWastewater treatment levels for this indicator were categorized based on the definitions used in theMunicipal Wastewater Systems in Canada. 9Table 1. Description of wastewater treatment categoriesTreatment categoryNo treatmentDefinitionNo treatment processes are applied, or only screening and/or grit removal areapplied9Statistics Canada (2019) Municipal Wastewater Systems in Canada and Statistics Canada (2020) Table 38-10-0124-01 Wastewatervolumes discharged from municipal sewage systems by treatment category (x 1,000,000).Municipal wastewater treatmentPage 12 of 19
Treatment categoryDefinitionPrimary treatmentPrimary treatment removes a portion of suspended solids and organic matterby physical and/or chemical processes. At least 1 of the following processes isapplied: Chemical flocculation Primary sedimentation/clarification SkimmingSecondary treatmentSecondary treatment removes biodegradable organic matter and suspendedsolids using biological treatment processes and secondary settlement. At least1 of the following processes is applied: Activated sludge system (with or without extended aeration) Activated sludge system (with or without pure oxygen) Lagoon systems (any one or combination of aerated, aerobic, anaerobic,facultative, non-aerated, non-aerated filtered) Oxidation ditch Rotating biological contactor Storage ponds (polishing ponds) Sequencing batch reactor Trickling filter Integrated systems that combine the above technologies Chemical precipitation for phosphorusTertiary treatmentTertiary treatment further removes residual suspended solids, nutrients and/orother contaminants using various physical, chemical or biological processes. Atleast 1 of the following processes is applied in addition of secondary treatmentprocesses: Biofiltration Biological ammonia removal – nitrification only Biological nitrogen removal – nitrification and denitrification Biological nutrient removal (nitrogen and phosphorus) Biological phosphorus removal Filtration Peat filter Integrated systems that combine the above technologies with secondarytreatment technologies, or some systems that only apply tertiarytechnologiesThe data were derived from administrative records collected by Environment and Climate ChangeCanada via the Effluent Regulatory Reporting Information System, as required by the WastewaterSystems Effluent Regulations. Those records provide information on each sewage system, including thevolume of wastewater discharged and the treatment-level. The population served by each sewage systemwas estimated using census population data. The regulations do not apply to any wastewater systemlocated in the Northwest Territories, Nunavut and north of the 54th parallel in the provinces of Quebecand Newfoundland and Labrador; therefore, no data were available for these populations.The percentages of population served by municipal wastewater systems at the national and provincialand territorial levels were calculated using the population served by municipal wastewater systems bytreatment category data which was developed based on the 2011 and 2016 census of population. Thepopulation for 2017 was extrapolated using the 2016 census data. The same process applies for thecalculation of the national, and provincial and territorial proportions of municipal wastewater dischargedby treatment category. The volume of wastewater discharged for each treatment category, as establishedCanadian Environmental Sustainability IndicatorsPage 13 of 19
by the Municipal Wastewater Systems in Canada statistical program, was divided by the total volume ofwastewater discharged. For the purposes of these indicators, the volumes corresponding to the combinedsewer overflows were added to the total volume of wastewater and were considered as untreated water.Recent changesThe indicators cover the years 2013 to 2017 and do not include data from previous years. The methodology usedby the Municipal Wastewater Systems in Canada differs from the previous surveys, making the data not directlycomparable.Two (2) new indicators on the population served by municipal wastewater treatment systems were added toprovide comparisons by treatment category at the provincial and territorial level and at the international level. Two(2) additional indicators were added to provide information on the volume of wastewater being treated bytreatment category at the national level and at the provincial and territorial level.Caveats and limitationsThe Municipal Wastewater Systems in Canada statistical program excludes communities that have their own onsite wastewater system, or that are served by other systems with daily flows of less than 100 cubic metres per dayor by other facilities outside the scope of the survey. The Wastewater Systems Effluent Regulations do not applyto any wastewater system located in the Northwest Territories, Nunavut and north of the 54th pa
wastewater treatment leads to a cleaner effluent and a smaller impact on the environment. The indicators show the level of wastewater treatment provided to the Canadian population. Population served by municipal wastewater systems Key results Over the 2013 to 2017 period, the proportion of the population served by municipal wastewater systems