Transcription
Bo et al. BMC Cancer(2021) ESEARCHOpen AccessIntraarterial contrast-enhanced ultrasoundto predict the short-term tumour responseof hepatocellular carcinoma to Transarterialchemoembolization with LipiodolJiang Bo, Han Peng, Zhu LianHua, Fei Xiang* and Luo YuKun*AbstractBackground: Transarterial chemoembolization (TACE) is an effective locoregional therapy in hepatocellularcarcinoma (HCC). However, it is difficult to predict the tumour response (TR) of TACE intraprocedurally. The aim ofthis study was to predict the TR after TACE (1–3 months) in HCC patients using intraprocedural intraarterial contrastenhanced ultrasound (IA-CEUS).Methods: In this case-control study, consecutive patients who received TACE in our hospital from September 2018to May 2019 were enrolled. IA-CEUS was performed before and after TACE. Postoperative contrast-enhanced liverMRI was performed 1–3 months after TACE as the gold standard. According to the modified Response EvaluationCriteria in Solid Tumours (mRECIST), ultrasonic manifestations were compared between the complete remission (CR)group and non-CR group by univariate and multivariate analyses. A logistic predictive model was established andvalidated, and its diagnostic efficiency was evaluated.Results: Forty-four patients with sixty-one lesions were enrolled in the study. Multivariate analysis identified, the riskfactors as a large lesion diameter (OR: 1.84; 95% confidence interval [CI]: 1.009, 3.080; P 0.020), a larger dimensionof non-enhancing area in superior mesenteric artery (SMA)-CEUS than the size in B-mode ultrasound preoperatively(OR: 3.379; 95% CI: 1.346,8.484; P 0.010), presence of corona enhancement in hepatic artery (HA)-CEUSpostoperatively (OR: 6.642; 95% CI: 1.214, 36.331; P 0.029), and decreased corona enhancement thickness (percentimetre) postoperatively (OR: 0.025; 95% CI: 0.006,0.718; P 0.025). The area under the receiver operatingcharacteristic curve (AUROC) of the predictive model was 0.904 (95% CI: 0.804, 0.966; P 0.001). The sensitivity,specificity, accuracy, positive predictive value, and negative predictive value were 81.08, 91.67, 85.25, 93.75, and75.86%, respectively. Leave-one-out cross-validation (LOOCV) showed that the accuracy was 77.05%.Conclusions: Intraprocedural IA-CEUS can be used to predict the TR in HCC patients after TACE.Keywords: Carcinoma, hepatocellular, Ultrasonography, Chemoembolization, therapeutic, Contrast-enhancedultrasound* Correspondence: george301feixiang@163.com; lyk301@163.comDepartment of ultrasound, The First Medical Centre, Chinese PLA GeneralHospital, No. 28 of Fuxing Road, Haidian District, Beijing 100853, China The Author(s). 2021 Open Access This article is licensed under a Creative Commons Attribution 4.0 International License,which permits use, sharing, adaptation, distribution and reproduction in any medium or format, as long as you giveappropriate credit to the original author(s) and the source, provide a link to the Creative Commons licence, and indicate ifchanges were made. The images or other third party material in this article are included in the article's Creative Commonslicence, unless indicated otherwise in a credit line to the material. If material is not included in the article's Creative Commonslicence and your intended use is not permitted by statutory regulation or exceeds the permitted use, you will need to obtainpermission directly from the copyright holder. To view a copy of this licence, visit http://creativecommons.org/licenses/by/4.0/.The Creative Commons Public Domain Dedication waiver ) applies to thedata made available in this article, unless otherwise stated in a credit line to the data.
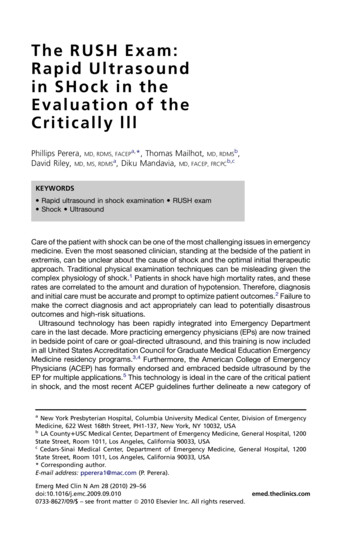
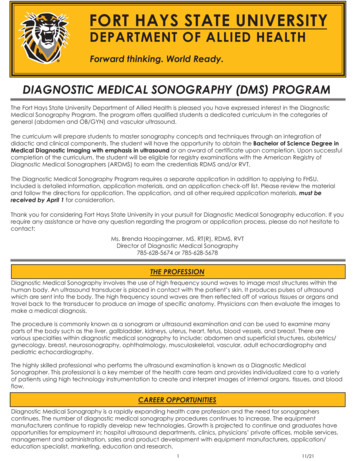
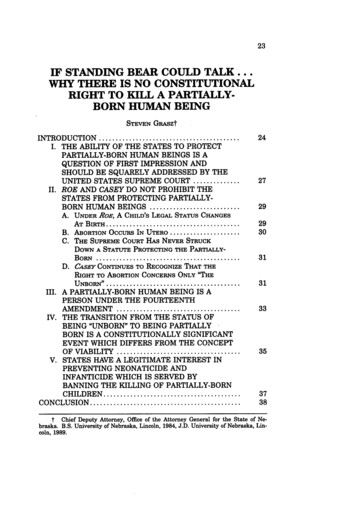
Bo et al. BMC Cancer(2021) 21:1171BackgroundLiver cancer is the sixth most common cancer and thethird most common cause of death. Hepatocellular carcinoma (HCC) accounts for 75–85% of liver cancer [1].Transarterial chemoembolization (TACE) is an effectivelocoregional therapy in unresectable HCC, especially forBarcelona grade B patients [2], with an objective response rate of 43.6–61.5% [3]. Contrast-enhanced MRIcan be performed 1–3 months after TACE to assess thetumour response (TR) based on the modified ResponseEvaluation Criteria in Solid Tumours (mRECIST) guidelines [4–6].The significance of the intraprocedural evaluation andprediction of TR lies in their ability to help to determinethe end-point of TACE, and thus help determine futuretreatment and predict prognosis, which is beneficial topatients [7, 8]. However, it is difficult to obtain satisfactory predictive performance regarding TR using digitalsubstraction angiography (DSA) due to its poor resolution of complex fine vessels [9, 10]. As an alternativemethod, intraoperative cone-beam CT with its higherresolution, has better predictive performance, but a highdensity of lipiodol deposited within tumours may affectthe CT results [11, 12]. In recent years, new imagingmethods, such as MRI with new sequences and PET/CT,have been explored to predict TR [13–16], but they arenot suitable for intraoperative implementation due tothe complexity of the equipment. Therefore, it is imperative to seek an intraoperative method that can beused to accurately predict TR and provide insight regarding TACE endpoints.As a pure blood-pool imaging method, contrastenhanced ultrasound (CEUS) is a highly accuratemethod for displaying tissue microcirculation in realtime, providing higher resolution in the microcirculationthan DSA, CT and MRI [17–19]. It can be performedvia different injection methods, including arterial andperipheral venous routes. Intraarterial contrast-enhancedultrasound (IA-CEUS) can be performed intraprocedurally via catheters inserted into feeder arteries to observethe arterial supply more selectively and directly thanpossible via veins, without interference from the surrounding tissues [20]. IA-CEUS has been used to guideTACE and provide information on necrosis [21], but hasnot been studied with respect to TR prediction. IACEUS has the advantage of demonstrasting arterialblood supply in tumours; intra-hepatic arterial CEUScan only observe the blood supply of the arterial phaseof the tumour, while intra-superior mesenteric arteryCEUS can only observe that of the portal vein, and theinterference between the arterial phase and the portalvein phase is less than that of intravenous CEUS. Wespeculated that IA-CEUS has good performance inevaluating and predicting TR. The aim of this study wasPage 2 of 12to explore the clinical value of IA-CEUS in predictingTR after TACE at 1–3 months.MethodsThis single-centre study was approved by the EthicsCommittee of the Chinese People’s Liberation ArmyGeneral Hospital (Approval No. S2020–427-01). All thepatients provided written informed consent.Study populationConsecutive patients who received TACE treatment atPLA General Hospital from September 2018 to May2019 were enrolled in this study.The inclusion criteria were as follows: (a) the patientmet the diagnostic criteria of the European Associationfor the Study of the Liver [2]; (b) the patient conformedto the TACE treatment indications and successfullycompleted the TACE operation; (c) the tumour that hadnot been treated previously; (d) the tumour that couldbe detected, located and recorded by ultrasound (US) orCEUS in a horizontal position; and (e) the patient had alife expectancy of longer than six months. The exclusioncriteria were as follows: (a) the lesion received treatmentduring follow-up; (b) the patient had uncontrolledhypertension ( 140/90 mm/Hg); heart, respiratory, liveror renal failure or severe bleeding diathesis that couldnot tolerate TACE; (c) the patient had allergies to UScontrast agent; (d) the hepatic artery (HA) and superiormesenteric artery (SMA) originated from the same trunkor extrahepatic arteries supplied the tumour; (e) the lesions were diffuse ( 70% of liver volume); (f) the patienthad portal thrombus or distant metastasis; and (g) thepatients failed to be followed up with contrast-enhancedMRI or the results were not available. The details of patient selection are listed in Fig. 1.The clinical characteristics of the patients, includingsex, age and hepatitis background, were recorded beforeTACE.Conventional TACE procedureAll TACE procedures were performed by two experienced interventional radiologists (with 15 and 5 years ofTACE experience) in a consistent way. After local anaesthesia, the right femoral artery was punctured with themodified Seldinger technique. A 4-Fr arterial catheter(RH, Terumo, Japan) was inserted for selective HA andSMA, and then a 3-Fr microcatheter (Progreat, Terumo,Japan) was superselectively inserted into the supply artery of the tumour. An oil-in-water-based emulsioncomprising chemotherapy drugs epirubicin (30–50 mg),oxaliplatin (100–150 mg), 5-fluorouracil (5-FU) (500–750 mg) and leucovorin (200–300 mg) mixed with lipiodol (8 ml) at a proportion of 1:1 were injected through amicrocatheter, and then 0.1 g polyvinyl alcohol (PVA)
Bo et al. BMC Cancer(2021) 21:1171Page 3 of 12Fig. 1 Flowchart of patient enrollment. TACE transarterial chemoembolization, HCC hepatocellular carcinomaparticles (300–500 μm) and gelatine sponge particleswere injected successively. The treatment endpoint wasdetermined by the interventional radiologist, and themain manifestation was the complete coverage of thetumour site by lipiodol deposition and feeding arteryshown as a “dry-branch”, which means there were noblood supply absolutely.All US examinations were performed by one experiencedUS physician (FX, with more than 10 years of experiencein liver CEUS) using a Siemens Oxana2 or S2000 ultrasonic system equipped with CEUS software. The transducer was a C6–1 convex array transducer operated at3.5–5.0Mz. All of the parameters were adjusted to ensure high-quality images. Before TACE, B-mode US wasperformed to define quantity (single or multiple), diameter (measured on the maximum section), location(lobe), and echogenicity (hypoechoic, isoechoic or hyperechoic) of the lesions. The gain, depth, focus, and dynamic range were appropriately adjusted. Although eachpatient had multiple nodules, specific nodules were selected for observation. The inclusion criteria for thenodules were (a) a diameter less than 10 cm; (b) a depthof no more than 8 cm from the skin; and (c) a goodacoustic window for clearly display by US.while HA-CEUS was performed again immediately afterTACE. The time interval between IA-CEUS and TACEwas less than 10 min. During HA-CEUS, the contrastagent reached the tumour directly through the supplyingartery. There was no contrast agent in the portal vein, sothe tumour only had enhancement of the arterial phase.In SMA-CEUS, the contrast agent reached the tumourthrough the portal vein, so the portal vein supply of thetumour was shown alone without disturbance of the arterial phase.Contrast pulse sequence mode was selected for imageacquisition. Before performing CEUS, the lesions werereconfirmed in B-mode US. The mechanical index wasset in the range of 0.06 to 0.1. The focus was set at thebottom of the screen. The gain and depth were adjustedaccordingly. The contrast agent was sulphur hexafluoride (Sonovue , Bracco, Milan Italy). The contrast agentfor SMA-CEUS was dissolved according to the specification (mixed with 5 ml normal saline to form a suspension), and the bolus injection dose was 1.5 ml. Theconcentration of contrast agent in HA-CEUS was 0.02ml/ml (the SMA-CEUS contrast agent was diluted usingnormal saline to a concentration of 1:50), and the injection dose was 4 ml (at a speed of 1 ml/second). Continuous storage of the dynamic images spanned no less than3 min.IA-CEUS techniqueImaging evaluationIA-CEUS, including hepatic artery contrast-enhancedultrasound (HA-CEUS) and superior mesenteric arterycontrast-enhanced ultrasound (SMA-CEUS), was performed using an arterial catheter inserted before TACE,After TACE and IA-CEUS, IA-CEUS images were retrospectively evaluated frame-by-frame offline by two experienced US physicians (J.B. and H.P., with more than 5years of experience, did not participate in TACE). AnUS technique
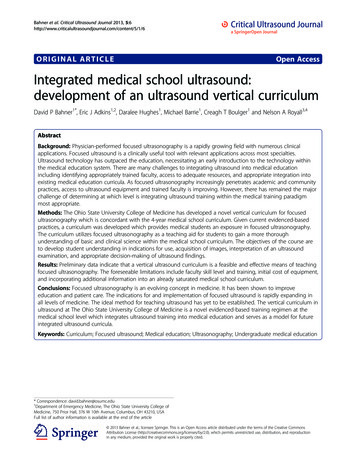
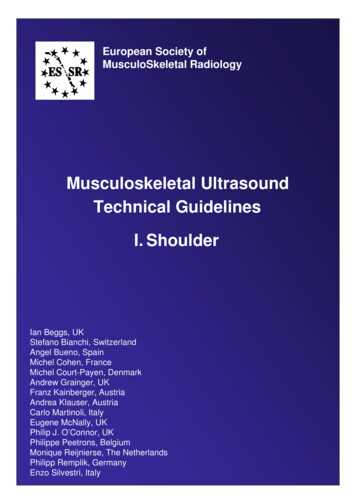
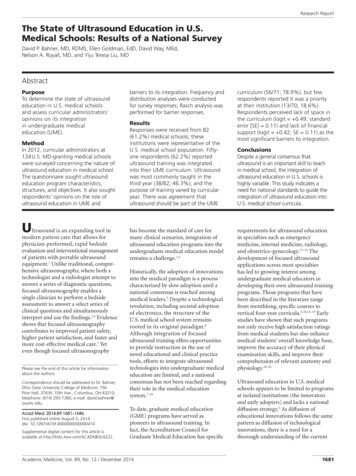
Bo et al. BMC Cancer(2021) 21:1171image was excluded if it was considered to be of poorquality by both doctors. When there was a disagreementbetween them, they discussed it together until a consensus was reached.Parameters observed in HA-CEUS before and afterTACE included intratumoural enhancement (presenceor absence), corona enhancement in the late phase(presence or absence) and corona thickness (measuredat the thickest point). The decrease in corona thicknessafter TACE was calculated. The parameters observed inSMA-CEUS before TACE included intratumoural enhancement (presence or absence) and the dimension ofnon-enhancing area (compared with B-mode ultrasoundin the same section). The result of dimension of nonenhancing area can be divided into larger nonenhancing area and no larger non-enhancing area.Examples can be seen in Fig. 2.Follow-upContrast-enhanced liver MRI was performed as thegold standard of TR for all patients to evaluatewhether the nodules had a blood supply 1–3 monthsafter TACE. Images were analysed by two abdomenPage 4 of 12MRI radiologists (with more than 10 years of experience) who were blinded to the IA-CEUS results. Theresult of TR in this study was evaluated on the basesof nodule rather than patient. Lesions were dividedinto a complete remission (CR) group and a non-CRgroup according to the modified response evaluationcriteria in solid tumours (mRECIST) standard [2, 5].CR was defined as the detection of the target nodulewithout any intratumoral arterial enhancement. NonCR was defined as the detection of the target nodulewith residual intratumoral arterial enhancement. Thediagnoses of the two radiologists were compared, andwhen the results were inconsistent, a consensus wasachieved after discussion and was regarded as thediagnosis.Statistical analysisAll data were separately recorded by two researchers(Z.L.H. and H.P.), and then the accuracy was evaluated. For data following a normal distribution, continuous variables were expressed as mean values andstandard deviations, and the independent t-test wasused to analyse differences. For data following aFig. 2 Examples of image evaluation in IA-CEUS. A & B, A hypoechoic lesion without intratumoural enhancement in SMA-CEUS preoperatively,the dimension of non-enhancing area (indicated by the arrow) was equal to the size in B-mode ultrasound. C & D, A hyperechoic lesion withoutintratumoural enhancement in SMA-CEUS preoperatively, the dimension of non-enhancing area (indicated by the arrow) was larger than the sizein B-mode ultrasound. E & F, In preoperative HA-CEUS, there was no corona enhancement around the tumour (indicated by the arrow in B-modeand by rectangle in HA-CEUS) in late enhancing phase. G & H, In preoperative HA-CEUS, corona enhancement can be seen around the tumour(indicated by the arrow) in late enhancing phase. HA-CEUS hepatic artery contrast-enhanced ultrasound; SMA-CEUS superior mesenteric arterycontrast-enhanced ultrasound
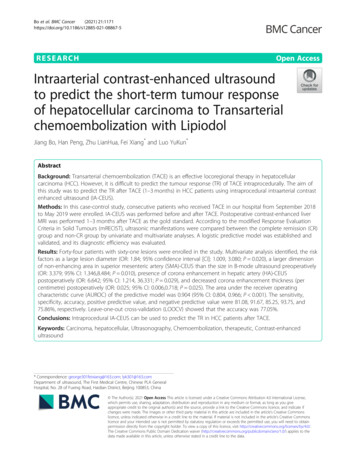
Bo et al. BMC Cancer(2021) 21:1171nonnormal distribution, continuous variables wereexpressed as medians and interquartile ranges. andthe Mann-Whitney U-test was used to analyse differences. Categorical variables were represented asfrequencies and percentages, and independent ormodified χ2 tests were used to analyse differences.After univariate analyses, variables with statisticalsignificance were subjected to logistic regression.P 0.05 was considered statistically significant. Thelogistic predictive model was established based onthe multivariate analysis and the Hosmer-Lemeshowgoodness-of-fit test and leave-one-out crossvalidation (LOOCV) were performed to validate themodel. The receiver operating characteristic (ROC)curve was obtained, and the sensitivity, specificity,accuracy and area under the ROC curve (AUROC)were calculated. The data were analysed by usingthe statistical software SPSS 21.0 (IBM, Somers,NY).ResultsCharacteristics of the patients & tumoursAs presented in Table 1, forty-four patients were enrolledin the study, comprising 41 males (93.18%) and 3 females(6.82%). The average age of the patients was 58.64 11.26years, and the range was 32 to 79 years. All the patients hadmultiple nodules. After standard selection, sixty-one lesionswere enrolled for observation. The mean lesion diameterwas 3.79 2.74 cm, with lesion diameter ranging from 0.7cm to 12.5 cm. Median follow-up time was 37 days, interquartile interval was 33 days to 45 days. Contrast-enhancedMRI results showed that 24 tumours (39.34%) respondedand achieved CR, while 37 tumours (60.66%) were recordedas non-CR (comprising 21 tumours with partial remission,10 with stable disease and 6 with progressive disease). Thekappa value of the two radiologists interpreting the MRI results was 0.908. There were no adverse events associatedwith IA-CEUS during the study.Inter-observer agreement of the IA-CEUS characteristicsFor HA-CEUS and SMA-CEUS, the observers obtainedidentical results in terms of intratumoural enhancement,and judgment of whether the dimension of non-enhancingarea in SMA-CEUS was larger than the size in B-modeultrasound. The kappa value was 0.902 for the evaluation ofcorona enhancement for HA-CEUS before and after TACE.Univariate analyses for short-term TRFor HA-CEUS, all the lesions showed hyperenhancement before TACE, while only four lesions showed thepresence of intratumoural enhancement in SMA-CEUS.There were no statistically significant differences between the two groups in these two parameters (P 1.00).Page 5 of 12Table 1 Patient and nodule aage(y)4458.6 (11.26)Sexmale41 (93.18)female3 (6.82)Hepatitis backgroundhepatitis B38 (86.36)hepatitis C3 (6.82)hepatitis B C1 (2.27)no hepatitis2 (4.55)Lesionsnumber61maximum diameter (cm) a3.79 (2.74)Locationleft lobe24 (39.34)right lobe37 (60.66)Echo in B-mode ultrasoundhypoechoic24 (39.34)isoechoic14 (22.95)hyperechoic23 (37.70)MRI resultcomplete remission24 (39.34)non-complete remission37 (60.66)kappa value of two doctors0.908Note. — Data in parentheses are percentages unless otherwise indicateda: Data in parentheses are standard deviationsAs shown in Table 2, the difference in tumour diameter between the CR group and the non-CR group wassignificant (P 0.001). There was no significant difference in age (P 0.18), sex (P 0.61), hepatitis background (P 0.41), nodule location (P 0.94) orecho(P 0.85) between the two groups.Among the parameters of preoperative IA-CEUS, in theincomplete remission group, the non-enhancing area ofSMA-CEUS was more likely to be larger than the size of thetumour shown in B-mode US (larger dimension of nonenhancing area in SMA-CEUS, shown in Fig. 3), the difference was significant (P 0.046). There were no significantdifferences in corona enhancement (P 0.14) or coronathickness (P 0.31) between the two groups before TACE.After TACE, intratumoural enhancement (P 0.005), corona enhancement (P 0.004) (shown inFigs. 4 and 5), corona thickness(P 0.003), and thedecrease in corona enhancement thickness (P 0.006)showed significant differences between the twogroups.
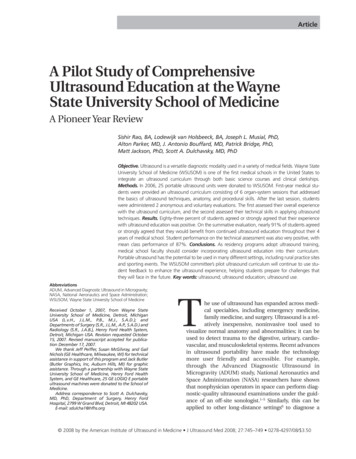
Bo et al. BMC Cancer(2021) 21:1171Page 6 of 12Table 2 Result of univariate analyses for short-term postoperative tumour responseComplete remission (n 16)non-complete remission (n 28)P value61.69 (9.58)56.89 (11.92)0.18Male14 (31.82)27 (61.36)0.61Female2 (4.55)1 (2.27)CharacteristicsPatientsAge(y)aSexHepatitis backgroundHepatitis B14 (31.82)24 (54.55)Hepatitis’s C1 (2.27)2 (4.55)Hepatitis B C1 (2.27)0 (0)No hepatitis0 (0)2 (4.55)Lesions0.41CR (n 24)Non-CR (n 37)2.50 (1.08)4.63 (3.16) 0.001Left lobe5 (8.20)8 (13.11)0.94Right lobe19 (31.15)29 (47.54)Diameter (cm) aLocationEcho in B-mode ultrasoundHypoechoic10 (16.39)14 (22.95)Isoechoic6 (9.84)8 (13.11)Hyperechoic8 (13.11)15 (24.59)0.85Preoperative IA-CEUSHA-CEUSCorona enhancement in late phaseYes22 (36.07)27 (44.26)No2 (3.28)10 (16.39)0.14Corona thickness (cm) a0.56 (0.23)0.67 (0.61)0.31larger than 2D-US8 (13.11)22 (36.07)0.046No larger than 2D-US16 (26.23)15 (24.59)Yes12 (19.67)31 (50.82)No12 (19.67)6 (9.84)Yes4 (6.56)21 (34.43)No20 (32.79)16 (26.23)Corona thickness (cm)b0.00 (0.00, 0.00)0.30 (0.00, 0.70)0.0030.50 (0.40, 0.70)0.20 (0.00, 0.40)0.006Non-enhancing area in SMA-CEUSPostoperative HA-CEUSIntratumoural enhancement0.005Corona enhancement in late phaseCorona thickness decrease (cm)b0.004Note. — Data in parentheses are percentages unless otherwise indicated. CEUS contrast-enhanced ultrasound, IA-CEUS intra-arterial contrast-enhanced ultrasound,HA-CEUS hepatic artery contrast-enhanced ultrasound, SMA-CEUS superior mesenteric artery contrast-enhanced ultrasound. a: Data in parentheses are standarddeviations. b: Data are median, with interquartile range in parenthesesLogistic regression and its goodness-of-fit and accuracyDue to the clinical association between the presence ofcorona enhancement and corona thickness after TACE,the latter was excluded from the logistic regression.Table 3 presents the results of the multivariate analyses.Tumour showing a 1 cm increase in diameter were associated with a 1.840-fold (95% confidence interval [CI]:1.009, 3.080; P 0.020) risk of a poor response. Preoperatively, tumours with an larger non-enhancing areain SMA-CEUS had a 3.379-fold (95% CI: 1.346, 8.484;
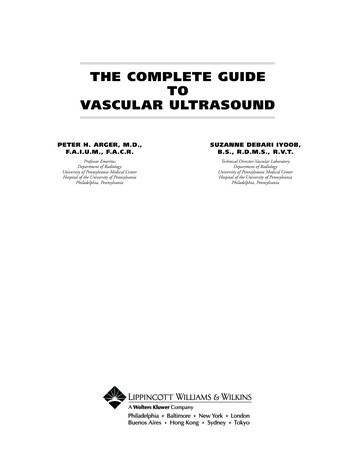
Bo et al. BMC Cancer(2021) 21:1171Page 7 of 12Fig. 3 Relationship between a larger dimension of non-enhancing area in preoperative SMA-CEUS and tumour response after TACE. A, B-modeultrasound showed a hypoechoic HCC lesion located in segment 4, which was 3.3 3.5 cm (indicated by the arrow). B, Preoperative SMA-CEUSshowed that a significant larger dimension (3.9 4.6 cm) of non-enhancing area (triangle shown) than the size in B-mode ultrasound. C,Postoperative abdominal contrast-enhanced MRI showed that the tumour response should be defined as stable disease (indicated by the arrow).TACE transarterial chemoembolization, HCC hepatocellular carcinoma; CEUS contrast-enhanced ultrasound; SMA-CEUS superior mesentericartery contrast-enhanced ultrasoundP 0.010) risk of a poor response. Postoperatively, thepresence of corona enhancement in the late phase wasassociated with a 6.642-fold (95% CI: 1.214, 36.331; P 0.029) risk of a poor response, and this risk was reducedby 6.8% (95% CI: 0.006, 0.718; P 0.025) for every 1 cmreduction in the corona enhancement.A logistic predictive model was established, and theAUROC was 0.909 (95% CI: 0.807, 0.967; p 0.001).The ROC curve is shown in Fig. 6. When the cut-offvalue was set to the predicted probability of 0.73, thediagnostic sensitivity was 81.08% (30/37), (95% CI:64.29, 91.44%), the specificity was 91.67% (22/24),(95% CI: 71.53, 98.54%), the accuracy was 85.25% (52/61), the positive predictive value was 93.75% (30/32),(95% CI: 77.78, 98.91%), the negative predictive valuewas 75.86%(22/29), (95% CI: 56.08, 88.98%), the positive likelihood ratio was 4.29(30/7), and the negativelikelihood ratio was 0.091(2/22). The HosmerLemeshow goodness-of-fit test showed that at 8 degrees of freedom, the predicted TR probability couldbe compared with the actual TR by χ2 test statistics.The results (X2 3.30, P 0.91) indicated that themodel fit the data adequately. LOOCV was performedto verify the diagnostic efficacy of the model, and theresults showed that the model accuracy was 77.05%(47/61).DiscussionEarly prediction of the response of hepatocellular carcinoma to transarterial chemoembolization is very important; however, intraoperative methods that can be usedfor accurate evaluation are rare. Our study shows thatintraarterial contrast-enhanced ultrasound could sensitively detect intratumoural microcirculation changes andcan identify risk factors for poor short-term tumour response after TACE. The established model may assist intreatment response prediction.The reasons for choosing IA-CEUS are as follows.Firstly, TACE is a local treatment of tumours via bloodvessels and the therapeutic effect is achieved by changing the tumour microcirculation. IA-CEUS can displaythe blood supply of the tumour more directly via arterialcatheter. Moreover, HA-CEUS can eliminate the interference of peripheral tissue enhancement and display thewash-out direction of the tumour better to evaluate thedistribution of the wash-out blood around the tumour,which may predict the possibility of recurrence or metastasis around the tumour [20]. In addition, since arteries can be selected, HA-CEUS shows only the arterialblood supply, while SMA-CEUS shows only the portalvein blood supply, which may avoid interference between the arterial and portal phases in peripheral veinCEUS [22, 23]. Therefore, the changes in
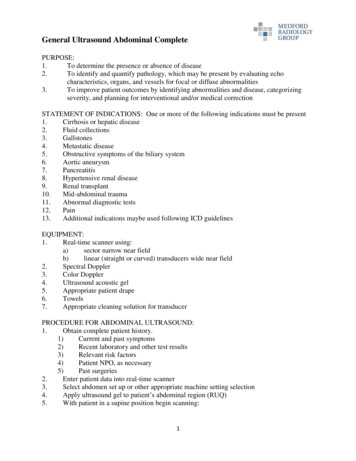
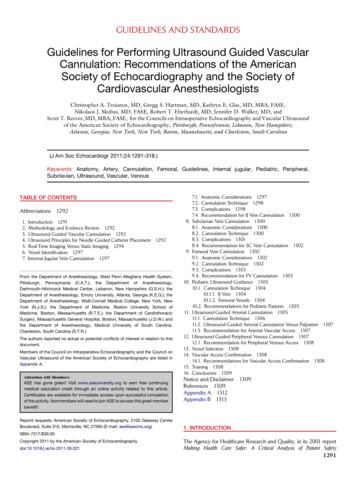
Bo et al. BMC Cancer(2021) 21:1171Page 8 of 12Fig. 4 Relationship between presence of corona enhancement in late phase in HA-CEUS and tumour response after TACE. A, Preoperative HACEUS revealed a hyperenhanced HCC lesion located in segment 8 (indicated by the arrow). B, Postoperative HA-CEUS showed coronaenhancement in the late enhancing phase. C, Postoperative abdominal contrast-enhanced MRI showed a small amount of intratumouralenhancement and peritumoural corona enhancement in portal phase, and the tumour response was defined as partial remission (indicated bythe arrow). TACE transarterial chemoembolization, HCC hepatocellular carcinoma; CEUS contrast-enhanced ultrasound; HA-CEUS hepaticartery contrast-enhanced ultrasoundmicrocirculation after TACE may be shown more specifically by IA-CEUS than conventional CEUS.Our results showed that larger dimension of nonenhancing area in SMA-CEUS preoperatively may predict poor TR. As shown in Fig. 3, the dimension of portal blood supply loss is larger than the size shown in theB-mode ultrasound. This pattern can be explained bythe changes in the HCC microcirculation. Changes inthe microcirculation with HCC progression have beendemonstrated by Kitao [24]. With the progression ofHCC, abnormal arterial hyperplasia leads to an increasein tumour pressure, which causes the hepatic venoussystem to collapse, initially due to compression. The increasing pressure gradient of blood pressure leads to thegradual conversion of the portal vein from a supplyingartery to a draining vessel. An artery-portal shunt develops gradually [25]. The larger dimension of nonenhancing area in SMA-CEUS may indicate that the tumour’s portal system plays a role of drainage rather thanperfusion. This type of tumour may have a higher degreeof progression than those without larger dimension ofnon-enhancing area or those still have portal vein perfusion. Moreover, the formation of an artery-portal shuntmay make it easier for chemotherapeutic agents to begradually drained after treatment, rather than remaininginside the tumour for a long time, leading to poor TR.Duran et al. reported that the intratumoural drug concentration 3 weeks after treatment is an influential factorfor antitumour effects [26]. Therefore, the combinationof artery-portal shunts and portal drainage may decreasethe concentration of drugs, leading to poor antitumoureffects. However, thus far, we have not found any reportsof the use of SMA-CEUS to evaluate the TR of TACE.We believe that this technology may serve as a new toolfor evaluating the short-term efficacy of TACE for HCC.We found that the presence of a corona enhancementpostoperatively may lead to poor TR. As is shown inFigs. 4 and 5, the tumoral corona enhancement is shownin the late phase, and the peripheral area of the tumourremained active for 1–3 months after TACE. These corona enhancements may be related to the drainage areaof the tumour. According to the theory of Kitao [24],blood flow from the tumour drains into the surroundinghepatic sinuses and forms the drainage area, which ischaracterized by continuous corona enhancementaround the tumour in the late-enhancing phase [27].The presence of a drainage area indicates that the perfusion of blood flow is still occurring inside the tumour.The accumulation of lipiodol in the tumour may interfere with the operator’s judgement of intratumoural enhancement. Similar conclusions have been reported inprevious studies [11]. Intratumoural enhancement may
Bo et al. BMC Cancer(2021) 21:1171Page 9 of 12Fig. 5 Comparison among HA-CUES, CBCT and DSA imaging. A, B-mode ultrasonography showed a hypoechoic HCC lesion located in segment 7before TACE (arrow). B, Supperselected DSA showed the lesion before TACE (arrow). C, B-mode ultrasonography revealed lipiodol deposition inthe lesion immediately after TACE (arrow). D, The lesion was shown on DSA after TACE (arrow). E, Postoperative HA-CEUS showed coronaenhancement in the late phase (arrow). F, Postoperative cone-beam CT showed the high density deposition inside and around the tumour(arrow). HA-CEUS hepatic artery contrast-enhanced ultrasound; DSA digital subtraction angiographynot be accurate enough to adequately evaluate treatmentoutcomes. In this study, the drainage area was characterized by corona enhancement around the tumour, whichwas not affected by hyperechoic lipiodol. Moreover, thedrainage area was located downstream of the entiremicrocirculation and played a role in convergence.Therefore, the presence of a drainage area suggested thatthe HCC was not completely embolized, although theremay be no specific enhancement or it may be indeterminate due to the interference of lipiodol. As shown inFig. 5, the drainage area shown in HA-CEUS was notshown in DSA even though the tumour had met theTACE endpoint in DSA. Even if this phenomenon isdemonstrated by CBCT in this case, the consistency ofCBCT and CEUS in the display of drainage areas needsfurther study. In our previous study, we found that theconsi
cinoma (HCC) accounts for 75-85% of liver cancer [1]. Transarterial chemoembolization (TACE) is an effective locoregional therapy in unresectable HCC, especially for Barcelona grade B patients [2], with an objective re-sponse rate of 43.6-61.5% [3]. Contrast-enhanced MRI can be performed 1-3months after TACE to assess the