Transcription
Demographic Analysis of theNavajo NationUsing 2010 Census and 2010 American Community Survey EstimatesCompleted for:Planning and DevelopmentP.O. Box 17779Window Rock, Arizona 85269Completed by:Arizona Rural Policy InstituteCenter for Business OutreachW.A. Franke College of BusinessNorthern Arizona University
This report was prepared by the Arizona Rural Policy Institute, Northern Arizona University, partiallyfunded under an award from the Economic Development Administration, U.S. Department of Commerce.The statements, findings, conclusions, and recommendations are those of the authors and do notnecessarily reflect the views of the Economic Development Administration or the U.S. Department ofCommerce.The Arizona Rural Policy Institute also receives support from the City of Flagstaff, Coconino County, andthe Office of the President, Northern Arizona University2
Table of ContentsTable of Contents . 1List of Tables . 3List of Figures . 4Navajo Nation . Error! Bookmark not defined.Demographic Analysis . 5Introduction . 5Population . 6Gender . 7Age . 7Median Age . 14Race . 17Ethnicity . 18Households . 19Children Under 18 Years Age Living with Grandparent . 26Presence of Multigenerational Households . 28Household Income . 29Supplemental Income . 31Other Income . 33Poverty . 34Children in Poverty. Error! Bookmark not defined.Households in Poverty . 36Households Receiving Supplemental Nutrition Assistance Program (SNAP) . Error! Bookmark notdefined.Fertility . 38APPENDIX A:THE NAVAJO NATION CENUS 2010 . 40Table 1: Total Population and Trends . Error! Bookmark not defined.Table 2. Age. Error! Bookmark not defined.Males Age 17 and Under. Error! Bookmark not defined.Females Age 17 and Under . Error! Bookmark not defined.Table 3. Race . Error! Bookmark not defined.Table 4. Hispanic or Latino and Race . Error! Bookmark not defined.Table 5. Relationship of persons in household . Error! Bookmark not defined.Table 6. Households by type . Error! Bookmark not defined.Table 7. Household by type of household structure . Error! Bookmark not defined.Table 8. Children under 18 years of age living with Grandparent Error! Bookmark not defined.Table 9. Multi-generational and household by sex of partner and presence of children . Error!Bookmark not defined.Table 10. Group Quarters . Error! Bookmark not defined.Table 11. Housing occupancy and tenure . Error! Bookmark not defined.1
APPENDIX B:THE NAVAJO NATION ACS 2010, 5-YEAR ESTIMATES . 54Table 12: Household income and benefits (in 2010 inflation-adjusted dollars) . Error! Bookmarknot defined.Table 13: Family income and benefits (in 2010 inflation-adjusted dollars) . Error! Bookmark notdefined.Table 14: Other income measures (in 2010 inflation-adjusted dollars) . Error! Bookmark notdefined.Table 15: Poverty status over the last 12 months - households within poverty rates. Error!Bookmark not defined.Table 16: Poverty status over the last 12 months . Error! Bookmark not defined.Table 17: Poverty status over the last 12 months - children in poverty . Error! Bookmark notdefined.Table 18: Poverty status over the last 12 months - households within poverty rates. Error!Bookmark not defined.Table 19: Poverty status over the last 12 months - households receiving SNAP support . Error!Bookmark not defined.Table 20: Employment status . Error! Bookmark not defined.Table 21: Workforce status . Error! Bookmark not defined.Table 22: Workers by industry . Error! Bookmark not defined.Table 23: Class of worker . Error! Bookmark not defined.Table 24: Marital status . Error! Bookmark not defined.Table 25: Fertility universe women 15 to 50 who gave birth in the past 12 months . Error!Bookmark not defined.Table 26: School enrollment . Error! Bookmark not defined.Table 27: Educational attainment population 25 years and older . Error! Bookmark not defined.Table 28: Veteran status . Error! Bookmark not defined.Table 29: Residence 1 year ago . Error! Bookmark not defined.Table 30: Language spoken at home . Error! Bookmark not defined.APPENDIX C:THE NAVAJO NATION ACS MARGIN OF ERROR ESTIMATES. 54ACS Margin of Error Estimates . 55Understanding margin of error . 55Table 31: Navajo Nation margin of error estimates . Error! Bookmark not defined.2
List of TablesTable 1. Total Population & Trends . 6Table 2. Gender Ratios . 7Table 3. Age Groups by 5 Year Cohorts . 8Table 4. Single year age by gender for those under 18 years of age. 13Table 5. Demographic Profile Navajo Nation, Census 2010 . 15Table 5. Demographic Profile Navajo Nation continued . 16Table 6. Race . 17Table 7. Ethnicity. 18Table 8. Household Structure . 21Table 9. Household Structure . 23Table 10. Household by Type of Household Structure . 25Table 10. Household by Type of Household Structure .continued Error! Bookmark not defined.Table 11. Children under 18 years of age living with a grandparent householder . 26Table 12. Household Income (In 2010 Inflation-Adjusted Dollars) . 29Table 13. Household Income and Benefits (In 2010 Inflation-Adjusted Dollars) . 32Table 14. Other Income Measures (In 2010 Inflation-Adjusted Dollars). 33Table 15 Poverty Status over the Last 12 Months . 34Table 16. Poverty Status over the Last 12 Months - Children in Poverty . Error! Bookmark notdefined.Table 17. Households within Poverty Rates . 36Table 18. Households Receiving SNAP Assistance . Error! Bookmark not defined.Table 19. Fertility . 383
List of FiguresFigure 1. Percent Population Change 2000 to 2010 Arizona, Yuma County & Navajo Nation . 6Figure 2. Age Cohorts for Arizona, Yuma County & Navajo Nation2010 . 9Figure 3. Population Pyramid - Navajo Nation2010 . 10Figure 4. Median Age in Years 2010 . 14Figure 5. Ethnicity . 18Figure 6. Average Household and Family Size . 19Figure 7. Household Relationships . 22Figure 8. Household Structure . 23Figure 9. Households headed by single mothers . 24Figure 10. Percentage of children under 18 living with a grandparent householder . 27Figure 11. Presence of multigenerational households . 28Figure 12. Percentage of household income by range . 29Figure 13. Supplemental Income . 31Figure 14. Persons in Poverty by Age . 35Figure 15. Households by Poverty Ratios . 37Figure 16. Birth Rates per 1000 Women . 394
Navajo NationDemographic AnalysisIntroductionThis analysis of the Navajo Nation was undertaken by the Arizona Rural Policy Institute (ARPI) inthe W.A. Franke College of Business at Northern Arizona University for the planningdepartment of the Navajo Nation. The ARPI has produced the Demographic Profile for NavajoNation with the latest information available from the 2010 Census and the 2010 AmericanCommunity Survey (5-year estimates). This document is provided to Arizona tribes as a productof the EDA Technical Assistance Grant provided to the ARPI at Northern Arizona University.Although the American Community Survey (ACS) produces population, demographic andhousing unit estimates, it is the Census Bureau's Population Estimates Program that producesand disseminates the official estimates of the population for the nation, states, counties, citiesand towns and estimates of housing units for states and counties. Therefore, this reportincorporates two major data sources. First, the official 2010 Census, primarily from the SF1 datareport to produce data on the population, age, race and ethnicity relative to Navajo Nation. Thesecond data source is the American Community Survey, 5-year estimate data for the period2006 to 2010 and is annotated in the document as ACS 2010 (5-year estimates). The 2010 ACS5-year estimates are based on data collected between January 2006 and December 2010. Thedata were used to analyze household income, poverty rates, employment, language use andhousehold characteristics for Navajo Nation. Only the 5-year estimates are used as the data wasprovided for small geographic areas, representing the average characteristics over the 5-yearperiod.The analysis of demographics for the Navajo Nation first examines the 2010 Census and thenthe American Community Survey where data is available. Demographic characteristics for theNavajo Nation are outlined in three state partitions for Arizona, New Mexico and Utah.Comparisons between the state partitions serve to provide further levels of comparison whenexamining demographic characteristics of the tribe.Appendix A contains official Census 2010 data and Appendix B contains American CommunitySurvey data (5-Year Estimates) and Appendix C contains the margin of error estimates to beused to calculate the estimates for the American Community Survey data.5
PopulationThe population of the Navajo Nation saw a slight decrease in population (-3.9%) on tribal landsin 2010 when compared to 2000. New Mexico tribal lands saw the largest decrease inpopulation (-5.7%), followed closely by Utah (-5.0%). Arizona, which has the largest tribalpopulation of the three states, saw a more modest decrease of -2.7 percent. This decrease intribal members, however, may not truly reflect the actual change in the tribal populationbetween the census periods. The SF1 census is considered the official count, and accounts foronly the population within the exterior boundaries of the tribal lands or nation.Table 1. Total Population & Trends Navajo Nation 2000 and 2010Total Population and TrendsTotal Population 2000Total Population 2010Change in Population 2000-2010Source: Census 2000, 2010 3,667-3.9%Figure 1. Percent Population Change 2000 to 2010for the Navajo Nation betweenArizona, New Mexico & UtahPopulation Change Navajo Nation 2000 - 2010 Census (Source:Census 2000, 2010, SF1)104,565 101,83569,52465,7646,373ArizonaNew Mexico200062010Utah6,068
GenderDifferences in population between females (50.9%) and males (49.1%) on the Navajo Nation areslight. Female gender ratios on the Navajo Nation are higher in all states. Females (51.0%)comprise a slightly larger proportion of the population among New Mexico tribal members thaneither of the other states Arizona (50.8%) and Utah (50.1%).Table 2. Gender ource: Census 2000, 2010 otal NavajoNation85,31688,351173,667AgeThe Navajo Nation is dominated by those under 18 years of age. The under-18 age populationaccounts for one third (33%) percent of all tribal members. The Utah portion of the NavajoNation has the largest percentage of the population under age 18 (36%), followed by Arizona(34%) and new Mexico (32%). The fact that one-third of tribal members are younger than 18years of age carries with it important policy implications. The large portion of younger tribalmembers influences the provision of health and educational services as well as poverty andworkforce issues as well.On the other hand, the tribe has fewer members who are 65 years or older as a proportion ofthe total population. This age group, those who have retired and are out of the workforce,account for one-tenth (10.0%) of tribal members. Overall the Utah portion of the Navajo Nationhas fewer members over 65 (9%) and more members under 18 years. The Navajo Nation has asimilar age profile to other Arizona tribes, with large percentages of tribal members under age18. Overall,, those age 18 to 64 years account for 57 percent of tribal members, just lowerthan the portion of the Arizona State population (60.7%). The large number of tribal youngpersons will have an effect on the development of the tribal workforce in the future. See Table3, and Figure 2.7
Table 3. Age Groups by 5 Year CohortsAge by Five Year CohortsUnder 5 years5 to 9 years10 to 14 years15 to 17 years18 and 19 years20 years21 years22 to 24 years25 to 29 years30 to 34 years35 to 39 years40 to 44 years45 to 49 years50 to 54 years55 to 59 years60 and 61 years62 to 64 years65 and 66 years67 to 69 years70 to 74 years75 to 79 years80 to 84 years85 years and overTotalSource: Census 2010 ,4253,2421,9661,633173,667
Figure 2. Age Cohorts for Arizona, Yuma County & the Navajo Nation 2010Age groupings percentage 18, 18 to 64 and 65 aspercent of total population(Source: 2010, SF1)56%34%58%55%36%32%10% 18 Year18 to 64 YearArizonaNew Mexico910%65 YearUtah9%
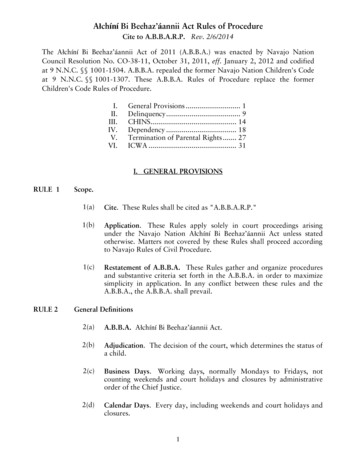
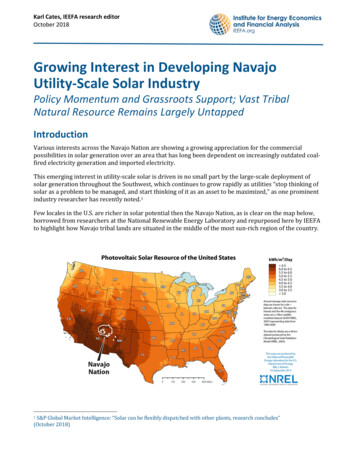
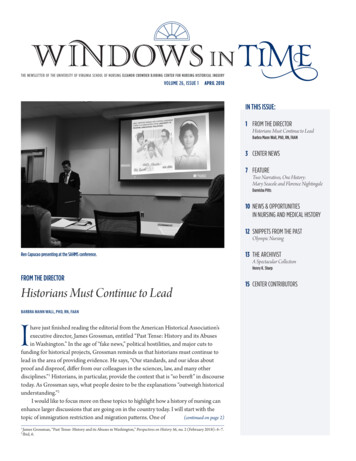
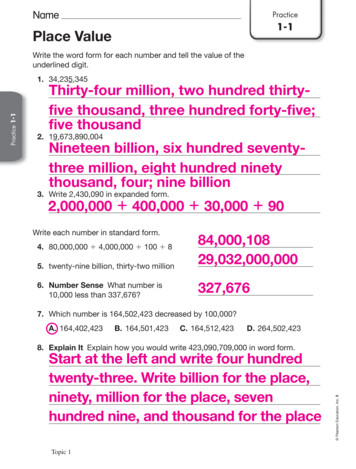
A population pyramid, also called an age structure diagram, is a graphical illustration that showsthe distribution of various age groups in a population (typically that of a country or region ofthe world), which forms the shape of a pyramid when the population is growing.The population pyramids below (Figures 3, 4,and 5) illustrate the difference between male andfemale 5-year age cohorts for the Arizona, New Mexico and Utah portions of the Navajo Nation.At the top of the age pyramid there are generally more females than males, which is true forthe overall population as women tend to live longer than men. Both males and females in the20-25 age cohorts are missing from the count. The age pyramid provides an illustratedsnapshot of the age structure of tribal members at the time of the 2010 census.Figure 3. Population Pyramid - the Navajo Nation – Arizona Portion 2010Population Pyramid - Navajo Nation - Arizona Portion(Source: 2010, SF1)85 years and over80 to 84 years75 to 79 years70 to 74 years67 to 69 years65 and 66 years62 to 64 years60 and 61 years55 to 59 years50 to 54 years45 to 49 years40 to 44 years35 to 39 years30 to 34 years25 to 29 years22 to 24 years21 years20 years18 and 19 years15 to 17 years10 to 14 years5 to 9 yearsUnder 5 %
Figure 4. Population Pyramid - the Navajo Nation – New Mexico Portion 2010Population Pyramid - Navajo Nation - New Mexico Portion(Source: 2010, SF1)85 years and over80 to 84 years75 to 79 years70 to 74 years67 to 69 years65 and 66 years62 to 64 years60 and 61 years55 to 59 years50 to 54 years45 to 49 years40 to 44 years35 to 39 years30 to 34 years25 to 29 years22 to 24 years21 years20 years18 and 19 years15 to 17 years10 to 14 years5 to 9 yearsUnder 5 years-5%-4%-3%-2%-1%Females110%Males1%2%3%4%5%
Figure 5. Population Pyramid - the Navajo Nation – Utah Portion 2010Population Pyramid - Navajo Nation - Utah Portion(Source: 2010, SF1)85 years and over80 to 84 years75 to 79 years70 to 74 years67 to 69 years65 and 66 years62 to 64 years60 and 61 years55 to 59 years50 to 54 years45 to 49 years40 to 44 years35 to 39 years30 to 34 years25 to 29 years22 to 24 years21 years20 years18 and 19 years15 to 17 years10 to 14 years5 to 9 yearsUnder 5 years-6%-4%-2%Females120%Males2%4%6%
Population Under 19 YearsChildren under 19 years of age account for 37.4 percent of all tribal members. There are85,316 males and 88,351 female tribal members, and of these 38.4 percent are males are underage 19 and 36.3 percent are females under age 19. There are generally equal numbers of males(28.3%) and females (28.2%) under age 5; sex ratios are also similar for those between 5 and 10and 11 to 17 years of age. See Table 4.Table 4. Single year age by gender for those under 19 years of ageUnder 1 year1 year2 years3 years4 years5 years6 years7 years8 years9 years10 years11 years12 years13 years14 years15 years16 years17 years18 years19 yearsSource: Census 2010 9%5.8%6.0%6.0%5.6%5.6%5.3%4.6%13New 9%4.5%5.6%5.1%4.3%4.2%5.0%5.1%6.0%6.4%6.3%4.1%4.8%
Median AgeThe median age (point that splits the population where 50% are above and 50% are below) forthe Navajo Nation tribal members is 28 years, with males and females aged 27 and 30 yearsrespectively. The median age of tribal members is lower than the state of Arizona (36 years),emphasizing once again the younger age profile of the Navajo Nation. See Figure 6.Figure 6. Median Age in Years Navajo Nation 2010Median age in years(Source: Census 2010, SF128.8 29.726.928.5Median Age30.4 31.227.228.425.927.2Median Age MaleArizonaNew MexicoUtah1428.430.0Median Age FemaleTotal Navajo Nation
Table 5. Demographic Profile the Navajo Nation, Census 2010ArizonaNewMexicoUtahTotalNavajoNationTotal Population 2000Total Population 2010Change in Population n Density persons per square mileLand Area Square 25 Year Age CohortsUnder 5 years5 to 9 years10 to 14 years15 to 17 years18 and 19 years20 years21 years22 to 24 years25 to 29 years30 to 34 years35 to 39 years40 to 44 years45 to 49 years50 to 54 years55 to 59 years60 and 61 years62 to 64 years65 and 66 years67 to 69 years70 to 74 years75 to 79 years80 to 84 years85 years and over15
Table 5. Demographic Profile the Navajo Nation continuedArizona28.827.230.4Median AgeMedian Age MaleMedian Age FemaleAge Group DemographicsAge 0 to 1718 to 24 Years25 to 44 Years45 to 64 Years62 Years and Over65 Years and Over18 & OverMale 18 & OverFemale 18 & Over21 & Over15 to 19 YearsMales 65 & OverFemales 65 & OverSource: Census 2010 4115,82356,17459,649105,69518,0306,9879,597
RaceNot surprisingly, the majority of the Navajo Nation tribal members identify themselves asAmerican Indian or Alaska Native alone (96%), while the remaining 4 percent are split betweenwhite alone (2%), and multi-race persons (2%). This stands in strong contrast to Arizona, forexample, which is 73 percent white alone. See Table 6.Table 6. RaceArizonaTotal Population101,835%White2,3052%Black or African American1370%American Indian or Alaskan Native 97,34996%Asian2410%Hawaiian and Other PacificIslander250%Some Other Race1800%Multi Race - Persons reportingmore than one race1,5982%Source: Census 2010 SF117New Mexico65,764%8441%700%63,61497%1290%Total 5,861 97% 166,826 %
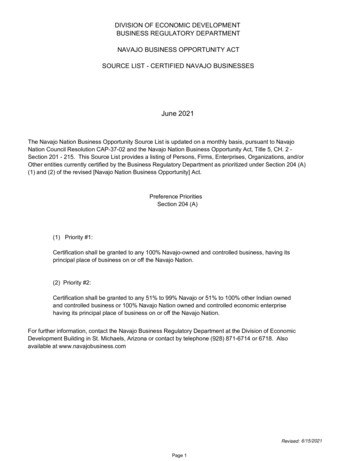
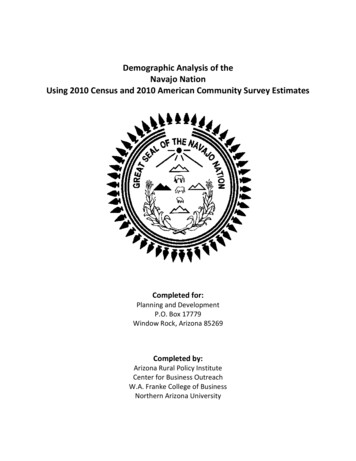
EthnicityIn terms of ethnicity, the vast majority of Navajo Nation tribal members (98%) self-identify asnot Hispanic or Latino; only two percent self-identify as Hispanic or Latino. This is muchdifferent from the State of Arizona which was almost one-third Hispanic or Latino (29.6%) in the2010 Census. See Table 7 and Figure 7.Table 7. EthnicityHispanic or Latino OriginTotal PopulationHispanic or Latino of anyraceNot Hispanic or LatinoSource: Census 2010 SF1Arizona101,835%New 692%98%2%98%Total NavajoNation173,6672%3,50698% 170,1632%98%Figure 7. EthnicityEthnicity - Hispanic and Non-Hispanic(Source: Census SF1, 2010)98%2%Arizona98%98%2%2%New MexicoUtahHispanic or LatinoNot Hispanic or Latino1898%2%Total Navajo Nation
HouseholdsIn 2010, there were 49,946 households on the Navajo Nation, with an average household sizeof 3.5 persons and an average family size of 4.1 persons as well. The average household sizeof the Navajo Nation (3.4 persons) is larger than the State of Arizona (2.6 persons) as is theaverage family size for tribal members (4.1 persons) compared to the state of Arizona (3.2persons). Household size data for Navajo Nation is similar across all three states. See Figure 8.Figure 8. Average Household and Family SizeAverage Household and Family Size(Source: Census 2010, SF1)4.13.53.43.64.23.5Average Household SizeArizona4.0Average Family SizeNew MexicoUtah19Total Navajo Nation4.1
The next portion of this analysis concerns households and their structure. The Census defines a“household” as a person or group of people who occupy a housing unit. The “householder” is aperson in whose name the housing unit is owned, being bought, or rented. A “familyhousehold” consists of a householder and one or more people living together in the samehousehold who are related to the householder by birth, marriage, or adoption — it may alsoinclude people unrelated to the householder. If the householder is married and living withhis/her spouse, then the household is designated a “married-couple household.” The remainingtypes of family households not maintained by a married couple are designated by the sex of thehouseholder. A “nonfamily household” consists of a person living alone or a householder whoshares the home with nonrelatives only; for example, with roommates or an unmarried partner.Family households (76%) dominate on the Navajo Nation, although traditional married couplefamilies are in the minority (39%), which is lower than the State of Arizona overall (48%).Households headed by a female (single moms) account for one-fourth (26%) of all NavajoNation households. Two-thirds (65%) of all households are either married couple families (39%)or households headed by single mothers (26%). Other household structures include non-familyhouseholds (24%), the majority of whom are unmarried partner households (9%). See Table 8and Figure 9.20
Table 8. Household StructureTotal HouseholdsFamily Households (Families)With Own Children Under 18YearsMarried Couple FamilyWith Own Children Under 18YearsFemale householder, No HusbandPresentWith Own Children Under 18YearsNon Family HouseholdsUnmarried Partner HouseholdsSame-Sex Unmarried PartnerHouseholdsHouseholder Living AloneHouseholder 65 Years and OverHouseholds With IndividualsUnder 18 YearsAverage Household SizeAverage Family SizeSource: Census 2010 SF1Arizona29,232%21,93575%New MexicoUtah19,034% 1,680%14,452 76% 1,331 79%Total 3,50718%40524%9,64819%7,70026%5,12927%36922%13
The Navajo Nation is dominated by those under 18 years of age. The under-18 age population accounts for one third (33%) percent of all tribal members. The Utah portion of the Navajo Nation has the largest percentage of the population under age 18 (36%), followed by Arizona (34%) and new Mexico (32%).