Transcription
DI SA STER RI S K REDUCTION AND MANAGE MENTenvironmental affairsDepartment:Environmental AffairsREPUBLIC OF SOUTH AFRICA
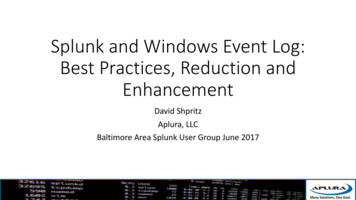
LONG-TERM ADAPTATION SCENARIOSFLAGSHIP RESEARCH PROGRAMME (LTAS)CLIMATE CHANGE ADAPTATIONPerspectives for Disaster RiskReduction and Managementin South AfricaProvisional modelling ofdrought, flood and sea levelrise impacts and a description ofadaptation responsesLTAS Phase II, Technical Report (no. 3 of 7)The project is part of the International Climate Initiative (ICI), which is supported by the German Federal Ministry for the Environment, Nature Conservation and Nuclear Safety.environmental affairsDepartment:Environmental AffairsREPUBLIC OF SOUTH AFRICALTA S: DI SA STER RI S K REDUCTION AND MANAGE MENT1
Table of ContentsList of figures4List of Tables5List of Abbreviations6ACKNOWLEDGEMENTS8Report Overview9Executive summary101.Introduction121.1. Modelling in Support of Disaster Risk Reduction in South Africa121.2. Linking potential impacts to specific infrastructure121.3. Adaptation Options and Recommendations12Methodology132.1. Climate futures for South Africa132.2. Modelling potential drought impacts142.3. Modelling potential flooding impacts192.4. Modelling potential sedimentation impacts202.5. Modelling potential sea-level rise impacts21Climate change impacts of relevance to DRRM243.1242.3.4.Potential drought impacts3.2. Potential flood impacts323.3. Potential sedimentation impacts423.4. Potential sea-level rise impacts45Climate change adaptation responses and policyrecommendations504.150Adaptation options for increased drought risk4.2. Adaptation options for increased flood risk2LTA S: DI SA STER RI S K REDUCTION AND MANAGE MENT51
4.3. Adaptation options for reducing negative sedimentation impact514.4. Adaptation options for sea-level rise impacts514.5. Summary of adaptation responses for South Africa under future climates545. Future research needs, future adaptation work es61LTA S: DI SA STER RI S K REDUCTION AND MANAGE MENT3
List of FiguresFigure 1:Summary of possible climate future derived for six hydro-climatic zones in South Africa as part ofPhase 1 of the Long Term Adaptation Scenarios (LTAS) programme.13Figure 2:Generic modelling unit used for configuration of the WRYM16Figure 3:Schematic diagram of the national WRYM system model17Figure 4:Detail of the national WRYM system model (Mooi-Mgeni River System)18Figure 5:Sediment regions and erosion hazard classes for South Africa (Msadala et al, 2010)21Figure 6:Map of South Africa showing the name and location of the nineteen water management areas,primary catchments and the grouping of catchments into six general hydro-climatic zones.24Figure 7:Change in the frequency, severity and duration of hydrological droughts for six representativecatchments across South Africa based on the annual cumulative flow at the outlet for the period1962 to 2100 using the dynamically downscaled gf0 model for the A2 SRES scenario.26Figure 8: Variation in the thresholds for definition of drought severity over time in the Berg Rivercatchment.27Figure 9: Range of potential impacts of climate change on the average annual catchment runoff for allsecondary catchments for the period 2040 to 2050 due to the UCE scenario relative to thebase scenario.28Figure 10: Hybrid frequency distribution of the change in the proportion of the average annual demandfor the whole country and from different sectors that can be met under different climatescenarios over the period 2040 to 2050.29Figure 11:30Average annual water demand (top) for the 19 WMAs for the period 2040 to 2050 and theproportion of demand that can be supplied under the base scenario (symbols) and modelsrepresenting the minimum, 25th, median, 75th percentile and maximum impact under theUCE scenario for different sectors.Figure 12: Most extreme impact of climate change on the 1:10 RI maximum annual daily rainfall over theperiod 2045 to 2100 relative to the historical period for five climate models.33Figure 13: Most extreme impact of climate change on the 1:10 RI maximum annual daily cumulative runoffover the period 2045 to 2100 relative to the historical period for five climate models.34Figure 14: Temporal changes in the 1:10 year RI annual maximum floods for six representative catchmentsacross South Africa under five different climate models.36Figure 15: Spatial and temporal comparison of changes in flood magnitude and drought frequency for allcatchments across South Afric (GF1 model, A2)37Figure 16: Cumulative frequency distributions of the relative changes in the potential design flood risk forkey infrastructure across South Africa by 2050 and 2100 compared to the historical period(representing the average impacts of five climate models).384LTA S: DI SA STER RI S K REDUCTION AND MANAGE MENT
Figure 17: Frequency distributions of extreme potential impacts on the design flood (1:100 year) for keyinfrastructure under four climate change models (top, left) and the relative risk for individualstructures for the climate model with the greatest general impact up to 2100 (gf1). (Analysisbased on potential changes in 1:100 year RI flood – no consideration of hydraulic characteristicsof individual structures.)40/41Figure 18: Number of bridges in each WMA in each risk class defined in terms of the maximum relativeincrease in the 1:100 year design flood by 2050 for the gf1 climate model.42Figure 19: Relative change in the annual sediment yields for 95 dam catchments around South Africa basedon the relative change in the 1:10 year RI annual maximum daily flow derived from a probabilisticanalysis over three overlapping fifty year periods under the five climate models.43Figure 20: Potential impact of changes in sediment yield for a selection of 95 dams around the country as afunction of changes in the 1:100 RI maximum annual daily streamflow (Q10) under five dynamicallydownscaled regional climate models out to 2100, relative to the historical annual sediment loads. 45Figure 21: Approximate area of coastal local municipalities below 5.5 m elevation above current mean sealevel (MSL).46List of TablesTable 1:Number of structures (bridges, dams and powerline crossings) with projected flood risk increasesby 2050 relative to the current design flood magnitude (1:100 year RI).39Table 2:Estimated area of coastal municipalities below 5.5m elevation above current mean sea level (MSL).The top five municipalities in terms of impacted area are indicated by the shading of the rank valuestarting with the most impacted.47Table 3:Summary of National Sea-level rise costs 2010-2100 under two scenarios (2010 prices).48Table 4: Value of sea-level rise risk for three different storm surge scenarios for Cape Town (Source:Cartwright, 2008)LTA S: DI SA STER RI S K REDUCTION AND MANAGE MENT495
List of AbbreviationsACRUAgricultural Catchments Research Unit ModelAEPannual exceedance probabilityAMFannual maximum floodAMFPannual maximum flow peakCFDcumulative frequency distributionsCMIP3Coupled Model Intercomparison Project3CORMIXCornell Mixing Zone ModelCSAGClimate Systems Analysis Group (University of Cape Town)CSIR CCAMCouncil for Scientific and Industrial Research Conformal-cubic Atmospheric ModelCSIRCentre for Scientific and Industrial ResearchDEADepartment of Environmental AffairsDEMdigital elevation modelDRRMdisaster risk reduction and managementDWADepartment of Water AffairsEMCenvironmental management classEWRecological water requirementGCMglobal circulation modelGEVgeneral extreme value (distribution)GF0Geophysical Fluid Dynamics Laboratory Coupled Model, version 2.0 (GFDL-CM2.0)GF1Geophysical Fluid Dynamics Laboratory Coupled Model version 2.1 (GFDL-CM2.1)GISgeographic information systemGIZGesellschaft für Internationale ZusammenarbeitGSMMax Planck Institute for Meteorology ECHAM5/MPI-Ocean coupled climate modelHAThighest astronomical tideHFDhybrid frequency distributionIAPinvasive alien plantsIGSMintegrated global systems modelIPCCIntergovernmental Panel on Climate ChangeIPSSinfrastructure planning system supportJPV joint-peak-volumeL1S Level 1 StabilizationLM local municipality6LTA S: DI SA STER RI S K REDUCTION AND MANAGE MENT
LN log-normal (distribution)LTAS Long Term Adaptation ScenariosMAMFmean annual maximum floodMAPmean annual precipitationMARmean annual runoffMIRModel for Interdisciplinary Research on Climate, medium resolution (MIROC3.2-medres)MIT IGSMMassachusetts Institute of Technology Integrated Global System ModelMPIMax Planck Institute for Meteorology ECHAM5/MPI-Ocean coupled climate modelMSLmean sea levelNCCRPNational Climate Change Response White PaperNGInational geospatial informationNWRSNational Water Resources StrategyPFAprobabilistic flood analysisRCPrelative concentration pathwaysRI rainfall intensityRI recurrence intervalRSARepublic of South AfricaSANBISouth African National Biodiversity InstituteSANCOLDSouth African National Committee on Large DamsSANRALSouth African National Roads Agency LimitedSFRstream flow reductionUCE Unconstrained EmissionsUKMUnited Kingdom Met Office, Hadley Centre coupled model, version 3 (UKMO-HadCM3)WCWSSWestern Cape water supply systemWMAwater management areaWR2005Water Resources 2005WR90Water Resources 1990WRCWater Research CommissionWRYMWater Resources Yield ModelWSAMWater Situation Assessment ModelWSUDwater sensitive urban designLTA S: DI SA STER RI S K REDUCTION AND MANAGE MENT7
AcknowledgementsThe Long-Term Adaptation Flagship ResearchProgramme (LTAS) responds to the South AfricanNational Climate Change Response White Paperby undertaking climate change adaptation researchand scenario planning for South Africa and theSouthern African sub-region. The Department ofEnvironmental Affairs (DEA) is leading the processin collaboration with technical research partner theSouth African National Biodiversity Institute (SANBI)as well as technical and financial assistance from theGesellschaft für Internationale Zusammenarbeit(GIZ).DEA would like to acknowledge the LTAS Phase 1 and2 Project Management Team who contributed to thedevelopment of the LTAS research and policy products,namely Mr Shonisani Munzhedzi, Mr Vhalinavho Khavhagali(DEA), Prof Guy Midgley (SANBI), Ms Petra de Abreu,Ms Sarshen Scorgie (Conservation South Africa), DrMichaela Braun, and Mr Zane Abdul (GIZ). DEA wouldalso like to thank the sector departments and otherpartners for their insights to this work, in particular theDepartment of Water Affairs (DWA), Department of8Agriculture, Forestry and Fisheries (DAFF), NationalDisaster Management Centre (NDMC), Department ofRural Development and Land Reform (DRDLR).Specifically, we would like to extend gratitude to thegroups, organisations and individuals who participatedand provided technical expertise and key inputs to the“Climate Change Adaptation: Perspectives for DisasterRisk Reduction and Management in South Africa” report,namely Dr. James Cullis (Aurecon), Prof. André Görgens(Aurecon) Anton Cartwright (Econologic), Prof. RESchulze, RP Kunz, TG Lumsden, and NS Davis (Centreof Water Resources Research, University of KwazuluNatal). Additional modelling support was provided byDavid Townsend, Louis Dobinson, Peter Wilson andSheena Swartz from Aurecon.Furthermore, we thank the stakeholders who attendedthe LTAS workshop held at the Sun International Hotelon 22-24 January 2014 for their feedback and inputs onproposed methodologies, content and results. Theircontributions were instrumental to this final report.LTA S: DI SA STER RI S K REDUCTION AND MANAGE MENT
Report overviewThis report provides initial quantitative estimates of risksrelated to extreme events based on a provisional modelof potential impacts under a range of possible climatefutures to inform adaptation scenarios for the disasterrisk reduction and management (DRRM) sector of SouthAfrica including droughts, floods, sediment and sea levelrise that complements other LTAS reports. A mixtureof empirical and biophysical modelling techniques havebeen employed to give a first indication of potential risksassociated with floods, droughts, sediment loads andsea level rise during the course of this century under aselection of available climate models.Section 1 gives a brief background and introduction tothe study.municipal infrastructure, private real estate and tourismare described in Section 3.5.A brief discussion of potential adaptation options fordroughts, floods, sediment and sea level rise is given inSection 4. This includes a short summary of some crosscutting and “no regrets” options.Recommendations for further research, the need formore regional downscaling, issue specific studies, and therefinement and modelling of specific adaptation optionsare given in Section 5.Finally, Section 6 presents some general conclusions andrecommendations for the way forward.Section 2 presents an overview of the generalmethodologies applied in this study including a briefdiscussion of the climate scenarios used (2.1), and theapproach to provisional modelling of these climate changeimpacts on droughts (2.2), floods (2.3), sediment loads(2.4) and sea level rise (2.5).The results are then presented in Section 3 with respectto the potential impacts of relevance for disaster risk inSouth Africa. The impacts on the frequency, severity andduration of droughts are discussed in Section 3.1 includingmeteorological, hydrological, agricultural, and watersupply droughts. Spatial and temporal impacts of climatechange on flood magnitudes are discussed in Section3.2. These results are also interpreted in terms of thepotential increase in flooding risks for key infrastructureacross the country including bridges, dams and powertransmission line river crossings. The potential impactsof climate change in terms of total sediment yields arediscussed in Section 3.4 and interpreted in terms of thepotential impact on reduced storage capacity of dams.The results of the analysis of areas
environmental affairs Environmental Affairs Department: REPUBLIC OF SOUTH AFRICA . 2 lTAS: DISASTER RISK REDUCTION AND MANAGEMENT TAbLE Of CONTENTs LIsT Of fIGurEs 4 LIsT Of TAbLEs 5 LIsT Of AbbrEvIATIONs 6 ACkNOWLEDGEMENTs 8 rEPOrT OvErvIEW 9 ExECuTIvE suMMAry 10 1. INTruCTIONOD 12 1.1. Modelling in Support of Disaster Risk Reduction in South