Transcription
When is P2P Technology Beneficial for IPTV Services?Yih-Farn Chen, Yennun Huang, Rittwik Jana, Hongbo Jiang, Michael Rabinovich,Bin Wei, and Zhen Xiao ABSTRACTThis paper studies the conditions under which peer-to-peer(P2P) technology may be beneficial in providing IPTV services over typical network architectures. It has two majorcontributions. First, we contrast two network models usedto study the performance of such a system: a commonly usedlogical “Internet as a cloud” model and a “physical” modelthat reflects the characteristics of the underlying network.Specifically, we show that the cloud model overlooks important architectural aspects of the network and may drasticallyoverstate the benefits of P2P technology by a factor of 3 ormore. Second, we provide a cost-benefit analysis of P2Pvideo content delivery focusing on the profit trade-offs fordifferent pricing/incentive models rather than purely on capacity maximization. In particular, we find that under highvolume of video demand, a P2P built-in incentive model performs better than any other model for both high-definitionand standard-definition media, while the usage-based modelgenerally generates more profits when the request rate is low.The flat-reward model generally falls in-between the usagebased model and the built-in model in terms of profitability.Keywords : IPTV, P2P streaming, Content distributionnetwork, FTTN, Video-on-Demand.1. INTRODUCTIONInternet protocol TV (IPTV) promises to offer viewers aninnovative set of choices and control over their TV content.Two major U.S. telecommunication companies, AT&T andVerizon, have invested significantly to replace the copperlines in their networks with fiber optic cables for deliveringmany IPTV channels to residential customers.A viewer can receive IPTV videos in good quality if the Yih-Farn Chen, Rittwik Jana, and Bin Wei are with AT&TShannon Research Laboratory; Y. Huang is with the Institute for Information Industry, Taiwan; H. Jiang and M. Rabinovich are with Case Western Reserve University; Z.Xiaois with IBM T. J. Watson Research Labs. The contact author is Yennun Huang: yennunhuang@gmail.com.Permission to make digital or hard copies of all or part of this work forpersonal or classroom use is granted without fee provided that copies arenot made or distributed for profit or commercial advantage and that copiesbear this notice and the full citation on the first page. To copy otherwise, torepublish, to post on servers or to redistribute to lists, requires prior specificpermission and/or a fee.NOSSDAV ’07 Urbana, Illinois USACopyright 2007 ACM 978-1-59593-746-9/06/2007 . 5.00.available bandwidth satisfies the need of video encoding ratefor the target resolution and frame rate. To provide sufficient bandwidth for IPTV services, Internet service providersuse high speed xDSL or cable networks to deliver video content to viewers’ set-top boxes. As an example, AT&T LightSpeed is using Fiber-to-the-Neighborhood (FTTN) Networks.Its architecture consists of a small number of national super head-ends (SHE) and a large number of local video huboffices (VHO). The super head-ends serve as the nationalcontent aggregation points for broadcast and video on demand encoding. The local video hub offices provide aggregation and storage of local content. Each video hub officeserves as a Video-On-Demand (VOD) library and distributesvideo content through local access switches to the customers.We refer to this network hierarchy as the “physical” modelthroughout the paper. FTTN networks can provide 2025Mbps bandwidth to each household, which is typicallyenough to support several high quality TV streams as wellas high speed Internet and Voice over IP (VoIP) services.A significant problem in providing IPTV services is itshigh deployment and maintenance cost. In addition, thecapacity of the video servers can quickly become a bottleneck. One solution to alleviate the load on servers isto use peer-to-peer (P2P) systems like Skype [15] or Kontiki [10]. While early P2P systems were mostly used forfile downloading, recently there have been several efforts onusing the peer-to-peer approach to support live streaming[16][17][5][2][3][11] and VOD streaming[14][7][13][6]. Existing research studies that evaluate the benefits of P2P videocontent delivery typically do not consider the constraints ofthe underlying service infrastructure (e.g., [12][18]). Rather,they view the network as a “cloud”. Researchers, however,are increasingly aware of the need to reduce cross-ISP P2Ptraffic, while maintaining satisfactory P2P performance[4].In this paper, we reveal the deficiency of this cloud modeland investigate when P2P streaming can be beneficial in anIPTV environment. As we will see, P2P video sharing canbe harmful under certain network conditions.Another challenge for P2P streaming in an IPTV environment is the pricing strategy. Most broadband ISPs todaycharge a flat fee for providing bandwidth. Usage-based pricing has emerged in some markets but even in those cases itis limited to volume-based pricing. Among the limited earlywork on pricing strategies for P2P, Adler, et al. [1] provided a comprehensive model applicable to a variety of P2Presource economies. Implementation of peer selection algorithms in realistic networking models like the IPTV environment was not addressed. Hefeeda et al. presented a cost-
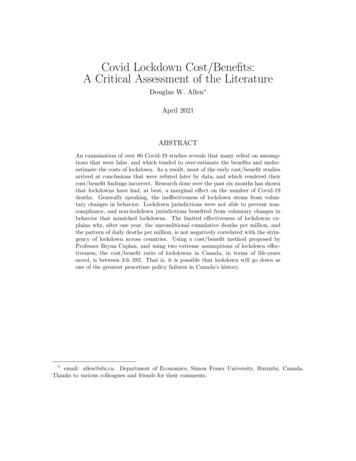
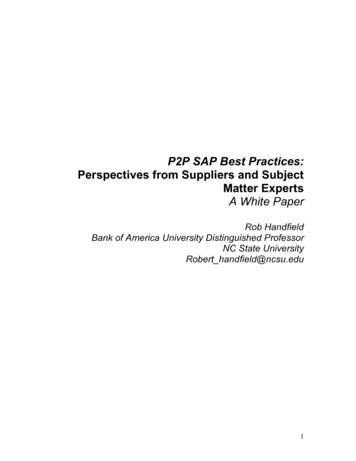
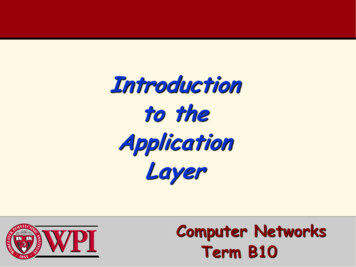
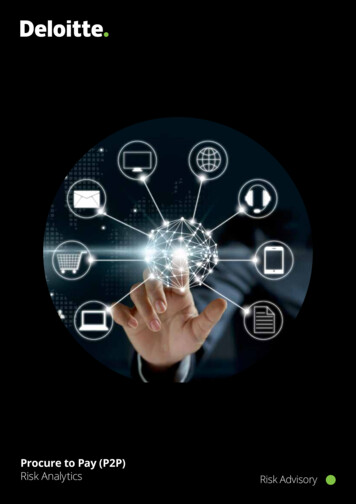
Figure 1: Cloud Modelprofit analysis of a P2P streaming service for heterogeneouspeers with limited capacity [8]. The analysis shows thatthe service provider can achieve more profit by providingthe appropriate incentives for participating peers. However,their analysis did not consider the bandwidth constraintsof the underlying infrastructure and hence cannot be easilyextended to our IPTV environment.We make the following contribution in this paper: We compare two network models (the “cloud” modeland the “physical” model) and show that the cloudmodel can dramatically overestimate P2P benefits bya factor of 3 or more. We couple three P2P pricing models (flat-fee, usagebased, and built-in) with a “physical” model and studytheir trade-offs from a profit perspective.The rest of the paper is organized as follows. We describethe physical network model and constraints for the IPTVsystem in section 2. Section 2.3 provides the insights as towhy a more accurate physical network model is necessaryto realize a profitable IPTV system. Three different pricingmodels are analyzed and simulated in section 3. Section 4provides a conclusion and potential future work.2. NETWORK MODELSThis section contrasts two network models that can beused in studying the performance of P2P video content delivery.2.1 Cloud ModelResearch in P2P streaming typically considers Internetat a logical level[12][18]: it represents the Internet at largeas an abstract cloud and only considers the capacity of thecontent server and the characteristics of the access links torelated hosts. We refer this view of the Internet as the “cloudmodel” as shown in Figure 1.2.2 Physical ModelIn contrast to the cloud model, the physical model considers the network architecture and bandwidth constraintsof the underlying links and network devices. In [9], we described and analyzed the physical model of FTTN accessnetworks for IPTV services. The model and analysis canalso be applied to xDSL or Cable connections.Figure 2: Physical Model for IPTV ServiceAs shown in Figure 2, video streaming servers are organized in two levels - a local video hub office (VHO), whichconsists of a cluster of streaming servers or proxies to serveviewers directly, and national super head end (SHE) offices,which can distribute videos to local serving offices based onexisting policies or on demand. We concentrate on videoon demand (VOD) in this paper. Each local VHO office(often referred to as “local office” below) connects to a setof access switches such as xDSL, FTTN or Cable switchesthrough optical fiber cables. Each switch connects a community of IPTV service customers through twisted-pair copperwires, fibers or coaxial cables. A community consists of allhomes which are connected to the same access (xDSL or Cable) switch. A local VHO also includes a service router toconnect to a national SHE office. These uplinks (or “northbound links”) of local offices are implemented over highspeed optical fiber networks.The following parameters are used throughout the paper: B0D : Download bandwidth into a home. B0U : Upload bandwidth out of a home. B1S : Total capacity of south-bound links (downlinks)of a local access switch. B1N : Capacity of the north-bound link (uplink) ofan access switch determined by the total bandwidthof north-bound fibers from a switch to a local VHOand the switching capacity of the service router in theVHO. B2S : Maximum throughput in a local VHO determined by capacities of service routers, optical networkcables and/or streaming servers in the VHO. u: Average streaming bit rate for a video. N : Maximum number of concurrent viewers supportedby a local VHO.As an example, AT&T LightSpeed network allocates 20 to25M bps download bandwidth (B0D 25M bps) and 1M bpsupload bandwidth (B0U 1M bps) to each home. LightSpeed uses an FTTN switch which has a maximum of 24Gbpsdownlink (or “south-side”) switching capacity (B1S 24Gbps).Each FTTN switch can connect an OC-24 fiber to a servicerouter in a local VHO (B1N 1.244Gbps). The servicerouter in a local VHO could then connect an OC-192 fiberto national SHE offices. Each high-definition (HD) channeluses 6Mbps bandwidth and each standard-definition (SD)channel uses 2Mbps bandwidth.
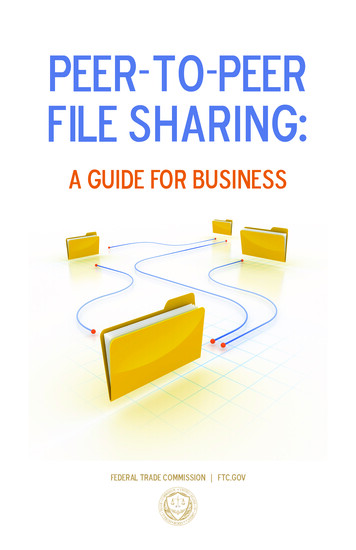
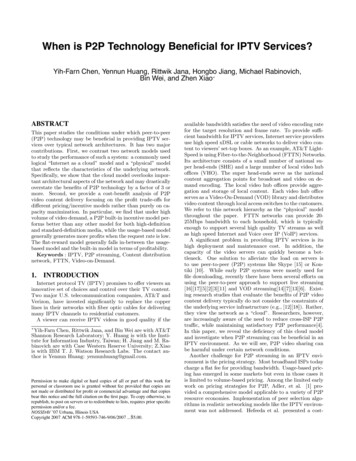
2.3 Network Constraints under Physical ModelIn a physical network environment, all P2P upload traffic has to traverse through the access switches and servicerouters that connect the peers. As a result, P2P streamingwill increase the load of access switches, local offices andnational offices.Compared with the conventional IPTV services, P2P sharing within a community may not be beneficial if the southbound link bandwidth of an access switch is the bottleneck.However, P2P sharing within a community decreases theload on the north-bound link of an access switch. Therefore,P2P sharing within a community will have the most benefitif the infrastructure bottleneck is on the north-bound linkbandwidth of an access switch.Similarly, P2P sharing among peers across communitiesincreases the traffic on both the north-bound links and thesouth-bound links of access switches. If the network bottleneck is in either B1N or B1S , P2P sharing among peersin all communities creates more congestion for the switchesand decreases the number of concurrent viewers which canbe served by a local office. In this case, P2P sharing acrosscommunities is not beneficial for IPTV service providers.Also, if an IPTV service provider can apply content distribution network (CDN) technologies such as caching andreplication to reduce the workload in SHE, the benefit ofP2P sharing across communities in a VHO is very limited.The detailed analysis of network constraints for P2P IPTVservices can be found in [9].3. NETWORK AT THE PHYSICAL LEVELA key insight of this paper is that using the “cloud model”for P2P streaming is over simplistic and misleading. Morereliable results can be obtained by considering the networkat the physical infrastructure level. To demonstrate ourpoint, consider the following simple P2P algorithm. Thecontent server receives a request for a video, identifies candidate peers with that video and spare upload capacity, andselects a random set among them to collectively serve thevideo. If not enough candidates are available to serve thevideo at its encoding rate, the server tries to serve the remaining portion itself, or denies the request if it cannot.We simulated the performance of the system under thetwo models. For the physical model, we used a slice of theinfrastructure of Figure 2 corresponding to one local officewith 20 communities and considered the situation where thecontent server in the local office distributes video content tothe viewers in these communities. For the cloud model, weassume the same content server and viewers are connectedvia the Internet cloud. We assume the same behavior forevery node in the community: an idle user (i.e., the user notviewing a stream already) requests a stream with probability of 2% every time tick. A time tick occurs every minute.A peer may download only one stream at a time. Thereare 1000 video programs available for viewing. When a peerissues a request, it selects a program according to Zipf’spopularity distribution. Each stream lasts 120 minutes andhas a data rate of 6Mbps.1 Once downloaded, the programremains available at the peer for a period called the streamtime-to-live (stream TTL) with a default value of 1000 minutes. A peer may be turned off and on by its user. An1The HD stream encoding rate is constantly improving andwe expect it to reach 6Mbps soon.operational peer is turned off with probability 0.1% on every time tick, and a non-operational peer is turned on withprobability 0.5% on every tick. This means that on averageevery peer stays on five times longer than it stays off. Wefurther assume that B1N 0.622 G (OC-12), and B2S 10G. Each data point in the graphs throughout the paper isobtained by running the simulation program over 5000 timeclicks and taking the average over the last 2500 time ticks(when the system reached a steady state in all the simulations).The results for the cloud and physical models are shownin Figure 3. The figure also includes curves for the systemthat does not use P2P delivery under the physical model.Figure 3a shows the average number of concurrent viewersthe system can support as the number of peers grows forfixed network and server capacities. The cloud model indicates that P2P delivery allows the system to serve moreconcurrent viewers and to scale to the growing number ofviewers. However, the result is drastically different whenthe limitations of the physical infrastructure are broughtinto the picture. In fact, the cloud model could overestimate the benefit by a factor of 2 when there are more than800 peers in a community as shown in Figure 3a. Not onlydoes the P2P system serve fewer users, it does not scale witha growing number of users and has only a slight capacity advantage over the much simpler centralized delivery (whichin fact turns to slight disadvantage for other parameter settings as seen in Figures 3b and 3c). The reason behind thisdrastic change is the limitations of B1N , the links betweenthe local office and individual access switches. When P2Pdelivery occurs across different communities, two of theselinks are traversed: one upstream from the serving peer tothe local office, and the other downstream from the localoffice to the receiving peer. Overall, these links are moreheavily utilized under P2P delivery and more requests aredenied.Now consider the number of concurrent viewers undervarying capacity of the office-to-access-switch link (Figure 3b),when the community size is fixed at 500 viewers. The resultsfor the cloud model are not affected by this link since themodel does not consider it. However, the physical model reveals an important trend: the centralized delivery becomesquickly bottlenecked at the server and stops responding tothe growing bandwidth of the office-to-access-switch link.On the other hand, with P2P delivery, improvement in thislink’s capacity produces a roughly linear growth in the number of concurrent viewers served, at least within the bandwidth range studied.More differences are seen when we increase the server capacity instead (Figure 3c). In this case, the cloud modelquickly reaches the point where it serves all requested streamsand stops being affected by the increase in server capacity. In particular, this result might indicate that it is highlybeneficial to increase the server capacity from 10 Gbps to20 Gbps. Under physical model, however, the number ofconcurrent viewers is unaffected by this change. Thus, theabove investment would be useless under the simple algorithm we are considering. Comparing the P2P and centralized delivery under the physical model, the centralized delivery benefits from increased server capacity until it reaches20 Gbps, after which the bottleneck shifts to the office-toaccess-switch link. However, this bottleneck transpires laterthan in the P2P case. Overall, Figure 3 shows that de-
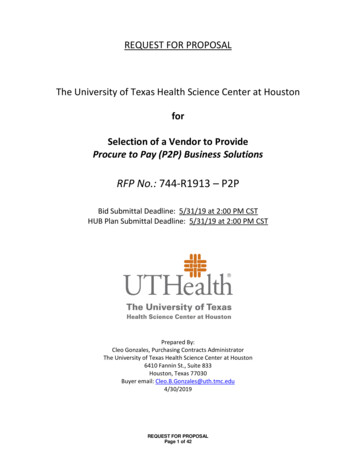
cloud modelphysical modelw/o p2p50004000300020001000100200 300 400 500 600 700the number of peers in each community8005000total # of concurrent viewers in all communitiestotal # of concurrent viewers in all communitiestotal # of concurrent viewers in all communities6000cloud modelphysical modelw/o p2p4000300020001000000.20.40.60.81B1N capacity (Gbps)1.27000cloud modelphysical modelw/o p2p600050004000300020001000001.4(a) Concurrent capacity vs. number of (b) Concurrent capacity vs. bandwidth ofusersthe office-to-access-switch link1020 30 40 50 60 70 80Local office capacity (Gbps)90 100(c) Concurrent capacity vs. servercapacityFigure 3: Cloud vs. physical model comparison4.1 Maximum Benefit for Conventional IPTVLet r be the fee paid by a viewer in a time unit (e.g.hours or days) for video streaming services. For conventionalIPTV services, the maximum revenue in a local office pertime unit isRmax rNwhere N represents the total number of viewers supportedby a local office - with or without P2P incentives.The maximum profit per time unit, Pnop2p , isPnop2p maximum income IP T V expenses rN Enop2pwhere Enop2p is the capital and operation expenses of theIPTV services per time unit.4.2 P2P Incentive ModelsTo encourage P2P sharing among viewers, we considerthree incentive models: Built-in model, Flat-reward modeland Usage-based model.4.2.1Figure 4: Profit per unit time in the no-P2P modeland the three incentive models under varying B1Nand B1S capacities (this figure should be viewed incolor)pending on whether or not the network operator plans touse P2P delivery, they should focus their investment on theoffice-to-access-switch link bandwidth or spread it betweenboth server and office-to-access-switch link capacities. Thesetrade-offs cannot be revealed under the conventional cloudmodel.4. COST-BENEFIT ANALYSISIn order to encourage viewers to make their set-top boxesavailable for P2P sharing, some incentive may be given topeers who upload videos to other peers. This section analyzes the cost and benefit of deploying P2P technology on aphysical network and compares its maximum possible profitto that of a conventional IPTV service.Built-in ModelIn this model, every set-top box includes P2P streamingsoftware by default. Hence, P2P sharing is hidden from theviewers. The maximum profit per time unit isPb rN Ep2pwhere Ep2p is the total operation and capital expenses pertime unit for providing P2P IPTV services. It should begreater than Enop2p because P2P software needs to be installed on servers and clients and hence will increase the costof the infrastructure. Let’s assumeEp2p Enop2p Ap2pwhere Ap2p includes the additional software license and maintenance fees paid for P2P software and of additional hardware (such as disk storage). In the built-in model, we assumethat the recurring software licence and maintenance fees andthe amortization of additional hardware results in each settop box costing t dollars extra per time unit. Therefore,Ap2p tN . Then,Pb rN Enop2p tN
Flat-reward ModelIn this model, a viewer signs up for the video sharingfeature for a flat reward. Assume w% of viewers in a community sign up for video sharing and the reward is d dollarsper time unit. The total number of viewers supported by alocal office is denoted to be N as before. The maximum costof incentive per time unit for the office is dwN . Each peerwho signs up for the sharing needs to install and activatethe P2P software on her set-top box. We assume that a service operator incurs the P2P software license fee only for theset-top boxes which activate the P2P software. Therefore,Ep2p equals Enop2p twN . The maximum profit per timeunit in this model isPf total income expenses incentiverN Ep2p dwNrN Enop2p twN dwN1400012000In this model, a viewer who signed up for P2P sharingwill get credit based on the number of bytes uploaded fromits set-top box. Let q be the credit per bit uploaded froma viewer’s set-top box and T be the length of a time unitin seconds. The number of bits uploaded from peers forP2P IPTV services in T seconds is T ubN , where bN is thenumber of viewers downloading videos from peers amongall N viewers in a local office and u is the average videostreaming rate. The IPTV service provider gives incentivesto these supporting peers based on their contributed bandwidth. In this model, the total reward given by an IPTVservice provider to peers in a local office per time unit isqT ubN . The maximum income per time unit in this modelisPs rN Ep2p qbuT N rN Enop2p tN qbuT NAs an example to compare the maximum profit per timeunit under the conventional, no-P2P model and the threeincentive models, we assume that each viewer pays 3 dollars to watch a movie (r 3) and each movie lasts about twohours (T 7200 seconds). With download bandwidth B0Dof 22Mbps, upload bandwidth B0U of 1Mbps, and HDTVstreaming rate u of 6Mbps, each HD movie consumes 43.2Gbor 5.4GB and will require six streams from peer nodes forP2P delivery. We further assume that the capital/software/operational cost of each office is 100 million per year andthe additional cost of incorporating P2P software and hardware (disk storage) on each set-top box per time unit is 10cents. We assume that B2S 50Gbps. Note that B2S isalso constrained by the total streaming throughput from theserver, which is about 10Gbps.We can now plot the profit per unit time for the conventional model vs. various incentive models of VOD serviceswith varying B1S (1-30Gbps) and B1N (1-10Gbps) capacities, as shown in Figure 4. The maximum number of concurrent users are estimated according to a linear optimizationprogram as discussed in [9]. In Figure 4, upper bounds forN are used to illustrate the profit capacity surfaces. Typicalvalues of w 0.5, t 0.1, q 0.01 per Gb, and d 0.02600020000100200 300 400 500 600 700 800the number of peers in each communityFigure 5: Profit comparison of different incentivemodels with varying number of peers800070006000built-in modelflat-reward modelusage-based model (server-first)usage-based model (peer-first)w/o p2p5000profit ( )Usage-based model80004000In general, w depends on d: increasing d will increase thepercentage of viewers willing to share videos and hence increase w.4.2.3built-in modelflat-reward modelusage-based model (server-first)usage-based model (peer-first)w/o p2p10000profit ( )4.2.2400030002000100000.0050.010.015request rate0.02Figure 6: Profit comparisons of the various incentivemodels under different request rateswere used to estimate these capacities. The profit numberramps up faster for the built-in model (with a given B1N )compared to the no-P2P model as we increase the bandwidth of B1S until it reaches a plateau. Such analysis helpsus identify where the focus of the investments should be inincreasing the overall profits. Given a fixed B1S beyond certain capacity, ramping up the capacity of B1N appears toadd profit to the no-P2P model linearly since it allows moreusers in each community without relying on the P2P technology. Note that substantial investment may be neededto increase the B1N capacity, which is not reflected in thisgraph.4.3 Maximizing Profit Using MediaGrid AlgorithmMediaGrid algorithm [9] is a P2P sharing algorithm whichselects peers for streaming or download based on physicalnetwork conditions. To study the benefit of P2P technologyfor an IPTV service provider under various incentive models, we performed an event-driven simulation study usingthe MediaGrid algorithm, with an additional enhancementallowing the stream delivery to be split between the officeand peers (the original algorithm allowed split delivery onlyin the aftermath of peer failures). Based on the analysisin section 2, which shows that the benefit of P2P sharingamong peers in different communities is very limited [9], weonly consider P2P sharing within a community and simulatea system comprised of the local office and one community.We use two variations of the MediaGrid P2P sharing algo-
rithm for the simulation: The “peer-first” MediaGrid algorithm where peers areselected whenever the requested video can be servedby peers. The “server-first” MediaGrid algorithm where peersare selected only when the VOD server in a VHO isoverloaded.We assume the same simulation model as described in section 2.3, using the physical network model. We assume thatviewing each movie costs 3 (even if it is viewed from thelocal cache), peer incentive in the flat-reward model is 2.5cents per time unit (120 minutes), and peer incentive in theusage-based model is 1 cent per upload minute. Figure 5shows the profit numbers under the conventional no-P2Pmodel and the three incentive models for different community sizes. As the number of peers increases, all P2P incentive models clearly generate more profit than the no-P2Pmodel, because of the increased system capacity due to P2Pcontent delivery. However, we see large differences amongthe incentive models. In fact, the usage-based model underperforms the no-P2P model for small communities because itmay utilize (hence, compensate) peers even when the serverhas spare capacity (even in the server-first algorithm, once apeer starts uploading the stream, it continues to do so for theduration of the movie regardless of the server load). In theusage-based model, the server-first strategy generates moreprofits for small communities since it avoids making incentive payments to peers whenever possible. As the numberof users increases, the server becomes fully utilized in bothapproaches and their profits converge. Finally, the built-inmodel always generates more profits than the other incentivemodels. The reason is that at the request rate used in thisexperiment (equal to 0.02 or one request every 50 minutesfrom idle viewers), the system is sufficiently utilized for thebuilt-in model to amortize its investment on the additionalhardware and software.What happens when the system is under-utilized? Figure6 shows the effect of lower request rates on profit, for a fixedcommunity size of 200 viewers. As Figure 6 reveals, whenthe request rate is low, no-P2P model is actually slightlymore profitable than all P2P models except for the usagebased model with the server-first strategy. The latter stayscompetitive since very few payments have to be made. Oncethe request rate picks up, the flat-reward model and thebuilt-in model become more profitable since they enjoy theP2P benefits without making additional payments, whilethe usage-based models fall behind. In fact, the server-firstprofits decrease to converge with the peer-first model. Thisis due to the fact, that as the server utilization increases,the server-first strategy serves additional movies from thepeers, and peer incentives for these movies (which can reach 7.20 for a fully peer-delivered movie under our paramters)can exceed the viewing revenue ( 3).5. CONCLUSIONSThis paper studied the conditions under which P2P technology may be beneficial in providing IPTV services. Weshow that the cloud model may drastically overstate thebenefits of P2P video content delivery. Thus, one must consider physical network infrastructure to obtain more reliableresults. Finally, we provide a cost-benefit analysis for different pricing/incentive models. In summary, P2P may notbe beneficial for IPTV services unless we employ properlyengineered algorithms and incentive strategies as discussedin this paper.6. REFERENCES[1] M. Adler, R. Kumar, K. Ross, D. Rubenstein, T. Suel,D. Yao, Optimal peer selection for p2p downloading andstreaming, Proc. of INFOCOM 2004.[2] S. Banerjee, Bobby Bhattacharjee, and C.Kommareddy, Scalable application layer multicast, inProc. of ACM SIGCOMM 2002.[3] Mayank Bawa, Hrishikesh Deshpande, HectorGarica-Molina, Transience of Peers and StreamingMedia, in ACM SIGCOMM ComputerCommunications Review, January, 2003.[4] R. Bindal, P Cao, W. Chan, J. Medved, G. Suwala, T.Bates, A. Zhang, Improving Traffic Locality inBitTorrent via Biased Neighbor Selection, in Proc. ofICDCS, 2006.[5] H. Deshpande, M. Bawa and H. Garcia-Molina,Streaming Live Media over a Peer-to-Peer Network,Stanford database group technical report (2001-20),Aug. 2001.[6] Yang Guo, Kyoungwon Suh, Jim Kurose, and DonTowsley, A Peer-to-Peer On-Demand Streaming Serviceand Its Performance Evaluation, in Proc. of IEEE Int.Conf. on Multimedia Expo (ICME’03), 2003.[7] Yang Guo, Kyoungwon Suh, Jim Kurose, Don TowsleyP2Cast: P2P Patching Scheme for VoD Service, inProc of 12th WWW, 2003.[8] M. Hefeeda and A. Habib and B. Bhargava, Cost-profitanalysis of a peer-to-peer media streaming architecture,Technical report, CERIAS TR 2002-37, PurdueUniversity, June 2003.[9] Y. Huang, Y. Chen, R. Jana, H. Jiang, M. Rabinovich,A. Reibman, B. Wei, and Z. Xiao, Capacity Analysis ofMediaGrid: a P2P IPTV Platform for Fiber to theNode Networks, in IEEE Journal on Selected Areas inCommunications special issue on Peer-to-PeerCommunications and Applications, January 2007.[10] Kontiki - www.kontiki.com[11] X. Liao, H. Jin, Y. Liu, L. M. Ni, D. Deng, AnySee:Peer-to-Peer Live Streaming, in Proc. of IEEEINFOCOM, 2006.[12] V. N. Padmanabhan, H. J. Wang, P. A. Chou, and K.Sripanidkulchai, Distributing Streaming Media ContentUsing Cooperative Networking, ACM NOSSDAV, May2002.[13] Stefan Saroiu, P. Krishna Gummadi, and Steven D.Gribble, A measurement study of peer-to-peer filesharing systems, in Proc. of ACM/SPIE on MultimediaComputing and Networking (MMCN’02), January2002.[14] Simon Sheu, Kien A. Hua, Wallapak Tavanapong,Chaining: A Generalized Batching Technique forVideo-on-Demand Systems, in Proc. of the IEEE Int’lConf. On Multimedia Computing and System, June1997.[15] Skype -www.skype.com[
A viewer can receive IPTV videos in good quality if the Yih-Farn Chen, Rittwik Jana, and Bin Wei are with AT&T Shannon Research Laboratory; Y. Huang is with the Insti-tute for Information Industry, Taiwan; H. Jiang and M. Ra-binovich are with Case Western Reserve University; Z.Xiao is with IBM T. J. Watson Research Labs. The contact au-