Transcription
2022Pennsylvania State GovernmentWorkforce StatisticsTom Wolf, GovernorMichael Newsome, Secretary of Administrationwww.workforcereport.oa.pa.gov
STATE GOVERNMENT WORKFORCE STATISTICSTable of Contents (1 of 2)Executive SummaryExecutive Summary . .3Overall ComplementTotal Employment . . .Union/Management Status . .Employment by Job Category . Top 25 Employee Classifications . . Trend of Filled Salaried and Wage Positions. . .Historical Filled Salaried and Wage Positions . . .Criminal Justice Agencies and Human Services - Ten Year Comparative Complement. . .Separation Rates by Union. . . . .Historical Appointments and Separation Trends . .Appointments, Separations, and Promotions by Civil Service/Non-Civil Service . .Appointments by Class Title - Top 25 . .Separations by Class Title - Top 25 . . .456789101112131415FinancialPersonnel Costs (% of Budget) . . Personnel and Benefit Costs . . . Benefit Costs per Employee . . Average Salary by Agency .Average Compensation by Union .Overtime Costs by Agency . Average Paid Leave Days and Costs Usage Per Employee by Union .Overtime Hours by Agency . Average Sick Leave Use and Costs Per Employee by Agency .Historical Average Sick Leave Use .16171820212223242526Agency ComplementEmployment by Agency . . Hires and Separations . .Separation Trends . . . Paid Leave Usage . . . .Filled Salaried and Wage Positions by Agency . .Historical Separation Rates by Agency . .Voluntary Separations During First Five Years of Service by Agency . .Placement by Type and Agency 12728293031323334
STATE GOVERNMENT WORKFORCE STATISTICSTable of Contents (2 of 2)DemographicsDiversity by Agency . . Employment by Ethnicity . . . .Employment by Gender . Age Groups . .Length of Service . . . .Labor Force Compared to State Employment by Minority Group and Gender . .Minority Representation by Agency . .Gender Representation by Agency . .Job Categories by Race and Gender . .Appointments, Separations and Promotions by Ethnicity and Gender . .Age and Length of Service by Union . Minority Group and Gender of Employees by Union . .Age and Length of Service for All Commonwealth Employees . Average Age of New Hires for All Agencies . Average Age and Length of Service for All Agencies . 353839404142434445485051535455GeographyEmployees per 10K Residents . .Employees Average Salary . . Employees by County . . . . .Trend of All State Employment - Eight Most Populous States .56575860GlossaryGlossary . . . 261
STATE GOVERNMENT WORKFORCE STATISTICSJuly 2021Executive SummaryGeneral Pennsylvania StatisticsPennsylvania PopulationPopulationAverage Salary of State WorkersState Employees Per PopulationPennsylvania Labor Force12,783,254 (1)Rank 5th (1)Rank 15th (2)Rank 45th (3)6,302,000 (4)Commonwealth Positions as of June 30, 2021 (5)Number of Full-Time and Part-Time Salaried EmployeesNumber of Full-Time and Part-Time Wage EmployeesSalaried PayrollWage PayrollProfile of Full-Time Salaried Employees as of June 30, 2021 (5)Number of Full-Time Salaried EmployeesAverage AgeAverage Length of Service in YearsAverage Annual SalaryAverage Annual BenefitsAverage Annual Sick Leave DaysPercent Civil ServicePercent Represented by UnionsPercent MinoritiesAnnual Separation RateNotes71,8015,616 4.6 Billion 137 Million71,6064611.3 62,206 46,0678.168.4%80.4%16.0%9.0%(1) "Annual Estimates of the Resident Population for the United States, Regions, States, the District of Columbia, andPuerto Rico", U.S. Census Bureau, Population Division, as of July 1, 2020.(2) "2020 Annual Survey of Public Employment & Payroll", U.S. Census Bureau, as of March 2020 (data is the latestavailable).(3) "2020 Annual Survey of Public Employment & Payroll", U.S. Census Bureau, as of March 2020 and"Annual Estimates of the Resident Population for the United States, Regions, States, the District of Columbia, andPuerto Rico", U.S. Census Bureau, Population Division, as of July 1, 2020.(4) "Monthly Seasonally Adjusted Labor Force, Employment and Unemployment data in Pennsylvania for July, 2021"from PA Department of Labor and Industry, Center for Workforce Information and Analysis.(5) Under the Governor’s jurisdiction only. All data in these sections as of close of business June 30, 2021.3
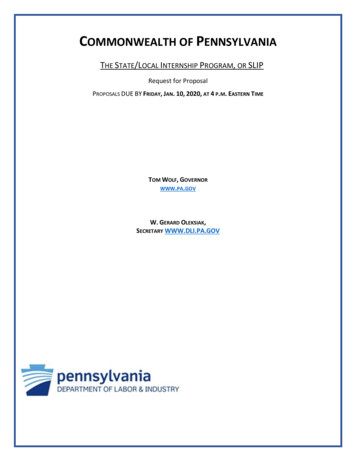
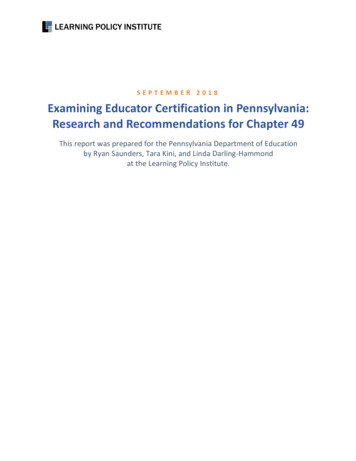
STATE GOVERNMENT WORKFORCE STATISTICS - Overall ComplementTotal EmploymentPart-Time and Full-Time Salaried and Wage EmployeesOver Ninety Years of Change - Filled Salaried and Wage Employees(GAWFR Table 1)July of Each 85,108202171,8015,616SOURCE: Office of Administration Enterprise Systems and Data Analytics Office IRIS.NOTE: Data as of January of each year prior to 1970 because of data availability for earlier years. For all other years, data as ofJuly of each year. In 1968, 10,812 highway maintenance wage positions in the Department of Transportation were transferred tosalaried positions. On July 1, 1983, 8,553 salaried and 90 wage positions were transferred from the Governor's jurisdiction to theState System of Higher Education. In 2020, total numbers of salaried and wage employees were lower overall than prior yearsdue to the impact of COVID-19.COMMENTS: Except for the World War II era, there was a steady growth pattern in the number of filled state jobs from 1930 to1975. The period since 1975 has shown a reversal of that general pattern.4
STATE GOVERNMENT WORKFORCE STATISTICS - Overall ComplementUnion/Management StatusJuly 2021Commonwealth Employment by Union(GAWFR Table 22)UnionRank-and-FileAbbreviationAmerican Federation of State, County, and MunicipalEmployees*-Other AFSCME units-Clerical, Administrative and Fiscal units-Maintenance and Trades units-Human Services units*Total of all employees in the four categoriesAFSCME (Master Agreement/Memorandum)Pennsylvania State Corrections Officers AssociationPSCOA (corrections 4,73613.0%9.6%10.1%6.6%10,297010,29714.4%Local 668 of the Service Employees International Union SEIU Local 668 (social workers)8,1231,2669,38913.1%Pennsylvania State Troopers AssociationPSTA (State Police)4,46004,4606.2%United Food and Commercial WorkersUFCW (liquor store clerks)1,52601,5262.1%Service Employees International Union, HealthcarePennsylvaniaSEIU Healthcare PA (nurses, nonsupervisory)1,20401,2041.7%Independent State Store UnionISSU (liquor store managers)06786780.9%CIVEA (corrections education teachers)30803080.4%FOSCEP (educational and cultural)284223060.4%02262260.3%Correctional Institution Vocational EducationAssociation, PSEAFederation of State Cultural and EducationalProfessionalsOffice and Professional Employees International Union,Healthcare Pennsylvania, Local 112OPEIU (nurse supervisors)United Government Security Officers of AmericaUGSOA (security officers)160291890.3%Fraternal Order of Police, Lodge 114 (wildlifeconservation officers)FOP (wildlife conservation officers)17901790.2%Pennsylvania Doctors AlliancePDA (physicians)129121410.2%Pennsylvania Liquor Enforcement Associations, LiquorLaw Enforcement UnitPLEA (liquor enforcement officers)11001100.2%Fraternal Order of Police, Capitol Police Lodge 85FOP (Capitol Police)Pennsylvania State Rangers AssociationPSRA (DCNR rangers)Fraternal Order of Police, Lodge 114 - Fish and BoatCommission**Local 668 of the Service Employees International Union,Hearing OfficersPennsylvania State Education Association, Hiram G.Andrews CenterCommonwealth Bar Association, Public UtilityCommissionAlliance of Liquor Enforcement SEA (non-tenured teachers)250250.0%CBA (PUC attorneys)230230.0%028280.0%FOP (waterway conservation officers)SEIU Local 668 (unemploymentcompensation referees)ALES (liquor law enforcementsupervisors)Total52,2775,276Non-Union Employees57,553*80.4%6730.9%Management Employees13,38018.7%COMMONWEALTH TOTAL71,606100.0%SOURCE: Office of Administration Enterprise Systems and Data Analytics Office IRIS.NOTE: Includes full-time permanent salaried employees. The primary occupations represented by the union are shown in parentheses. Fiscal year data asof close of business June 30, 2021.**In May 2021, a new bargaining unit was added to the Fraternal Order of Police, Lodge 114 - Fish and Boat Commission.COMMENTS: 80.4 percent of state employees are represented by a union, with AFSCME representing the largest percentage.5
STATE GOVERNMENT WORKFORCE STATISTICS - Overall ComplementEmployment by Job CategoryJuly 2021Distribution of State Government Employees by Occupational Group(GAWFR Table 20)Job ,01419.57%Paraprofessionals1,5442.16%Office and Clerical10,42414.56%Skilled Craft tals71,606100.00%TechniciansProtective Service WorkersSOURCE: Office of Administration Enterprise Systems and Data Analytics Office IRIS.NOTE: Includes full-time permanent salaried employees. Percentages are based on the total number of full-time salariedemployees under the Governor's jurisdiction as of June 30, 2021. Percents shown may not total 100 percent due to rounding.COMMENTS: State employees categorized as Professionals comprise the largest percentage (25.56 percent) of the eightoccupational groupings. Paraprofessionals comprise the smallest percentage (2.16 percent). While the percentages havechanged slightly, the ranking of these two groups has remained consistent over the previous fifteen reporting years.6
STATE GOVERNMENT WORKFORCE STATISTICS - Overall ComplementTop 25 Employee ClassificationsJuly 2021Most Populous Class Titles - Top 25(GAWFR Table 36)Class TitleNumberCorrections Officer 1 .6,415Income Maintenance Caseworker .4,593Transportation Equipment Operator B.3,453State Police Trooper.3,228Clerk Typist 2.1,699Corrections Officer 2.1,095Residential Services Aide*.1,059Clerk Typist 3.929Liquor Store Clerk 1.878Registered Nurse.873State Police Corporal.849Clerk 2.824Parole Agent 2.734Corrections Officer Trainee.734Licensed Practical Nurse.709Income Maintenance Casework Supervisor.698Maintenance Repairman 2.641Clerk 3.573Corrections Officer 3.565Nurse Aide.555Psychiatric Aide.547Liquor Store Clerk 2.526Highway Foreman 2.510Police Communications Operator.484Corrections Food Service Instructor.469SOURCE: Office of Administration Enterprise Systems and Data Analytics Office IRIS.NOTE: Includes full-time permanent salaried employees.COMMENTS: Out of 2,600 different active class titles, 47 percent of the salaried work force (33,640 employees) serve in these 25 most populousclass titles. Of the above listed class titles, 24 were also listed as the most populous class titles in the previous year. The number of classes rankingconsistently with the previous year was 9 out of 25.7
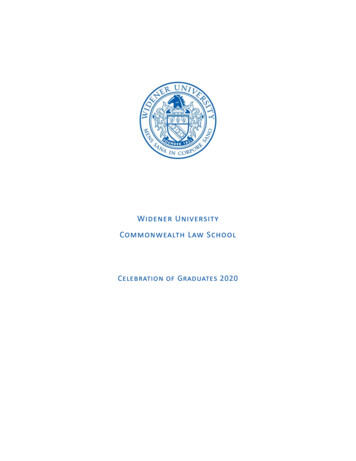
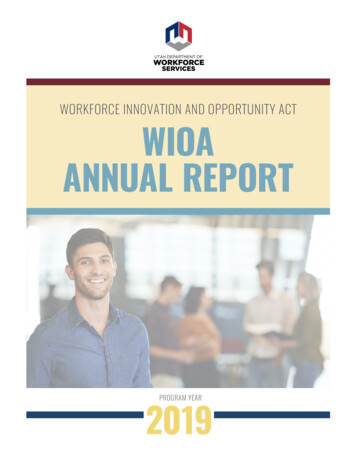
STATE GOVERNMENT WORKFORCE STATISTICS - Overall ComplementJuly 2021The Trend of Filled Salaried and Wage PositionsJuly 1991 to July 2021(GAWFR Table 2)100,000 Filled Wage Positions Filled Salaried 99270,000199175,000NOTE: Includes full-time and part-time filled salaried and wage positions.COMMENTS: On July 1, 2021 there were 71,801 filled salaried and 5,616 filled wage positions. Filled salariedpositions decreased by 619 and filled wage positions increased by 508 from the previous year as of the July 1figures. Total numbers of salaried employees were lower overall than prior years due to the impact of COVID-19.8
STATE GOVERNMENT WORKFORCE STATISTICS - Overall ComplementJuly 2021Historical Filled Salaried and Wage PositionsFiscal Years 1986 to 2021(GAWFR Table 092010201120122013Salaried 72,768Wage 7125,616NOTE: Includes full-time and part-time filled salaried and wage positions. Per diem positions included with wage.COMMENTS: On July 1, 2021 there were 71,801 filled salaried and 5,616 filled wage positions. Filled salaried positionsdecreased by 619 positions from the previous year as of the July 1 figures. Filled wage positions increased by 508 during thesame period. In July 2021, total numbers of salaried employees were lower overall than prior years due to the impact of COVID19.9
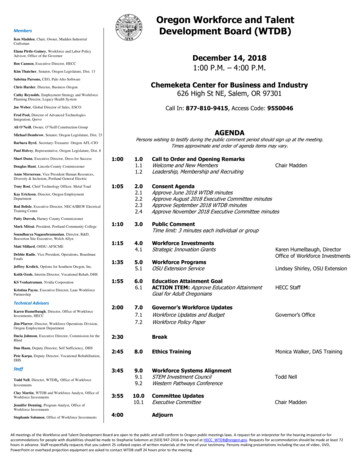
STATE GOVERNMENT WORKFORCE STATISTICS - Overall ComplementJuly 2021Criminal Justice Agencies and Human ServicesTen Year Comparative ComplementJuly 2011 to 2021(GAWFR Table 5)22,538Criminal JusticeAgencies22,16216,511Human 305,00010,00015,00020,000July 201125,00030,00035,00040,00045,000July 2021NOTE: Includes full-time and part-time filled salaried and wage positions. For this table, Criminal Justice Agencies include theDepartment of Corrections, State Police, and Parole Board.10
STATE GOVERNMENT WORKFORCE STATISTICS - Overall ComplementFiscal Year 2020-2021Separation Rates by UnionFull-Time Salaried Employees(GAWFR Table 27)UnionAFSCME (Master Agreement/Memorandum)RetirementsNumber1,302 *ResignationsRateNumber4.6% *1,410 *Rate5.0% *OtherSeparationsNumberRate351 *1.2% *TotalSeparationsNumberRate3,063 *10.9% *-Clerical, Administrative and Fiscal units3354.9%2453.6%560.8%6369.3%-Maintenance and Trades units3795.2%3244.5%911.3%79411.0%-Human Services units2685.7%59012.5%1533.2%1,01121.3%-Other AFSCME units3203.4%2512.7%510.5%6226.7%PSCOA (corrections officers)4904.8%3983.9%1011.0%9899.6%SEIU Local 668 (social workers)2843.0%2803.0%630.7%6276.7%PSTA (state police)1713.8%80.2%50.1%1844.1%SEIU Healthcare PA (nurses, non-supervisory)494.1%12310.2%121.0%18415.3%UFCW (liquor store clerks)724.7%986.4%271.8%19712.9%ISSU (liquor store managers)405.9%131.9%10.1%548.0%CIVEA (corrections education teachers)185.8%41.3%00.0%227.1%FOSCEP (educational and cultural)113.6%51.6%10.3%175.6%OPEIU (nurse supervisors)177.5%156.6%10.4%3314.6%UGSOA (security officers)126.3%1910.1%00.0%3116.4%PDA (physicians)128.5%32.1%10.7%1611.3%FOP (conservation officers)**95.0%10.6%21.1%126.7%FOP (Capitol police)22.2%33.3%22.2%77.7%All Other Unions153.5%92.1%10.2%255.9%Non-Union %9437.0%3,2144.5%2,6123.6%6120.9%6,4389.0%* Average for employees in the four categoriesManagement EmployeesCOMMONWEALTH TOTALNOTE: The above table identifies specific unions representing 100 or more employees. Includes full-time, permanent salaried employees. Otherseparations include furloughs, involuntary separations, and deaths but exclude employees who have completed a temporary or emergency assignment.Data includes both rank-and-file and supervisory units unless otherwise noted.**In May 2021, a new bargaining unit was added to the Fraternal Order of Police, Lodge 114 - Fish and Boat Commission [FOP (conservation officers)].COMMENTS: The highest separation rate in an individual group occurred among AFSCME (Human Services units) primarily due to resignations.11
STATE GOVERNMENT WORKFORCE STATISTICS - Overall ComplementJanuary 2019 to June 2021Full-Time Salaried EmployeesHistorical Appointments and Separation Trends(GAWFR Table 32)Separations Including 21Jun-210RetirementsTotal May-19Mar-19Jan-19Feb-190NOTE: Includes full-time, permanent salaried employees. Appointments include employees returned from furlough.COMMENTS: Over the previous two fiscal years the largest number of separations occurred in June 2019 (858) andwas primarily due to retirements. The smallest number of separations occurred in November 2020 (325). The largestnumber of appointments occurred in September 2019 (579). The smallest number of appointments occurred in April2020 (158) due to the COVID-19 pandemic.12
STATE GOVERNMENT WORKFORCE STATISTICS - Overall ComplementJuly 2021Appointments, Separations, and Promotions by Civil Service/Non-Civil ServiceFiscal Year 2020-2021Full-Time Salaried Employees(GAWFR Table 33)OtherSeparations228 (10.8%)Other pointmentsinto 2,0669.2%Promotionsinto 2,1109.4%Appointmentsinto Separationsfrom NON-CIVIL SERVICE EMPLOYEES(31.5%)Promotionsinto Separationsfrom CIVIL SERVICE EMPLOYEES (68.5%)NOTE: Includes full-time permanent salaried employees. Appointments include employees returned from furlough. Otherseparations include furloughs, dismissals, and deaths. Civil service percents are taken from the average employment of civilservice employees only. Non-civil service percents are taken from the average employment of non-civil service employees only.The numbers and rates of appointments, promotions, and separations were determined by the amount of each type oftransaction processed during the year. Percentages found in the pie charts highlighting the breakdown of separations arecalculated in relation to the total number of that service type's separations. Percentages found above bar graphs are calculatedin relation to the total number of that service type's total number of employees.COMMENTS: During fiscal year 2020-2021, the promotion and separation rates for non-civil service employees were slightlyhigher than those for civil service employees, while the appointment rates for civil service employees were slightly higher thanthose for non-civil service employees.13
STATE GOVERNMENT WORKFORCE STATISTICS - Overall ComplementFiscal Year 2020-2021Full-Time Salaried EmployeesAppointments by Class Title - Top 25(GAWFR Table 37)Class TitleUnionType ServicePSCOAC820Income Maintenance CaseworkerPSSUC294Registered NurseSEIUC208Transportation Equipment Operator AAFSCMEN175Licensed Practical NurseAFSCMEC150Nurse AideAFSCMEB143Clerk Typist 2AFSCMEB118Custodial Worker 1AFSCMEN114Clerk 2AFSCMEB106PSCOAN70Food Service Worker 1AFSCMEN69Aide TraineeAFSCMEC69Civil Engineer TraineeAFSCMEC66Driver License Examiner AssistantAFSCMEC59Maintenance Repairman 2AFSCMEB47Parole Agent 1AFSCMEC45Transportation Contruction InspectorAFSCMEC41Driver License ExaminerAFSCMEC37PSSUC36Transportation Equipment Operator TraineeAFSCMEN34Security Officer 1UGSOAB34Police Communications OperatorAFSCMEN33Automotive MechanicAFSCMEB29Diesel and Construction EquipmentAFSCMEB27Youth Development AideAFSCMEC25Corrections Officer TraineeCorrections Food Service InstructorDisability Claims Adjudicator TraineeNumber of AppointmentsNOTE: Includes all full-time, permanent salaried employees. "C" indicates that positions in this class are civil service-covered, while "N" indicates that theclass is non-civil service. "B" indicates that positions in this class may be either civil service or non-civil service depending upon duties.COMMENTS: Appointments to the Corrections Officer Trainee class account for 19.1 percent of the appointments into salaried positions processed in fiscalyear 2020-2021. Of these 25 class titles with the most appointments, 10 are also among the 25 most populous class titles.14
STATE GOVERNMENT WORKFORCE STATISTICS - Overall ComplementFiscal Year 2020-2021Separations by Class Title - Top 25Full-Time Salaried Employees(GAWFR Table AC254Residential Services AideAFSCMEC226Nurse AideAFSCMEB181Clerk Typist 2AFSCMEB173Licensed Practical NurseAFSCMEC163SEIUC159UFCWC141Transportation Equipment Operator AAFSCMEN128Clerk 2AFSCMEB96PSCOAC87Custodial Worker 1AFSCMEN86State Police TrooperPSTAN83Food Service Worker 1AFSCMEN83Maintenance Repairman 2AFSCMEB69Clerk Typist 3AFSCMEB68Youth Development AideAFSCMEC68Psychiatric AideAFSCMEC59Corrections Food Service InstructorPSCOAN58Corrections Officer 3MGMTC57AFSCMEB53State Police CorporalPSTAN52Liquor Store Clerk 2UFCWC51AFSCMEB51Class TitleCorrections Officer 1Income Maintenance CaseworkerTransportation Equipment Operator BCorrections Officer TraineeRegistered NurseLiquor Store Clerk 1Corrections Officer 2Diesel and Construction Equipment MechanicClerk 3Number ofSeparationsNOTE: Includes all full-time permanent salaried employees. "C" indicates that positions in this class are civil service covered, while"N" indicates that positions in this class are non-civil service covered. "B" indicates that positions in this class may be either civilservice or non-civil service, depending upon the duties.COMMENTS: The Corrections Officer 1 class title had the most separations processed, 7.1 percent of the total in the top 25 categoryin fiscal year 2020-2021. Of the current 26 titles with the most separations, 21 are also among the 25 most populous class titles.15
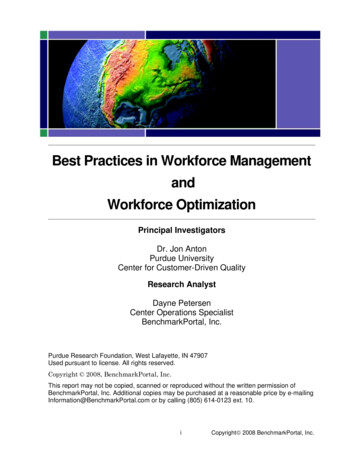
STATE GOVERNMENT WORKFORCE STATISTICS - FinancialPersonnel Costs (Percent of Budget)Fiscal Years 2015-2016 to 2020-2021Personnel Costs as a Percentage of Budget(GAWFR Table 7)Personnel Costs (Percent of Budget)14%Percent of Overall 172017-182018-192019-20 76.4 80.2 81.5 86.5 87.1 98.2 (Billions) 7.7 8.0 8.0 8.2 8.2 8.4 (Billions)4%8.6%2%0%Total BudgetPersonnel Costs2020-21SOURCE: Office of Administration Enterprise Systems and Data Analytics Office IRIS.NOTE: The proposed budget consists of planned expenditures as documented on page B7 of the Governor's Executive Budget. Personnel costsare calculated using payroll and derived benefits costs for full-time permanent salaried employees. The wage payroll and overtime costs for salariedand wage employees are also included as personnel costs.COMMENTS: The percentage of personnel costs to the state budget decreased slightly this fiscal year compared to last fiscal year.16
STATE GOVERNMENT WORKFORCE STATISTICS - FinancialPersonnel and Benefit CostsSince Fiscal Year 2002-2003Historical Average Per Employee State Paid Benefit Costs(GAWFR Table 40)FiscalYearPayrollAverage Total SalaryBenefitsTotal AverageBenefits CostsBenefits as a Percentof AverageTotal Salary2002-03 43,112 13,32830.9%2003-04 42,749 16,30738.1%2004-05 42,504 17,73941.7%2005-06 43,553 19,35344.5%2006-07 45,286 20,92746.2%2007-08 46,113 21,67747.0%2008-09 47,821 22,65747.4%2009-10 49,082 24,91250.8%2010-11 50,598 25,22849.9%2011-12 50,229 26,27652.3%2012-13 51,439 29,49957.4%2013-14 51,432 33,59065.3%2014-15 53,924 38,82972.0%2015-16 53,843 43,36080.5%2016-17 55,727 44,75780.3%2017-18 56,823 45,79380.6%2018-19 58,257 46,24979.4%2019-20 60,390 45,70075.7%2020-21 62,108 46,06774.2%SOURCE: Bureau of Employee Benefits, Office of Administration.NOTE: Costs are on an annual basis by fiscal year (July 1 through June 30). Salaries do not include overtime. State EmployeesHealth Program and Retired Employees Health Program costs are based on agency contributions to the programs.COMMENTS: Total benefit costs rose from an average of 13,328 per employee in 2002-2003 to 46,067 per employee in 20202021. Benefits as a percent of salary increased from 30.9 percent in 2002-2003 to 74.2 percent in 2020-2021.17
American Federation of State, County, and Municipal Employees* AFSCME (Master Agreement/ Memorandum) 25,173 . (nurse supervisors) 0 226. 226 0.3%. United Government Security Officers of America UGSOA (security officers) . Pennsylvania State Rangers Association PSRA (DCNR rangers) 104 0 104. 0.1% Fraternal Order of Police, Lodge 114 - Fish .