Transcription
IDRE Statistical s/efa-spss/1
Introduction Motivating example: The SAQ Pearson correlation Partitioning the variance in factor analysis Extracting factors Principal components analysis Running a PCA with 8 components in SPSS Running a PCA with 2 components in SPSS Common factor analysis Principal axis factoring (2-factor PAF) Maximum likelihood (2-factor ML) Rotation methods Simple Structure Orthogonal rotation (Varimax) Oblique (Direct Oblimin) Generating factor scores2
Motivating example: The SAQ Pearson correlation Partitioning the variance infactor analysis3
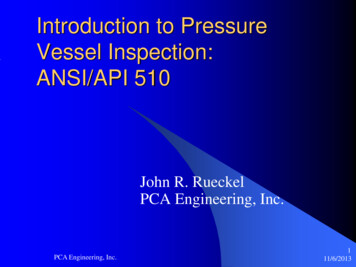
Observed variablesLatent variableAssumption: the correlations among all observed variables can be explained by latent variable4
1.2.3.4.5.6.7.8.I dream that Pearson is attacking me with correlation coefficientsI don’t understand statisticsI have little experience with computersAll computers hate meI have never been good at mathematicsMy friends are better at statistics than meComputers are useful only for playing gamesI did badly at mathematics at school5
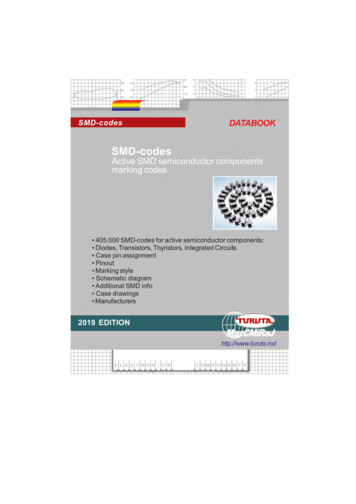
There exist varyingmagnitudes ofcorrelation amongvariablesLarge negativeLarge positive6
Common variance variance that is shared among a set of items Communality (h2) common variance that ranges between 0 and 1 Unique variance variance that’s not common Specific variance variance that is specific to a particular item Item 4 “All computers hate me” anxiety about computers in addition to anxiety about SPSS Error variance anything unexplained by common or specific variance e.g., a mother got a call from her babysitter that her two-year old son ate her favorite lipstick).7
In PCA, there is no unique variance. Common variance acrossa set of items makes up total variance.8
Common variance Due to factor(s)Total variance ismade up of commonand unique varianceUnique variance Due to items9
Factor Extraction Type of model (e.g., PCA or EFA?) Estimation method (e.g., Principal Axis Factoring or Maximum Likelihood?) Number of factors or components to extract (e.g., 1 or 2?) Factor Rotation Achieve simple structure Orthogonal or oblique?10
Principal components analysis PCA with 8 / 2 components Common factor analysis Principal axis factoring (2-factor PAF) Maximum likelihood (2-factor ML)11
Principal Components Analysis (PCA) Goal: to replicate the correlation matrix using a set of components that are fewer innumber than the original set of itemsRecall communality in PCAPC1PC18 variables2 components12
Eigenvalues Total variance explained by given principal componentEigenvalues 0, goodNegative eigenvalues ill-conditionedEigenvalues close to zero multicollinearity Eigenvectors weight for each eigenvalue eigenvector times the square root of the eigenvalue component loadings Component loadings correlation of each item with the principal component Eigenvalues are the sum of squared component loadings across all items for eachcomponent13
Analyze – Dimension Reduction – FactorNote: Factors are NOT the same as Components8 components is NOT what you typically want to use14
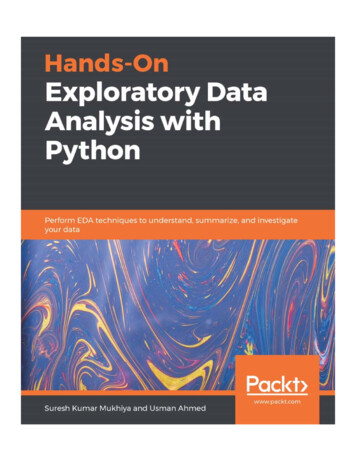
Component loadingscorrelation of each item with the principalcomponentSum of squared loadings acrosscomponents is the communality11111110.6592 0.43443.4% of the varianceexplained by firstcomponent (think R-square)0.1362 0.0181.8% of the varianceexplained by secondcomponentQ: why is it 1?Excel demo13.0571.0670.9580.7360.6220.5710.5430.446Sum squared loadings down eachcolumn (component) eigenvalues15
3.0571.0670.9580.7360.6220.5710.5430.446Why is the left column the same as the right?Look familiar? Extraction Sums of Squared Loadings Eigenvalues16
3.057Why is eigenvalue greater than 1 acriteria?Recall eigenvalues represent totalvariance explained by a componentLook for theelbowSince the communality is 1 in a PCAfor a single item, if the eigenvalue isgreater than 1, it explains thecommunality of more than 1 item1.0670.9580.7360.6220.5710.5430.44617
Analyze – Dimension Reduction – FactorGoal of PCA isdimension reductionThis is more realisticthan an 8-componentsolution18
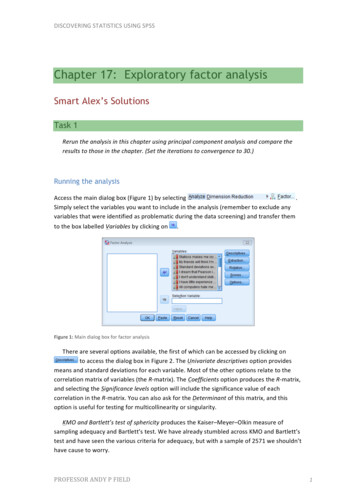
Notice communalities not equal 1Recall these numbers from the 8-component tice only two eigenvalues84.0% of the total variance in Item 2 is explained by Comp 1. How would you derive and interpret these communalities?19
20
Principal components analysis PCA with 8 / 2 components Common factor analysis Principal axis factoring (2-factor PAF) Maximum likelihood (2-factor ML)21
Factor Analysis (EFA) Goal: also to reduce dimensionality, BUT assume total variance can be divided intocommon and unique variance Makes more sense to define a constructwith measurement error8 variables1 variable factor22
Analyze – Dimension Reduction – FactorMake note of the wordeigenvalue it will comeback to haunt us laterSPSS does not changeits menu to reflectchanges in youranalysis. You have toknow theidiosyncrasies yourself.23
Initial communalities arethe squared multiplecorrelation coefficientscontrolling for all otheritems in your modelQ: what was the initialcommunality for PCA?Sum of communalities across items 3.0124
Unlike the PCA model, thesum of the initialeigenvalues do not equalthe sums of squaredloadingsSum eigenvalues 4.1242.510 0.499The reason is becauseEigenvalues are for PCAnot for factor analysis!(SPSS idiosyncrasies)Sum of squared loadings Factor 1 2.51Sum of squared loadings Factor 2 0.499(recall) Sum of communalities across items 3.0125
Analyze – Dimension Reduction – FactorCaution!Eigenvalues are only forPCA, yet SPSS uses theeigenvalue criteria for EFAWhen you look at thescree plot in SPSS, you aremaking a consciousdecision to use the PCAsolution as a proxy foryour EFA26
27
These are analogous to component loadings in PCASquaring theloadings andsumming upgives you eithertheCommunality orthe ExtractionSums ofSquaredLoadingsSumming downthecommunalities oracross theeigenvalues givesyou totalvarianceexplained 0 0.4993.01Sum of squared loadings acrossfactors is the communalityCommunalities0.5882 0.34634.5% of the variance inItem 1 explained by firstfactor(-0.303)2 0.0919.1% of the variance in Item1 explained by secondfactor0.345 0.091 0.43743.7% of the variance inItem 1 explained by bothfactors COMMUNALITY!Sum squared loadings down eachcolumn Extraction Sums of SquareLoadings (not eigenvalues)28
CommunalitiesCaution when interpreting unrotatedloadings. Most of total varianceexplained by first factor.Which item has the least total variance explained by both factors?29
EFA Communalitiesor componentsExcel demoPCA83.01EFA30
31
Analyze – Dimension Reduction – FactorNew outputA significant chisquare means youreject the currenthypothesized modelThis is telling us we rejectthe two-factor model32
Chi-square anddegrees of freedomgoes downThe three factormodel is preferredfrom chi-squareNumberof NSN/ADf201372-2-5-7N/AIterationsp-value needed 0.054 0.05390.055570.5168NSNSNSNSNSNSN/AN/AWant NONsignificant chisquareIterationsneededgoes upAn eight factor model is not possible in SPSS33
34
EFA: Total VarianceExplained TotalCommunalityExplained NOTTotal VarianceFor both models,communality is thetotal proportion ofvariance due to allfactors orcomponents in themodelPCA: Total VarianceExplained TotalVarianceCommunalities areitem specific35
36
(across all items)37
Simple Structure Orthogonal rotation (Varimax) Oblique (Direct Oblimin)38
1. Each item has high loadings on one factor only2. Each factor has high loadings for only some of the items.Pedhazur and Schemlkin (1991)ItemFactor 1Factor 2Factor he goal of rotationis to achieve simplestructure39
1. Most items have high loadings on more than one factor2. Factor 3 has high loadings on 5/8 itemsItemFactor 1Factor 2Factor 0.8800.8040
Without rotation, first factor is the most general factor onto which most items load and explains the largest amount of varianceVarimax:orthogonal rotationOrthogonal means thefactors are uncorrelatedmaximizesvariances of theloadings within thefactors whilemaximizingdifferencesbetween high andlow loadings on aparticular factor41
The factortransformation matrixturns the regular factormatrix into the rotatedfactor matrixThe amount of rotationis the angle of rotation42
43
Unrotated solutionCommunalities0.438Varimax mizes sum ofthe variance ofsquared loadingswithin each factorcommunalities arethe same44
Unrotated SolutionVarimax SolutionHigher absolute loadings in Varimax solution for Tech Anxiety45
True or False: Rotation changes how the variances are distributed but not the total communalitymaximizesvariances of theloadings3.013.01Even though the distribution of the variance is different the totalsum of squared loadings is the sameAnswer: T46
Quartimax: maximizes the squared loadings so thateach item loads most strongly onto a single factor.Good for generating a single factor.Varimax: good for distributing among more than one factorThe difference between Quartimax andunrotated solution is that maximumvariance can be in a factor that is not thefirst47
factor pattern matrix partial standardized regression coefficients of each item with a particular factor Think (P)artial Pattern factor structure matrix simple zero order correlations of each item with a particular factor Think (S)imple Structure factor correlation matrix matrix of intercorrelations among factors48
When Delta 0 Direct QuartiminOblique rotationmeans the factorsare correlatedLarger deltaincreasescorrelation amongfactorsNegative deltaincreases makesfactors moreorthogonal49
50
angle of correlation ϕdetermines whether the factorsare orthogonal or obliqueangle of axis rotation θhow the axis rotates in relation tothe data points (analogous torotation in orthogonal rotation)51
The more correlatedthe factors, thegreater thedifference betweenpattern and structurematrixIf the factors areorthogonal, thecorrelations betweenthem would be zero,then the factorpattern matrix wouldEQUAL the factorstructure matrix.52
Simple zero order correlations(can’t exceed one)Partial standardized regression coefficients(can exceed one)0.740 is theeffect ofFactor 1 onItem 1controllingfor Factor 20.5660.5370.0370.0820.4890.2520.6610.653 is the simplecorrelation of Factor 1on Item 1Note that the sum ofsquared loadings do NOTmatch communalities0.436There IS a wayto make thesum of squaredloadings equalto thecommunality.Think back 41.1850.34453
Note: now the sumof the squaredloadings is HIGHERthan the unrotatedsolutionThis is exactly thesame as theunrotated 2-factorPAF solutionSPSS uses thestructure matrix tocalculate this-factor contributionswill overlap andbecome greaterthan the totalvarianceSPSS uses thestructure matrix tocalculate this-factor contributionswill overlap andbecome greaterthan the totalvariance3.014.2554
Partial loadingsZero-order loadingsCorrelations sameLower absolute loadings of Items 4,8 onto Tech Anxiety for Pattern Matrix55
Structure MatrixPattern MatrixWhy do you thinkthe secondloading is lower inthe PatternMatrix comparedto the StructureMatrix?56
There is no consensus about which one to use in the literature Hair et al. (1995) Better to interpret the pattern matrix because it gives the unique contribution of the factoron a particular item Pett et al. (2003) Structure matrix should be used for interpretation Pattern matrix for obtaining factor scores My belief: I agree with HairHair, J. F. J., Anderson, R. E., Tatham, R. L., & Black, W. C. (1995). Multivariate data analysis . Saddle River.Pett, M. A., Lackey, N. R., & Sullivan, J. J. (2003). Making sense of factor analysis: The use of factor analysis for instrument development in health care research. Sage.57
58
Regression Bartlett Anderson-Rubin59
Analyze – Dimension Reduction – Factor – Factor ScoresWhat it looks like in SPSS Data View60
13This is how the factor scores are generatedSPSS takes the standardized scores for each itemThen multiply each score61
Covariance matrix of the true factor scoresCovariance matrix of the estimated factor scoresNotice that for DirectQuartimin, the rawcovariances do not matchRegression method hasfactor score mean of zero,and variance equal to thesquared multiplecorrelation of estimatedand true factor scores62
Notice that for Direct Quartimin, the rawcorrelations do match (property ofRegression method)However, note that the factor scores arestill correlated even though we didVarimax63
1. Regression Method Variance equals the square multiple correlation between factors and variables Maximizes correlation between estimated and true factor scores but can be biased 2. Bartlett Factor scores highly correlate with own true factor and not with others Unbiased estimate of true factor scores 3. Anderson-Rubin Estimated factor scores become uncorrelated with other true factors and uncorrelated withother estimated factor scores Biased especially if factors are actually correlated, not for oblique rotations64
Direct Quartimin65
66
(SPSS idiosyncrasies) (recall) Sum of communalities across items 3.01 Sum of squared loadings Factor 1 2.51 Sum of squared loadings Factor 2 0.499. 26 Caution! Eigenvalues are only for PCA,