Transcription
ATP Simulation of CapacitorProtection SchemeRussell W. PattersonTennessee Valley AuthorityPresented to the57th Annual Georgia TechProtective Relaying ConferenceMay 7-9, 2003
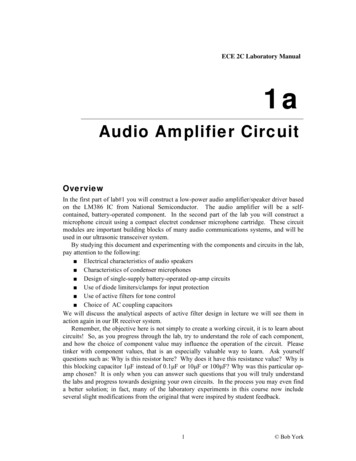
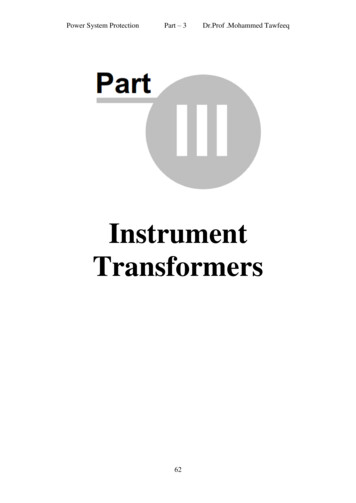
ATP Simulation of Capacitor Protection SchemeAbstractThis paper describes the ATP (Alternative Transients Program) modeling and simulationof a protection scheme used to protect 161kV shunt capacitor banks in the TVA region.The ATP simulations uncovered a problem with the current transformer used in thescheme (due to excitation characteristic) making the scheme ineffectual. This analysisresulted in replacing CTs used in this scheme with one having an appropriate excitationcharacteristic. The paper describes the protection scheme, modeling of the currenttransformer and capacitor bank in ATP, and a hand calculation method of evaluating theschemes performance.IntroductionThe diagram below shows the general arrangement of one of the capacitor banks atAlbertville, AL 161kV substation.4 Parallel groups each phasewith 10 - 9540V, 400kVAR unitsin series per group.BAShunt CapacitorsXC 570Ω per phase3.5kΩ59NC100Ω1.5kΩLow VoltageCapacitors rated167kVAR at 825Vresulting inXC 4Ω each5:5 CTFigure 1. Capacitor Bank Unbalance Protection SchemeThe shunt capacitor banks are made up of 4 parallel strings in each phase. Each stringis made up of 10 capacitor units in series. Each capacitor unit is rated 9,540V and400kVAR and is comprised of 5 series capacitors rated 1,908V and 80kVAR each.Since the phase reactance of the shunt capacitor bank (570Ω) is much greater than thereactance of the two parallel low voltage capacitors (2Ω) in the neutral, the bank can beconsidered solidly grounded for unbalance calculation purposes. This unbalanceprotection scheme monitors the voltage developed across the low-voltage capacitors inthe neutral of the capacitor bank. This voltage is produced by neutral current flowingdue to shorted capacitors, system voltage unbalance, or system ground faults.Page 1 of 17
ATP Simulation of Capacitor Protection SchemeThe 100Ω resistor in series with the transformer (a CT is used in this case because a1:1 VT rated for 15kV is not readily available) is to assure that the transformer wouldcome out of saturation promptly when the capacitor bank is energized. It also is used toprevent ferroresonant voltage transients that can occur with the CTs inductance duringswitching. Since a 1:1 transformer is used the secondary resistance (1.5kΩ 3.5kΩ) isreflected into the primary by a turns ratio squared of 1 (neglecting the influence of theCT magnetizing branch). So, the voltage to the 59N relay is effectively the voltageacross the low voltage neutral capacitors times the resistive voltage divider1.5/(1.5 3.5). The voltage to the relay is equal to VN (neutral point to earth voltage)times 0.30.For an explanation of the reasons for choosing this method see the paper, “Protection ofGrounded Wye Capacitor Banks: Using a Low Voltage Neutral Capacitor”, by John E.Harder (ABB). This paper recommends using one low voltage neutral capacitor forevery 100 Amps of nominal phase current. In this case nominal phase current (for48MVAR bank) will be 172A so two neutral capacitors are used. This rule of thumb isused so that if only one or two phases of the capacitor bank are energized the voltageacross the low voltage neutral capacitors will not exceed 400V. The low voltagecapacitors used are rated 167kVAR at 825V. This corresponds to 8252/167,000 4Ωeach at 60Hz.59N Setpoint CalculationsThis relay measures neutral point voltage and alarms or trips depending on the severityand duration of the unbalance. If a capacitor fails it will short (fuseless capacitors aresupposed to fail shorted) leaving only 4 capacitors in the series unit. The overallimpedance of the entire leg will be 49/50 of that for a healthy leg (98% of normal). Thecurrent in that leg will be 50/49 of what it is in a healthy leg (2.0408% higher). Thismeans the string current will go to 42.86A and a neutral current of 0.86A will result. A0.86A neutral current results in a VN voltage of 0.86A x 2Ω 1.72V. The relay will see1.72V x 1.5/5.0 0.516 ½V. With two capacitors in one unit shorted the overall legimpedance goes to 96% of normal. The current increased to 104.167% and the neutral(VN) voltage goes to 3.5V impressing 1.05V across the 1.5kΩ resistor input to the 59N.The formula for calculating the overvoltage on the remaining capacitors is simply 50/(50- # caps shorted). The number of caps shorted to produce a 10% overvoltage on theremaining caps is 1.10 50/(50-X). X 4.5 caps. With 4 capacitors shorted theovervoltage on the remaining capacitors is 8.70%. With 5 capacitors shorted (oneentire 400kVAR unit) the overvoltage on the remaining capacitors jumps to 11.1%. Thealarm level will be set at half this to alarm at 5.5% overvoltage (will actually only come inwhen 3rd capacitor is shorted).With 4 capacitors shorted the voltage impressed on the 59N will be [1/(0.92) x 42]-42 x2 x 1.5/5.0 2.2V. With 5 capacitors shorted the relay voltage will be 2.8V. The relaywill be set to alarm with the loss of 3 or more capacitors and trip with loss of 5 or more.This is in line with ABB recommendations (see section 3 of “Instruction ManualFuseless Capacitor Bank”) and verified with ATP simulation of the capacitor bank andlow-voltage capacitive grounding system.Page 2 of 17
ATP Simulation of Capacitor Protection SchemeRelay trip setpoint 2.5V with a delay to trip of 1.5 seconds (to avoid misoperating onslow clearing system ground faults).Relay alarm at 50% of trip value 1.25V with a delay to alarm of 60 seconds. This longdelay should avoid any spurious alarms.These setpoint levels and time delays can be compared to the maximum permissiblevoltage/duration specified in IEEE Std. 1036-1992. The second column (Maximumpermissible voltage) is a multiplying factor to be applied to the rated voltage rms.Duration6 cycles15 cycles1 second15 seconds1 minuteMaximum permissible voltage2.202.001.701.401.30Table 1. Maximum Permissible Capacitor Voltage.Page 3 of 17
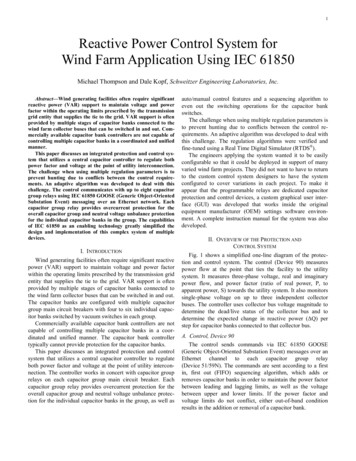
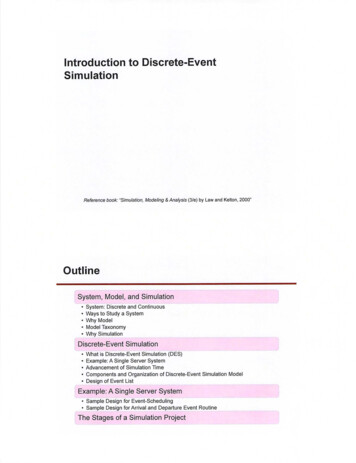
ATP Simulation of Capacitor Protection SchemeATP ModelingThe capacitor bank and low-voltage neutral unbalance protection scheme weremodeled in ATP. The external system was modeled as a simple source behindThevenin impedance equivalent. Each of the four strings in each phase were modeledwith ten series capacitor groups per string. One capacitor group in one string of Aphase was further subdivided into five individual capacitor units for ease of modeling.Figure 2 shows part of the network modeled. The voltage sources labeled SRCA,SRCB, SRCC are ATP “type 14” and are simply ideal voltage sources whose voltageamplitude and phase angle can be specified. The Thevenin impedance is attached tothese voltage sources and is a simple ATP “Symmetric RL coupled line model”consisting of the zero and positive sequence values of the Thevenin impedance. Asimple “RLC” element is used to model the 1600µH inductors present between thesystem and circuit switcher. A simple time-controlled switch is used to model the circuitswitcher connection to the capacitor bank.All three phases are modeled identically with the exception that one of the ten groups inone of the four strings of A-phase is explicitly modeled as its five series capacitor units.This is to easily accommodate the shorting of different combinations of these fivecapacitor units during simulation.Figure 2. Snapshot of ATP graphic showing system equivalent source behindThevenin impedance and A-phase model of capacitor bank.Page 4 of 17
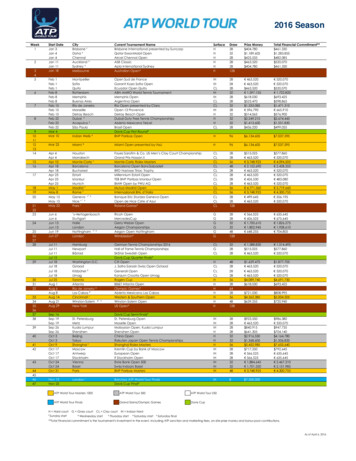
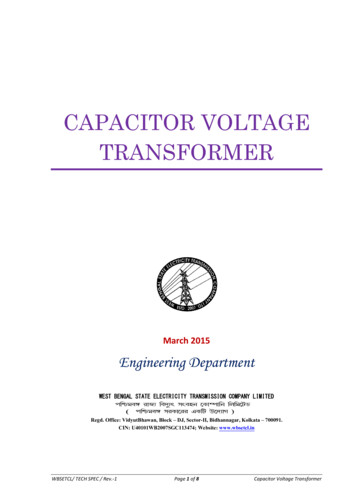
ATP Simulation of Capacitor Protection SchemeThe neutral end of each phase are brought together and taken through a single phasecurrent probe. The arrow on the current probe symbol shows the relative direction ofcurrent. Two low-voltage capacitors are modeled in parallel to ground. In parallel tothese capacitors is the voltage measuring system comprised of the 100Ω resistor inseries with the 5:5 CT. The secondary of the CT is closed by the series circuit of the3.5kΩ and 1.5kΩ resistances. In this graphic the neutral voltage is labeled VN, thevoltage across the primary of the CT is labeled VP, and the voltage to the relay islabeled VR.Figure 3. Snapshot of ATP graphic showing model of neutral unbalanceprotection scheme.The model is straightforward, and the only complication to this simple network is thesaturation characteristic of the CT. The CT is modeled as an ATP “Single phasesaturable transformer”. The transformer is modeled with the usual parameters (such asresistance in primary and secondary windings, inductance in primary and secondarywinding, rated voltage in primary winding, rated voltage in secondary winding etc.) aswell as its saturation characteristic. Table 2 shows the saturation curve data used tomodel the C100 CT used in this application (model KOR-15C). Appendix A shows theATP file used to create a punch (*.pch) file for inclusion in the ATPDraw case.IRMS MS(V)1.050.060.070.080.090.0100.0114.0144.0Table 2. Saturation curve points for C100 Current Transformer.Page 5 of 17
ATP Simulation of Capacitor Protection SchemeKOR-15C Current Transformer160140Vrms (V)12010080604020000.51Irms (A)Figure 4. Saturation curve for C100 Current Transformer.Page 6 of 17
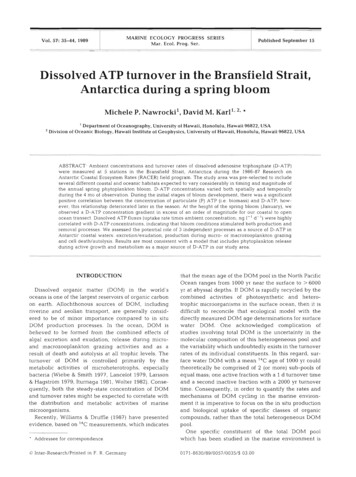
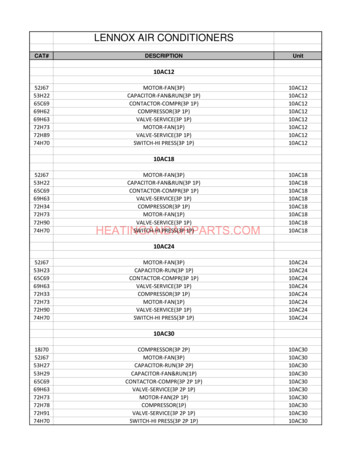
ATP Simulation of Capacitor Protection SchemeResults of ATP SimulationCase 1 - One phase open on capacitor bank, closing at t 33ms.The plot in Figure 5 shows the neutral voltage and the relay voltage with A-phase switchclosing just after time t 33 ms. B and C-phase have been energized since t - infinity.The model shows the CT saturating and providing a reduced fundamental voltage to the59N relay.600400Voltage (V)2000-200-400-60002040Time (ms)6080100Figure 5. A-phase open initially, then closed at time t 33 ms.For comparison purposes the same case was run assuming the CT was ideal (excludedthe CT saturation characteristic). As expected, the voltage VR is just a scaled versionof VN with no sign of saturation.600400Voltage (V)2000-200-400-60002040Time (ms)6080Figure 6. Repeat of Case 1, modeling CT as ideal transformer.Page 7 of 17100
ATP Simulation of Capacitor Protection SchemeCase 2 – Bolted A-phase to ground fault on 161kV bus.The plot in Figure 7 shows the neutral voltage (dashed) and the CT primary voltage(bold) with a solid A-phase to ground fault on the 161kV bus. Again, the C100 CT isheavily saturated.1000Voltage (V)5000-500-100002040Time (ms)6080100Figure 7. Bolted A-phase to ground fault on 161kV bus.Cases 1 and 2 made it apparent that this CT was saturating, raising questions as to howthe scheme would perform under other unbalance conditions where the relay would bedepended on to operate. A harmonic analysis of the waveform of Figure 5 in Mathcadindicated that the fundamental (60Hz) component has amplitude (from sliding DFTFourier analysis) somewhat above 50V. This corresponds to a fundamental RMS valueof over 35V to the relay. As it turns out this is not a problem for the relay since thesevoltages presented to it are well above its trip setpoint.It is important to note that the inaccuracy of the scheme is most pronounced when theCT primary voltage is in the 1.0V range, since the alarm and trip settings are in thisrange.Page 8 of 17
ATP Simulation of Capacitor Protection SchemeCase 2 – One capacitor in one series group shorted.One capacitor unit in one series group is shorted for this simulation. Figure 8 shows thevoltage presented to the relay for the case of the saturable CT model and for the idealCT model. It is apparent from this plot that the excitation draw of the CT has produceda voltage drop in the 100Ω resistor that has reduced the voltage applied across the CT.This is just under a 35% error in magnitude.Neutral voltageVoltage to relay (saturable CT case)Voltage to relay (ideal CT case)32Voltage(V)10-1-2-302040Time (ms)6080100Figure 8. One capacitor unit shorted in one series group.Case 3 – Two capacitors in one series group shorted.In this case the voltage to the relay for the saturable CT is closer to that predicted withthe ideal CT. This is the case as more capacitors are shorted until the point wheresaturation begins to appear (between 4 and 5 series groups shorted).Neutral voltageVoltage to relay (saturable CT case)Voltage to relay (ideal CT case)64Voltage(V)20-2-4-602040Time (ms)6080Figure 9. Two capacitor units shorted in one series group.Page 9 of 17100
ATP Simulation of Capacitor Protection SchemeModeling the old fashioned wayThe diagram in Figure 10 shows the protection scheme with the capacitor bank and lowvoltage neutral capacitors replaced with a simple voltage source, VN. The variablereactor shown in the secondary of the CT represents the magnetizing branch.3.5kΩ59N100Ω1.5kΩVN5:5 CTFigure 10. Circuit diagram of low-voltage unbalance protection scheme.Neglecting the magnetizing branch the current draw through the 100Ω resistance willbe:IN VN / (100Ω 5000Ω)So, for VN 1.0V the current will be 0.196mA. This 0.196mA would cause a 19.6mVdrop in the 100Ω resistor resulting in 0.98V being presented to the primary of the CTand likewise to the secondary voltage divider circuit.From the KOR-15C saturation data the magnetizing branch draws 12mA when 1.0V isacross the CT. This equates to a magnetizing reactance of 1.0 / 12mA j83.3Ω.Including the effects of the magnetizing branch the current through the 100Ω resistorwill be:IN VN / [100Ω (5000Ω * j83.3Ω) / (5000Ω j83.3Ω) ]IN VN / (101.4Ω j 83.3Ω)So, for VN 1.0V the current will be approximately 7.6mA. This 7.6mA would cause a0.7V drop across the 100Ω resistor leaving 0.63V across the CT. To fine tune thesequantities requires iterating until the values change negligibly. But, this first iterationindicates that a significant error will be present when the neutral voltage is low (1.0V).From the KOR-11 saturation data (the scheme was originally designed to use the KOR11) the magnetizing branch draws 2mA when 1.0V is across the CT. This equates to amagnetizing reactance of 1.0 / 2mA j500Ω. This would result in a voltage drop acrossthe 100Ω resistor of less than 0.2V leaving 0.96V across the CT.Page 10 of 17
ATP Simulation of Capacitor Protection SchemeImag 0Vmag 83.3384.6416.7424.2412.4391.3355.9228.01.44Table 3. Magnitizing branch reactance (C100, model KOR-15C).Imag (mA)2.010.0Vmag (V)1.010.0Zmag(Ω)500.01000.0Table 4. Magnitizing branch reactance (C200, model KOR-11).Table 3 and 4 contrast the actual CT used in the unbalance protection scheme (KOR15C) and the CT specified by the original designer (KOR-11). The magnetizing branchimpedances in the 1.0V range are significantly different. Note that only two points couldreliably be taken from the KOR-11 saturation curve due to the poor reprographicsquality of the source document.Page 11 of 17
ATP Simulation of Capacitor Protection SchemeResolutionSince the alarm setting (1.25V) was in the region of operation resulting in the largesterror with the KOR-15C, it was decided to ask the manufacture to replace the KOR-15CCT with the KOR-11 as was originally designed. This eliminated the problem of themagnetizing branch degrading voltage to the relay in the low voltage range.The scheme designer suggested that another suitable method would have been to fieldtest the circuit under expected voltages and to accommodate in the setpoints. It shouldbe noted that this scheme cannot be finely tuned anyway due to the fact that the lowvoltage capacitors and the resistors in the circuit are not precision elements andintroduce error of their own. Field testing was done and the results shown in Table 5.Itest (mA)2.64.56.57.89.110.012.216.228.177.9Vtest (V)0.51.01.52.02.53.03.55.010.035.0Vrelay est0.220.210.220.210.210.220.210.200.240.25Table 5. Field test of C100, KOR-15C.This data showed the KOR-15C at Albertville to be closer in its saturation characteristicto the KOR-11 data than to the specified KOR-15C saturation data. A simulation of onecapacitor unit shorted was run with this actual field measured data incorporated into theCT model with the results shown in Figure 10.Neutral voltageVoltage to relay (saturable CTmodeled from test data)Voltage to relay (ideal CT model)32Voltage(V)10-1-2-302040Time (ms)6080100Figure 10. One capacitor unit shorted in one series group (actual CT test data).Page 12 of 17
ATP Simulation of Capacitor Protection SchemeA comparison of Figure 10 (one capacitor unit shorted and actual CT test data used inmodel) with Figure 8 (one capacitor unit shorted and CT design saturation curve dataused) shows that the actual KOR-15C at Albertville was closer in is performance to theKOR-11. This helps to explain the consistent performance of the scheme under testconditions as shown in Table 5. The deviation from the expected 0.30 ratio could beexplained by the slightly higher than designed excitation characteristic (5.1mA at 1.0Vfor actual CT vs. 2.0mA at 1.0V for specified KOR-11) and the fact that the otherelements in the scheme are not precision elements.It was subsequently determined that a third CT had also been used at several locations(C100, model JKW-5) that had a larger excitation requirement than the KOR-15C. ThisJKW-5 required just under 20mA at 1.0V excitation. This fact helped support the designdecision to replace the existing CTs with the KOR-11 model as specified by the originalscheme designer.Page 13 of 17
ATP Simulation of Capacitor Protection SchemeSummaryThe low-voltage unbalance scheme analyzed in this paper is susceptible to inaccuraciesif the excitation requirement of the isolation transformer (5:5 CT) exceeds thoseanticipated by the designer. These inaccuracies seem to only be a problem in the 1.0Vrange which is near the alarm setpoint level for the application described at Albertville,AL 161k substation. It is possible (and a viable solution) to field test the scheme andmake the alarm and trip setpoints based on the test data. Also, field test data on the CTcharacteristic can be used in modeling as well.The analysis described in this paper can easily be done by hand using the saturationcurve. The benefit of doing the analysis in an ATP computer model is the flexibility inconfiguration. Once the model circuit has been built and tested it can be used in avariety of system configurations under various fault conditions as long as the limitationsof the model are understood and respected (e.g., the simple CT saturation model usedin this analysis would not be adequate for a high-frequency simulation of secondarytransients). Also, building and using ATP models for simple cases facilitates anunderstanding of and familiarity with the program and power system modeling ingeneral that will pay dividends when more complex modeling is necessary tounderstand system dynamics.Page 14 of 17
ATP Simulation of Capacitor Protection SchemeReferences1) IEEE Guide for Application of Shunt Power Capacitors, IEEE Std 1036-1992.2) IEEE Standard for Shunt Power Capacitors, IEEE Std 18 -2002.3) IEEE Guide for the Protection of Shunt Capacitor Banks, IEEE Std C37.99-2000.4) “Protection of Grounded Wye Capacitor Banks: Using a Low Voltage NeutralCapacitor”, John E. Harder, February 1987. Available from: John E. Harder,97 North Hartstrait Road, Bloomington, IN 47404-9700 USA, Phone 812-335-8362,E-Mail: harder97@compuserve.com5) “ATP Simulator Test Of Low Impedance Bus Differential Protection”, 50th AnnualConference For Protective Relay Engineers – Texas A&M University, April 8, 1997, J.Esztergalyos, S. Sambasivan, J.P. Gosalia, R. Ryan.6) “Current Transformer Concepts”, 46th Annual Georgia Tech Protective RelayConference, April 29 – May 1, 1992, S.E. Zocholl, D.W. Smaha.7) “Mathematical Models for Current, Voltage, and Coupling Capacitor VoltageTransformers”, IEEE Transactions on Power Delivery, PE047PRD(06-99), DemetriosTziouvaras, et al.SoftwareATP – Alternative Transients Program. ATP is the royalty-free version of theElectromagnetic Transients Program (EMTP). http://www.eeug.de/ATPDraw – Graphical user interface for ATP. ATP files are simple text files. For largecomplex systems editing and maintaining text files is cumbersome. ATPDraw easesthis burden and is free. http://www.eeug.de/TOP – The Output Processor. TOP reads data from a variety of sources andtransforms it into high quality graphics for inclusion in reports and documents. TOP wasdeveloped by Electrotek Concepts to visualize data from a variety of simulation andmeasurement programs. http://www.pqsoft.com/TOP/index.htmPage 15 of 17
ATP Simulation of Capacitor Protection SchemeBiographical SketchRussell W. Patterson is Manager of System Protection & Analysis for the TennesseeValley Authority (TVA) in Chattanooga, Tennessee. He is accountable for theapplication of all protective relays in the TVA transmission system and at Hydro, Fossiland Nuclear generating plants. He is responsible for ensuring that TVA’s protectiverelays maximize the reliability and security of the transmission system. This includessetting and ensuring the proper application and development of protection philosophyfor the TVA. He also reviews and makes protective relaying recommendations on newconstruction (including IPPs) and retrofit projects for the generation and transmissionsystem. Prior to his position as Manager Russell was a Project Specialist in SystemProtection & Analysis and was TVA’s Power Quality Manager responsible for field andcustomer support on PQ related issues and disturbances. Russell has performedtransient simulations using EMTP for breaker Transient Recovery Voltage (TRV) studiesincluding recommending mitigation techniques. Mr. Patterson earned the B.S.E.E.from the Mississippi State University in 1991 and has completed all coursework towardthe M.S.E.E. at Mississippi State University. Russell is a registered professionalengineer in the state of Tennessee and is a Senior Member of IEEE. Russell can be emailed at rwpatterson@tva.gov.Page 16 of 17
ATP Simulation of Capacitor Protection SchemeAppendix A – ATP file used to create the punch (include) file containing the KOR15C saturation data.The following text file is to be run in ATP. ATP passes this data through the SATURAroutine to convert it to flux-i data as expected by ATP. The resulting flux-i data iscontained in a simple text file with a “pch” extension (punch file). It is referenced in themain ATP file for inclusion in the CT model. This is a required extra step because ATPdoesn’t like saturation characteristic data in the usual V-I rms engineering format.BEGIN NEW DATA CASEC 34567890123456789012345678901234567890C input data for routine SATURA to takeC V-I (RMS) curve for KOR-15C currentC transformer and convert to flux-i forC use in 1-phase saturable transformer model.CC Sinusoidal test data was given in Volts andC Amps RMS so the Vbase is set to 1V and the SbaseC is set to 1VA.CC See section XIX-G of rule book for SATURA routineCC A)CFREQVBASESBASE IPUNCH KTHIRDSATURATION60.0011.E-610CC 34567890123456789012345678901234567890C IRMS(pu)----- VRMS(pu)------- 0.00.281100.00.500114.0100.0144.09999.C PUNCH, kor 15CT.pchBLANK LINEBEGIN NEW DATA CASEBLANK LINE ENDING ALL CASESThe resulting flux-i data (Weber-turns vs. Amperes):1.69705627E-02 3.75131798E-031.79936882E-01 1.87565899E-011.83841361E-01 2.25079079E-012.29722949E-01 2.62592259E-012.82830405E-01 3.00105439E-013.47623949E-01 3.37618619E-014.50936447E-01 3.75131798E-019.75971376E-01 4.27650250E-012.12544845E 02 5.40189790E-019999Page 17 of 17
With 4 capacitors shorted the voltage impressed on the 59N will be [1/(0.92) x 42]-42 x 2 x 1.5/5.0 2.2V. With 5 capacitors shorted the relay voltage will be 2.8V. The relay will be set to alarm with the loss of 3 or more capacitors and trip with loss of 5 or more. This is in line with ABB recommendations (see section 3 of "Instruction Manual