Transcription
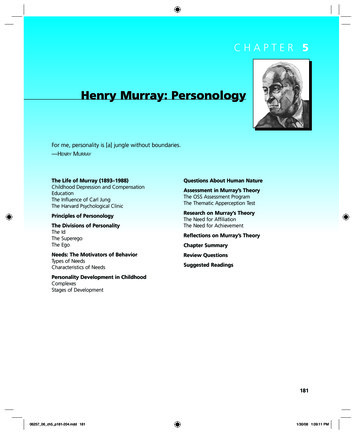
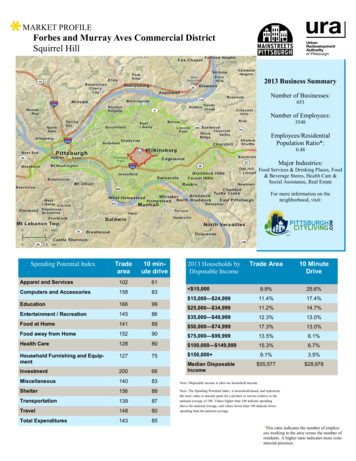
MARKET PROFILEForbes and Murray Aves Commercial DistrictSquirrel Hill2013 Business SummaryNumber of Businesses:653Number of Employees:3548Employees/ResidentialPopulation Ratio*:0.48Major Industries:Food Services & Drinking Places, Food& Beverage Stores, Health Care &Social Assistance, Real EstateFor more information on theneighborhood, visit:Tradearea10 minute driveTrade Area10 MinuteDriveApparel and Services10261Computers and Accessories15883 15,0009.9%25.6%Education16699 15,000— 24,99911.4%17.4%Entertainment / Recreation14586 25,000— 34,99911.2%14.7%Food at Home14189 35,000— 49,99912.3%13.0%Food away from Home15290 50,000— 74,99917.3%13.0%Health Care12880 75,000— 99,99913.5%6.1% 100,000— 149,99915.3%6.7%Household Furnishing and Equipment12775 150,000 9.1%3.5%Investment 28,97866Median DisposableIncome ion13987Travel14880Total Expenditures14385Spending Potential Index2013 Households byDisposable IncomeNote: Disposable income is after-tax household income.Note: The Spending Potential Index is household-based, and representsthe asset value or amount spent for a product or service relative to thenational average of 100. Values higher than 100 indicate spendingabove the national average, and values lower than 100 indicate lowerspending than the national average.*This ratio indicates the number of employees working in the area versus the number ofresidents. A higher ratio indicates more commercial presence.
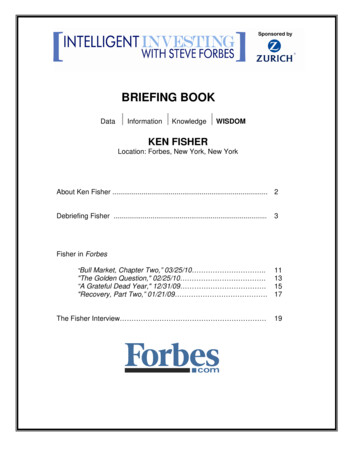
Forbes and Murray Aves Commercial DistrictDemographic Data: Trade area201020132017(Projected)Annual Rate of seholds3,2553,2513,2780.17%Median Age33.633.834.70.53%% 0-99.8%9.7%9.7%0.00%% 10-144.2%4.1%4.2%0.49%% 15-2418.2%18.1%16.7%-1.55%% 25-3419.8%19.8%20.0%0.20%% 35-449.3%8.9%8.7%-0.45%% 45-5410.1%9.7%9.1%-1.24%% 55-6411.8%12.2%12.7%0.82%% 65 16.9%17.5%19.1%1.83%Median Household Income 54,751 71,640 88,6674.75%Average Household Income 81,056 97,543 119,4394.49%Per Capita Income 38,983 42,57152,1684.51%3,4713,4763,4900.08%% Owner Occupied Units43.5%41.0%42.0%0.49%% Renter Occupied Units50.2%52.5%51.9%-0.23%% Vacant Housing Units6.2%6.5%6.1%-1.23% 322,6142.26%Total Housing UnitsMedian Home ValueDemographic Data: 10 MinuteDrive Time 272,780 289,834201020132017(Projected)Annual Rate of 07%Households88,75788,16289,0820.21%Median Age31.631.632.20.38%% 0-98.1%8.1%8.0%-0.25%% 10-143.7%3.6%3.6%0.00%% 15-2425.7%25.9%24.9%-0.77%% 25-3417.1%17.2%17.3%0.12%% 35-449.7%9.3%9.1%-0.43%% 45-5411.1%10.7%9.9%-1.50%% 55-6410.9%11.3%11.7%0.71%% 65 13.6%14%15.5%2.14%MedianIncomeNote: DisposableHouseholdincome is after-tax householdincome. 37,270 33,982 41,1904.24%Average Household Income 52,080 57,612 68,6083.82%Per Capita Income 24,256 28,554 33,7713.65%Total Housing Units101376101,089101,1320.01%% Owner Occupied Units35.0%32.7%33.3%0.37%% Renter Occupied Units52.5%54.6%54.8%0.07%% Vacant Housing Units12.4%12.8%11.9%-1.41% 93,562 123,177 139,9972.73%Median Home ValueTrafficCount ProfileClosestCrossStreetCountForbes AveMurray Ave10,488Murray AveFerree St11,910Wightman StDarlingtonRd4,963Murray AveDouglas St11,910Beacon StMulhatton St7,065Wilkins AveS Negley Ave 22,018Tilbury AveShady Ave14,571Forward AveEldridge St1,447BeechwoodBlvdForest GlenRd8,608S Negley Ave Lynee HavenRd8,655Note: This profile measures the number of vehicleswhich travel through streets nearest to commercialcorridor epicenter on a daily basis. All counts from2009 unless otherwise noted.*Year of count: 2007
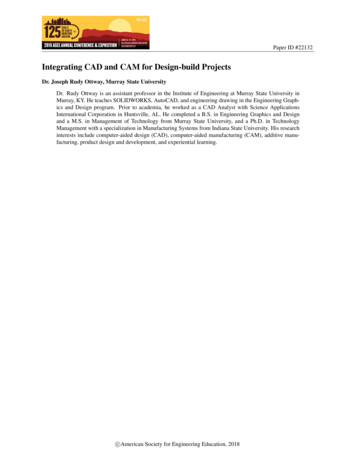
Forbes and Murray Aves Commercial DistrictRetail Potential(Demand)Retail Sales(Supply)Retail GapLeakage/ SurplusFactorNumber ofBusinessMotor Vehicle & Parts Dealers 21,270,689 57,281 21,213,40899.51Furniture & Home Furnishing Stores 2,549,179 145,200 2,403,97989.22Electronics and Appliance Stores 3,282,030 1,952,010 1,330,02025.42Building Materials, Garden Equip. & Supply Stores 3,869,081 40,494 3,828,58797.91Food and Beverage Stores 21,376,530 19,648,278 178,2524.211Health and Personal Care Stores 6,983,585 6,747,807 235,7781.75Gasoline Stations 11,745,274 0 11,745,274100.00Clothing & Clothing Accessories Stores 7,339,252 20,933,062- 13,593,811-48.117Sporting Goods / Hobby / Music / Book Stores 3,572,778 6,179,595- 2,606,816-26.78General Merchandise Stores 17,317,310 43,636 17,273,67499.51Nonstore Retailers 11,098,180 276,153 10,822,02795.11Food Services & Drinking Places 13,079,501 7,665,879 5,413,62226.118Retail Potential(Demand)Retail Sales(Supply)Retail GapLeakage/ SurplusFactorNumber ofBusinessMotor Vehicle & Parts Dealers 352,259,808 107,539,292 244,720,51653.254Furniture & Home Furnishing Stores 41,113,502 26,999,071 14,114,43120.756Electronics and Appliance Stores 53,346,865 29,189,301 24,157,56429.356Building Materials, Garden Equip. & Supply Stores 55,058,920 22,504,085 32,554,83542.043Food and Beverage Stores 360,311,420 350,152,314 10,159,1061.4235Health and Personal Care Stores 116,984,240 189,092,902- 72,108,662-23.6100Gasoline Stations 204,942,076 85,440,797 119,501,27941.236Clothing & Clothing Accessories Stores 120,259,133 190,064,241- 69,805,108-22.5259Sporting Goods / Hobby / Music / Book Stores 59,004,526 76,408,716- 17,404,190-12.9122General Merchandise Stores 289,103,270 134,788,538 154,314,73236.435Nonstore Retailers 183,017,695 1,285,659,489- 1,102,641,795-75.148Food Services & Drinking Places 209,699,544 330,609,589- 120,910,045-22.4540Marketplace Profile**:Trade AreaMarketplace Profile**:10 Minute DriveTime2013 Educational Attainment (Ages 25 )No High School Diploma3%High School Diploma or Some College18.7%Associates Degree2.7%Bachelor’s Degree26.0%Graduate or Professional Degree49.8%**Supply (retail sales) estimates sales to consumers by establishments. Salesto businesses are excluded. Demand (retail potential) estimates the expectedamount spent by consumers at retail establishments. The Leakage/SurplusFactor measures the relationship between supply and demand that ranges from 100 (total leakage) to -100 (total surplus). A positive value represents'leakage' of retail opportunity outside the trade area. A negative valuerepresents a surplus of retail sales, a market where customers are drawn infrom outside the trade area. The Retail Gap represents the difference betweenRetail Potential and Retail Sales. The NAICS is used to classify businesses bytheir primary type of economic activity.
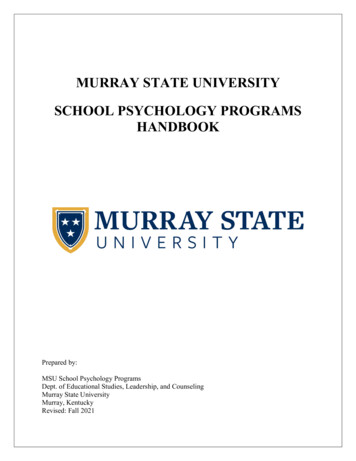
Forbes and Murray Aves Commercial DistrictTrade Area TapestrySegmentation Area Profile:Neighborhood Quick Facts* Largest neighborhood by bothpopulation and area3rd highest median income in Pittsburgh5th fewest # of crime reports per 1000residents (2.9)3rd highest value of building permitsper capita ( 692)* The Walk Score is a measure between 0 and 100 that measures the ease ofaccessing amenities and running errands by walking. For more information, seehttp://www.walkscore.com/TAPESTRY SEGMENT DESCRIPTIONSMetro Renters (24.1%)Because they rent, “home and hearth” products are low priority, although they will buy new furniture from stores such as Crate & Barrel or Pier OneImports. Most of them have renter’s insurance. They buy clothes and other merchandise from traditional stores or online from favorites such as BananaRepublic, Gap, Nordstrom, amazon.com, and barnesandnoble.com. They take their clothes to dry cleaners. Active Metro Renters residents work outregularly at clubs, play tennis and volleyball, practice yoga, ski, and jog. They take advantage of their urban milieu; they go dancing, visit museums,attend classical or rock concerts, go to karaoke nights and the movies, and eat out. Painting and drawing are favorite hobbies. Residents enjoy traveling domestically and overseas and drinking domestic and imported beer and wine. They read two or more daily newspapers; history books; and airline,fashion, epicurean, travel, and business/finance magazines. They listen to alternative, jazz, classical music, all-news, and public radio. They seldomwatch TV; most households own only one set so they can watch movies and news programs. They rent foreign and classic films on DVD. They goonline frequently to look for jobs, make travel arrangements, download music, research real estate, watch videos, and shop. Many buy their PCs online;Trendsetters (22.7%)Trendsetters residents are spenders; they shop in stores, online, and by phone. Fashion-conscious residents buy essentials at discount warehouse stores and branded clothing from store such as Banana Republic, Gap, Nordstrom, and Macy’s. To stay current on trends, they readfashion and epicurean magazines. They listen to classical, alternative music, public, and all-news radio. They are politically liberal. To keep intouch, Trendsetters residents are never far from their electronic gadgets and computers. They own the latest and greatest laptop computers,PDAs, and iPods. Thy go online frequently to shop, make travel reservations, research real estate or investment information, and watch videos.Many young residents are beginning to invest, especially in bonds or CDs. Health-conscious residents buy natural/organic food, take vitamins,and exercise regularly. They go downhill skiing and practice yoga. They also travel, go to the movies, attend rock concerts, and read— espe-Urban Chic (19.9%)Urban Chic residents focus more on their lifestyle than ambience. They travel extensively, visit museums, attend dance performances, shop at upscale stores, and dovolunteer work. To stay fit, they downhill ski; go backpacking, hiking, and biking; practice yoga; do aerobics; play tennis; and lift weights. They buy natural or organicfood and take a multitude of vitamins and dietary supplements. They drink imported wine and truly appreciate a good cup of coffee. These busy, tech-savvy residentsuse PCs extensively. This is a top segment to own an Apple computer. They go online to arrange travel; get the latest news; check their investment portfolios; tradestocks; and buy books, clothes, flowers, and tickets to concerts and sports events. They use credit cards, often charging more than 700 a month. They also own sharesin stocks, tax-exempt funds, mutual funds, and money market funds. They will occasionally use a financial planner or brokerage firm. Urban Chic is one of TapestrySegmentation’s top segments for radio listening; these residents tune in to classical music, all-talk, and public radio. They are also avid readers of newspapers; books;and general editorial, news and entertainment, business, and home service magazines. They seldom watch TV; however, their favorite channels broadcast news programs and documentaries.Note: ESRI is an independent geographic information systems (GIS) corporation and is not affiliated with the Urban Redevelopment Authority of Pittsburgh. This analysis utilizes socioeconomic and marketing data to identify distinct segments of the population, map where they reside, and describe theirsocioeconomic qualities and consumer preferences. More information on tapestry segments and segment descriptions can be found at: nity
Forbes and Murray Aves Commercial District10 Min Drive Time TapestrySegmentation Area Profile:Neighborhood Quick Facts* High number of cottage industries inareaNumber of bus lines in neighborhood: 11Persons per sq. mile: 9.050 Cityaverage: 5,646)Walk Score: 71* The Walk Score is a measure between 0 and 100 that measures the ease ofaccessing amenities and running errands by walking. For more information, seehttp://www.walkscore.com/TAPESTRY SEGMENT DESCRIPTIONSMetro Renters (15.1%)Because they rent, “home and hearth” products are low priority, although they will buy new furniture from stores such as Crate & Barrel or PierOne Imports. Most of them have renter’s insurance. They buy clothes and other merchandise from traditional stores or online from favorites such asBanana Republic, Gap, Nordstrom, amazon.com, and barnesandnoble.com. They take their clothes to dry cleaners. Active Metro Renters residentswork out regularly at clubs, play tennis and volleyball, practice yoga, ski, and jog. They take advantage of their urban milieu; they go dancing, visitmuseums, attend classical or rock concerts, go to karaoke nights and the movies, and eat out. Painting and drawing are favorite hobbies. Residentsenjoy traveling domestically and overseas and drinking domestic and imported beer and wine. They read two or more daily newspapers; historybooks; and airline, fashion, epicurean, travel, and business/finance magazines. They listen to alternative, jazz, classical music, all-news, and publicradio. They seldom watch TV; most households own only one set so they can watch movies and news programs. They rent foreign and classic filmson DVD. They go online frequently to look for jobs, make travel arrangements, download music, research real estate, watch videos, and shop. Manybuy their PCs online; they prefer laptops, although many also own PDAs. Politically, these neighborhoods are liberal.Metropolitans (10.4%)Metropolitans residents are no different from other owners of older homes who incur costs for maintenance and remodeling. They will contract for lawnmaintenance and professional housecleaning services. Many will own or lease a station wagon. Planning for the future, residents own shares in investment funds, contribute to IRA savings accounts, and hold large life insurance policies. These residents pursue an active, urbane lifestyle. They travelfrequently for business and pleasure. They listen to jazz, classical, public, and alternative music radio. They go to rock concerts, watch foreign films onDVD, read women’s fashion magazines, and play a musical instrument. They also practice yoga and go kayaking, hiking/backpacking, and water andsnow skiing. Active members of their communities, Metropolitans residents join civic clubs, volunteer for environmental causes, address public meetings, and work for a political party or candidate. They also belong to business clubs and contribute to PBS. They prefer to own and use a laptop computer, preferably an Apple. They go online daily to download music and buy books, airline tickets, CDs, and clothes. They also order merchandise byModest Income Homes (9.5%)Residents are big fans of daytime and primetime TV. They go to the movies occasionally and also like to watch movies on TV channels such as the LifetimeMovie Network and The Movie Channel. They also watch football and basketball games on TV. They listen to urban radio. The Internet is the least effectiveway to reach these folks. To save money, they shop at discount stores, limit their long-distance telephone calls, and restrict nonessential services such asInternet access and fitness center memberships. When they participate in physical activities, they might play basketball. Most drive used domestic sedans.Note: ESRI is an independent geographic information systems (GIS) corporation and is not affiliated with the Urban Redevelopment Authority of Pittsburgh. This analysis utilizes socioeconomic and marketing data to identify distinct segments of the population, map where they reside, and describe theirsocioeconomic qualities and consumer preferences. More information on tapestry segments and segment descriptions can be found at: nity
Forbes and Murray Aves Commercial DistrictBusiness District ProgramsThe Pittsburgh Biz Buzz Small Grant ProgramMainstreets ProgramThis program is designed to spur neighborhood business district revitalization using the48x48x48 strategy of short and medium term achievable projects, determining what youcan do in 48 hours, 48 days and 48 weeks.The program aims to bring newcomers into your neighborhood business district andcreate a “buzz” about your business district through media and word of mouth.This program strives to ensure the health of the City’s traditional neighborhoodcommercial districts using the National Main Street Center’s Four Point Approachwhich considers: economic restructuring, promotion, design and sustainability.Every 1 invested by Mainstreets Pittsburgh produces 31 in private investment forPittsburgh neighborhoods.For more information about applications and eligibility, visit:http://www.ura.org/business owners/mainstreets.phpTo learn more about this program, contact Josette Fitzgibbons at(412) 255-6686 or visit:http://www.ura.org/business owners/mainstreets.phpFaçade Improvement ProgramsRestored storefronts improve the pedestrian environment, attract more customers, andencourage economic development and investment. The URA offers several differentfaçade improvement programs designed for commercial building owners and tenants toimprove their storefronts. Your location determines your building’s façadeimprovement program eligibility.For more information about applications and eligibility, contact Quianna Wasler, aURA Mainstreets Development Specialist, at (412) 255-6550 or visit:http://www.ura.org/business owners/facade program.phpForbes Avenue business districtContactsSquirrel Hill Urban Coalition:http://www.shuc.org/Squirrel Hill Magazine: http://www.squirrelhillmagazine.net/Squirrel Hill BusinessDirectory: http://www.squirrelhill.biz/Squirrel Hill Historical Society:http://www.squirrelhillhistory.org/All data from ESRI Business Analyst 2013 unless otherwise noted.¹Data applies to neighborhood boundary and not study area. Source: PGHSNAP, Dept. of City PlanningFor More Information:For additional market value analysis data, contact Josette Fitzgibbons at jfitzgibbons@ura.orgDepartment of City Planning SNAP Neighborhood Data: http://www.pittsburghpa.gov/dcp/snap/Pittsburgh Neighborhood Community Indicator Systems (PNCIS) ACS 2005-2009 Neighborhood Profiles:http://www.ucsur.pitt.edu/neighborhood reports acs.phpUrban RedevelopmentAuthority of Pittsburgh: http://www.ura.org/
Squirrel Hill 2013 Business Summary Number of Businesses: 653 Number of Employees: 3548 Employees/Residential Population Ratio*: 0.48 Major Industries: Food Services & Drinking Places, Food & Beverage Stores, Health Care & Social Assistance, Real Estate For more information on the neighborhood, visit: Spending Potential Index Trade area 10 min-