Transcription
MARINE ECOLOGY PROGRESS SERIESMar. Ecol. Prog. Ser.Vol. 57: 35-44. 1989Published September 15Dissolved ATP turnover in the Bransfield Strait,Antarctica during a spring bloomMichele P. a w r o c k i ' David,M. Karll, 2 v *Department of Oceanography, University of Hawaii, Honolulu, Hawaii 96822, USADivision of Oceanic Biology, Hawaii Institute of Geophysics, University of Hawaii, Honolulu, Hawaii 96822. USAABSTRACT- Ambient concentrations and turnover rates of dissolved adenosine triphosphate (D-ATP)were measured at 5 stations in the Bransfield Strait, Antarctica during the 1986-87 Research o nAntarctic Coastal Ecosystem Rates (RACER) field program. The study area was pre-selected to includeseveral different coastal and oceanic habitats expected to vary considerably in timing and magnitude ofthe annual spring phytoplankton bloom. D-ATP concentrations varied both spatially and temporallyduring the 4 mo of observation. Dunng the initial stages of bloom development, there was a signif cantpositive correlation between the concentration of particulate (P) ATP (i.e. biomass) a n d D-ATP; however, this relationship deteriorated later in the season. At the height of the spring bloom (January), w eobserved a D-ATP concentration gradient in excess of a n order of magnitude for our coastal to openocean transect. Dissolved ATP fluxes (uptake rate times ambient concentration; n g I-' d - l ) were highlycorrelated with D-ATP concentrations, indicating that bloom conditions stimulated both production andremoval processes. We assessed the potential role of 3 independent processes as a source of D-ATP inAntarctic coastal waters: excret on/exudation,production during micro- or macrozooplankton grazingand cell death/autolysis. Results are most consistent w t h a model that includes phytoplankton releasedurlng active growth and metabolism as a major source of D-ATP in our study area.INTRODUCTIONDissolved organic matter (DOM) in the world'soceans is one of the largest reservoirs of organic carbonon earth. Allochthonous sources of DOM, includingriverine a n d aeolian transport, are generally considered to be of minor importance compared to in situDOM production processes. In the ocean, DOM isbelieved to be formed from the combined effects ofalgal excretion and exudation, release during microand macrozooplankton grazing activities and as aresult of death and autolysis at all trophic levels. Theturnover of DOM is controlled primarily by themetabolic activities of microheterotrophs, especiallybacteria (Wiebe & Smith 1977, Lancelot 1979, Larsson& Hagstrom 1979, Iturriaga 1981, Wolter 1982). Consequently, both the steady-state concentration of DOMand turnover rates might be expected to correlate withthe distribution and metabolic activities of marinemicroorganisms.Recently, Williams & Druffle (1987) have presentedevidence, based on 14Cmeasurements, which indicatesAddressee for correspondenceO Inter-Research/Printed in F. R . Germanythat the mean age of the DOM pool in the North PacificOcean ranges from 1000 yr near the surface to 6000yr at abyssal depths. If DOM is rapidly recycled by thecombined activities of photosynthetic and heterotrophic microorganisms in the surface ocean, then it isdifficult to reconcile that ecological model with thedirectly measured DOM a g e determinations for surfacewater DOM. One acknowledged complication ofstudies involving total DOM is the uncertainty in themolecular composition of this heterogeneous pool andthe variability which undoubtedly exists in the turnoverrates of its individual constituents. In this regard, surface water DOM with a mean 14C a g e of 1000 yr couldtheoretically be comprised of 2 (or more) sub-pools ofequal mass; one active fraction with a 1 d turnover timeand a second inactive fraction with a 2000 yr turnovertime. Consequently, in order to quantify the rates andmechanisms of DOM cycling in the marine environment it is imperative to focus on the in situ productionand biological uptake of specific classes of organiccompounds, rather than the total heterogeneous DOMpool.One specific constituent of the total DOM poolwhich has been studied in the marine environment is0171-8630/89/0057/0035/ 03.00
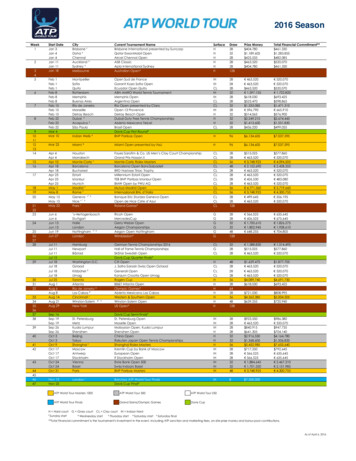
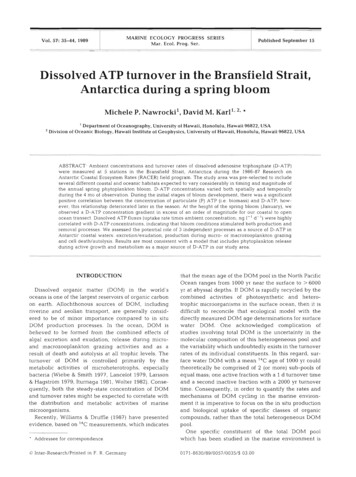
36Mar Ecol. Prog. Ser. 57: 35-44, 1989adenosine-5'-triphosphate (ATP). While ATP is biologically labile, it is chemically stable, with a half-life inartificial seawater at 21 C of ca 8 yr (Hulett 1970).Azam & Hodson (1977) first reported the occurrence ofdissolved ATP (D-ATP) in coastal seawaters off Southern California, USA (range of concentrations: 100 to600 n g 1 - l ; 0.2 to 1.2 nM). They discussed the potential importance of D-ATP as a tracer of DOM andprovided the first concentration versus depth profile ofD-ATP. Two s t r i h n g features of that profile were: (1)the small concentration change with depth, despiteorder of magnitude changes in biomass and (2) theobservation that the deep water ( 250 m) D-ATPconcentrations were approximately a n order of magnitude greater than the particulate ATP (P-ATP) concentrations. It was also determined that ATP wasactively 'removed' from seawater at rates greatly inexcess of those predicted from the above-mentionedlaboratory studies on chemical stability. Possiblemechanisms of D-ATP removal were attributed tospontaneous hydrolysis, enzymatic degradation andmicrobiological uptake. Direct measurements of DATP assimilation and incorporation by marine bacteriaprovided support for the role of heterotrophic microorganisms (Azam & Hodson 1977).Subsequent research efforts reported D-ATP concentrations and/or uptake rates from seawater samplescollected beneath the Ross Ice Shelf, Antarctica (Azamet al. 1979), in Mc MurdoSound, Antarctica (Hodson etal. 1981a) and off the southeastern coast of the USA(Hodson et al. 1981b). McGrath & Sullivan (1981) presented a first-order model of adenylate cycling withinLos Angeles Harbor and Southern California coastalwaters. They identified major fluxes occurring in 3distinct compartments (dissolved total adenylates, particulate adenylates of the bacterioplankton-enrichedfraction and particulate adenylates of the phyto- andmicrozooplankton-enriched fraction), and determinedthe compartment sizes, rates of uptake and rates ofbactivory. There seems little doubt from the abovementioned studies that D-ATP is a ubiquitous constituent of the oceanic DOM pool and that heterotrophic bacteria are a sink for D-ATP.The first attempts to specifically study D-ATP production were in the freshwater studies of Riemann(1979) and Maki et al. (1983). Working in 2 eutrophicDanish lakes, Riemann (1979) found an increase in theconcentration of D-ATP after the culmination of springdiatom blooms, when chlorophyll a values had alreadydecreased to pre-bloom values. He attributed theincrease in D-ATP concentration to algal cell lysis. Inhis study, zooplankton were reported as 'not abundant'. Maki et al. (1983) investigated the effects offeeding by the oppossum shrimp Mysis relicta on thecycling of ATP in Lake Michigan, USA. Feeding by thisherbivore was shown to decrease P-ATP, but apparently did not cause the release of D-ATP. It was suggested that M, relicta may be a relatively efficientparticle feeder and did not produce large amounts ofDOM during the process of food ingestion. Berman etal. (1987) measured D-ATP and P-ATP levels inlaboratory studies of microbial food web-induced nutrient flux. Batch cultures which contained nanoprotistgrazers along with bacteria and algae showed elevatedconcentrations of D-ATP and D-ATP/P-ATP ratiosgreater than 1. Flasks with only exponentially-growingbacteria and/or algae had persistently low levels of DATP (Berman et al. 1987).The differing results of thesestudies leave grazing by nanoplanktonic protists andalgal cell lysis a s possible sources of D-ATP in themarine environment.During a recent interdisciplinary oceanographic fieldstudy in the Bransfield Strait, Antarctica (Research onAntarctic Coastal Ecosystem Rates [RACER]),we hada n opportunity to investigate P-ATP and D-ATP pooldynamics in conjunction with comprehensive measurements of upper ocean physics, photosynthetic and bacterial processes, vertical flux of organic matter anddistribution and physiological rates of planktonic protists, zooplankton and krill (Huntley et al. 1987). Ourresults indicate that D-ATP is present in both coastaland open ocean Antarctic habitats, is rapidly taken u pby microheterotrophic assemblages and is apparentlyproduced primarily through the process of algal cellexudation rather than by algal cell lysis or grazingactivities of micro- or macrozooplankton.MATERIALS AND METHODSStation locations, method of water collection andsampling schedule. At 5 selected sites in the RACERstudy area (Stns 13, 20, 39, 43 and 48; Fig. l ) , weperformed in situ productivity and sediment trapexperiments and had an opportunity to conduct moredetailed experiments on the physiological ecology ofbacteria, phytoplankton and zooplankton. These stations comprised the full range of microbial biomass andproductivity observed dunng the RACER program.From an analysis of the hydrographic data collectedduring RACER, Niiler et al. (unpubl.) conclude that, inspite of the complexity of the region, the water massstructure is conserved throughout the period of ourinvestigation. Consequently, the temporal and spatialvariations that we report herein are likely to have asound biological basis.Water samples for D-ATP determinations wereobtained from depths of 0 to 100 m using 10 1 Nishnbottles (General Oceanics, Miami, Florida, USA). Largeparticles and macrozooplankton were removed by
Nawrocki & Karl: Dissolved ATP IC PENINSULA63'62'61"60" WFig. 1. The RACER study area showing locations of stationsoccupied during the field experimentpassing the seawater through a 202 pm Nitex@ meshduring the initial subsampling procedures. A portion ofthe 202 pm water sample was further fractionated bypassing it through a 20 pm Nitex" screen. The 202 pmand 20 pm subsamples were held in polycarbonatebottles at ambient temperature (-1.5 to 2.0 ' C ) andprotected from direct sunlight for a maximum of 2 hduring sample processing.Particulate ATP (P-ATP) extraction and analysis.Particulate materials from the 202 pm and 20 pmsamples were concentrated onto glass fiber filters(Whatman GF/F), immediately immersed in boilingphosphate buffer (60 mM, pH 7.4) and extracted at100 "C for 5 min. The samples were stored frozen(-20 'C) for subsequent laboratory analysis using thefirefly bioluminescence assay procedure (Karl & HolmHansen 1978).Dissolved ATP (D-ATP) extraction and analysis. DATP determinations were obtained using a procedurethat was modified from Hodson et al. (1976) and Fel-37lows e t al. (1981). Samples for D-ATP analysis wereprepared by passing the filtrate from the P-ATP preparations through a 0.22 ILm cellulose acetate filter (GStype; hdillipore Corporation, Bedford, Mass., USA) toremove any particles which may have passed throughthe GF/F filter. A 300 m1 sample of the 0.22 pm filtratewas acidified with H3PO4 to a final concentration of1 M, and stored at -20 "C for a period not exceeding14 d. At Palmer Station, Antarctica, the samples werethawed at 4 "C and 5 m1 of a n activated charcoal suspension (100 mg ml-' in 0.1 M &PO4) was added toduplicate samples (142 ml) contained in 150 m1 polycarbonate centrifuge tubes. The samples were shakenby hand for 15 min, centrifuged for 10 min a t 1650 X gand the supernatants discarded. The charcoal slurries,with adsorbed ATP, were transferred quantitatively to16 X 150 m m test tubes, a n d centrifuged for 10 min.The supernatants were discarded and the charcoalpellets were stored frozen (-20 "C) for subsequentanalysis. At the University of Hawaii, the samples werethawed and desalted by resuspending the pellet twicewith 12 m1 0.01 M HCl. The ATP was then eluted fromthe charcoal during a 1 h batch extraction with 10 ml ofa solution containing 95 O/O ethanol, distilled water a n d14.2 M N H 4 0 H in a ratio of 150 : 80 : 50, by volume. Thesamples were centrifuged (1650 X g), filtered (Whatman GF/F) and dried in vacuo. The concentrated ATPsamples were dissolved in 1 m1 Tris buffer (20 mM,pH 7.7) and assayed uslng the firefly bioluminescenceprocedure, a s described above. ATP standards, prepared in Antarctica using 0.22 pm filtered seawater,were used to evaluate, and correct for, all potentiallosses of ATP including incomplete binding of ATP tocharcoal, incomplete desorption, hydrolysis duringstorage and processing and any of a variety of potentialinterferences with the luciferase-luciferin bioluminescence reaction.D-ATP uptake. D-ATP uptake was measured by theaddition of 15 pCi of [ 2 , 8 , 3 ] - A T (NewPEngland Nuclear # 24009, specific activity 32 Ci mmol-') to 15 m1of the 202 pm seawater samples. A subsample (5 ml)was removed immediately a n d stored a t -20 "C. Theremaining 10 m1 portion was incubated in the dark at insitu water temperature for 12 h, at which time theentire sample was filtered through a CF/F filter. Thefilter a n d fitrate were stored a t -20 "C for subsequentshore-based analysis of the radioactivity using a Packard TriCarb 4640 liquid scintillation counter. D-ATPturnover time was calculated as described by Azam &Holm-Hansen (1973).Adenylate energy charge. Adenylate energy charge(ECA)was calculated from measurements of ATP, ADPand AMP using the enzymatic methods of Karl & HolmHansen (1978). ECA was determined for total particulate ( 202 pm) a n d dissolved sample preparations.
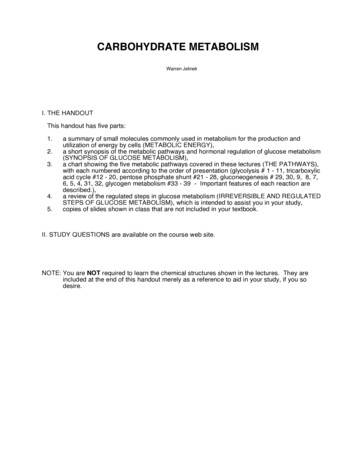
Mar Ecol. Prog. Ser. 57: 35-44, 198938Overall, we observed a positive correlation between PATP and D-ATP in time and space (model 2 linearregression analysis, Laws & Archie 1981; r2 0.76,n 142). However, when the complete data set wasanalyzed on a station-by-station, month-by-month basis,a more predictable pattern emerged (Table 1). InDecember 1986, during the spring bloom period, highcorrelation coefficients (0.91 to 0.94) between P-ATP andD-ATP were observed for every station sampled (Table1). The close covariance between P-ATP and D-ATPpersisted through February 1987 at Stns 43 and 48, butbegan to deteriorate at the other sites. By the end of thesummer season (March 1987),the slope of the regressionbetween P-ATP and D-ATP was negative rather thanpositive (Table 1).From these data, we conclude that DATP is produced as a result of the net growth of microorganisms during the Antarcticspring bloom rather than asa result of net cell death and autolysis which occurs laterin the season (February-March).RESULTSD-ATP depth profilesDepth profiles from the 5 RACER stations sampled on4 cruises indicate that D-ATP was present in Antarcticcoastal and open ocean ecosystems throughout thespring/summer season (Fig. 2) and, furthermore,demonstrate the existence of substantial variability intime and space. In general, the highest D-ATP concentrations were in the surface waters ( 15 m) and coincided with the peaks in total microbial biomass, asdetermined by P-ATP and chlorophyll a (Holm-Hansenet al. 1987, Tien et al. 1987, Karl et al. unpubl.). Maxm u m surface concentrations of D-ATP ( 1000 ng I-')were observed in the coastal shelf habitats (Stns 13 and43) with the lowest surface water concentrations ( 150ng 1-l) measured at the Drake Passage station (Stn 20).Peak concentrations at a given station occurred inDecember (Stns 39 and 48) or January (Stns 13, 20 and43), with decreasing concentrations throughout the latesummer season. Stn 43, where the spring phytoplankton bloom was most intense, supported the largestseasonal fluctuations in D-ATP.Depth-integrated D-ATPD-ATP concentrations were integrated over 0 to 50 mand 0 to 100 m depth intervals for all stations (Table 2).DISSOLVED ATP, ng I - '0400BOO1200050020STA. # 3960A*DEC 1986JAN 1987F E 8 1987JAN 1987*FEE 1987MAR 1987A180-looI1000l50004060STA.#43A400-60-STA.# 48DEC 1986JAN 1387DEC 1986JAN 1987* FE8 1987* FE8 1987m80100- rMAR 1987100-100-500DEC 1986JAN 1987* FEB 1987MAR 1987100-rFig. 2. Temporal changes in the concentrations o f D-ATP versus depth measured dunng the 1986-87 austral summer
Nawrocki & Karl. D ssolvedATP dynamics39Table 1. Linear regression analyses (model 2 a n a l y s sLaws;& A r c h e1981) of P-ATP and D-ATP concentrations for depth profllesIn the RACER study r2Slope0 940.56133-1.390.903 370.630.51-0.640 960 960 541.25-0 191761 940 700 74-0 080.970.84-1 57-0 66-0.34-0.40-0.02" S t a t o nnot occupied d u e to inclement weatherThe amount of D-ATP present in the upper 50 n1 of thewater column was 2 60 '10 of the total D-ATP (0 to100 m) early in the season but, as reflected in the moreconstant depth profiles seen in February and March,this proportion tended to decrease as the season progressed. The seasonal D-ATP concentrations were leastvariable at the well-mixed station in the Drake Passage(Stn 20). Depth-integrated (0 to 50 m and 0 to 100 m) DATP concentrations were also compared with simultaneously collected depth-integrated P-ATP ( 202 pm)data, representing total microbial biomass (Table 2).With the exception of the Stn 43 March 1987 results, DATP concentrations varied from 14.4 to 72.6 % of thetotal water column ATP (dissolved plus particulate)with no consistent temporal or spatial trends.compared to the particulate ratios using the 0 to 50 mmean ( k 1 standard deviation) values for the 5 stationson all 4 cruises (Table 4; Fig. 4). Several consistentpatterns emerged, including: (1) particulate ECA ratiosexhibited only a small range throughout the entireseason and study area and, with one exception (Stn 39,March 1987), varied from 0.58 to 0.74; (2) the meantotal microbial community ECA values were consistently below the theoretical minimum of 0.8 that isrequired for net growth to occur (Chapman & Atkinson1977); (3) dissolved ECA exhibited a much wider rangein values, from 0.25 to 0.71; and (4) early (December1986) season particulate and dissolved ECA were indistinguishable at all stations, but diverged widely thereafter with dissolved ECA ratios being consistently lessthan the corresponding particulate ECA ratios.D-ATP uptakePreliminary experiments conducted on the December1986 RACER cruise indicated that D-ATP was rapidlyassimilated by microorganisms present in the watercolun nand that the uptake rates were linear for at least24 h at in situ water temperatures. During the January1987 RACER cruise, D-ATP uptake rate and turnovertime were measured at all 5 stations and for all waterdepths sampled (Table 3; Fig. 3 ) . D-ATP turnover timesranged from 79 to 600 h , and were generally morerapid in the upper 0 to 30 m of the water colun n.Withthe exception of Stn 20, the most rapid turnover timeswere associated with the highest D-ATP water columnconcentrations indicating what we interpret to be arapid recycling (production coupled to uptake) of DATP. These data support the hypothesis that ATP israpidly produced in the euphotic zone of the watercolumn and is coupled to primary production processes.Dissolved and particulate adenylate energy chargeratiosECA ratios were calculated for dissolved and totalparticulate ( 202 vm) samples. Dissolved ratios wereDISCUSSIONAlthough D-ATP makes up only a small fraction ofthe DOM pool (i.e. 0.001 % of DOC), the sensitivitywith which it can be measured (detection limit ca 1 n gI-'), its apparent rapid turnover in seawater and itsstrict biological origin provide a unique basis for establishing the mechanism of transfer from POM to DOM(Azam & Hodson 1977, McGrath & Sullivan 1981).Dissolved nucleotides are both produced and taken upby microorganisms within seawater, i.e. they undergoturnover. The steady-state concentrations measured inthe present study area are a reflection of these 2 competing processes. During the initial stages of the springbloom, algal growth processes would b e expected todominate over microheterotrophic production or protozoan/metazoan grazing activities. If excretionfleakageof ATP from viable phytoplankton cells is the principlemechanism for D-ATP production, then one mightexpect to observe a n uncoupling of D-ATP productionfrom D-ATP consumption, resulting in a transientaccumulation of D-ATP in the water column during theinitiation and development of the bloom (NovemberDecember). If, on the other hand, D-ATP is derived
Mar Ecol. Prog. Ser. 57. 35-44. 198940Table 2 Comparison of 0 to 50 m a n d 0 to 100 m depth-integrated D-ATP and P-ATP water column inventories for 5 selectedRACER stations from December 1986 to March 1987StationMonth0-50 mD-ATP(mg m-')0-100 mD-ATPg,( m-2)0-50 mP-ATP(,gm-2)0-100 mP-ATP( m 9 m-2)0-50 m0-100 mD-ATP[D-ATP P-ATPJXlooD-ATP[D-ATPSP-ATPI("/.l("/.l13Dec 1986J a n 1987Feb 357.472.631.758.569.820J a n 1987Feb 1987Mar 21.725.831.814.439Dec 1986J a n 1987Feb 1987Mar .34.522.618.322.218.519.124.129.341.643Dec 1986J a n 1987Feb 1987Mar 19879.730.15.7 O. 7.720.3 2.012.133.916.92.048Dec 1986J a n 1987Feb 1987Mar .49.532.519.326.717.928.721.223.426 9primarily from the feeding activities of macro- or microzooplankton or as a result of cell death/autolysis onewould expect to observe a transient accumulation ofD-ATP during the decline of the spring bloom cycle(February-March) .The detection of D-ATP at all stations during the4 mo RACER program confirmed that D-ATP is aubiquitous component of the DOM pool of Antarcticecosystems. D-ATP concentrations varied over 3 ordersof magnitude from 1.0 to 1000 ng D-ATP 1-l. Thespatial a n d temporal variabihty observed reflects thecomplex physical character of the area a n d the attendant biological processes. O n e distinct feature was a ninshore-offshore gradient in D-ATP concentration.Large accumulations of D-ATP occurred in the protected embayment of Gerlache Strait a n d in the shallow, vertically well-mixed water of the frontal zone, butD-ATP concentrations were substantially lower at offshore stations a n d at the deep water station of theBransfield Strait. D-ATP is apparently either advectedinto the Peninsula area from a region with even higherD-ATP concentration or is produced a s the result oflocal biological activity. Although w e favor the lattermechanism, our present study was insufficient toresolve between D-ATP production a n d advectionbecause w e did not assess D-ATP production directly.However, without a continuous source of D-ATP forsurface seawaters in the RACER study area, the measured uptake rates would be sufficient to reduce theXl00ambient D-ATP concentrations to below our detectionlimits in a period of ca 1 to 2 wk as the water advectedthrough the study area.We evaluated 3 possible mechanisms of D-ATP production, including: (a) cell death and autolysis, (b)extracellular release and (c) release of cell contentsduring grazing activity. We predicted that if D-ATPwas produced as a result of cell death, a D-ATP peakwould occur with the decline of biomass, as reported byRiemann (1979); i.e. in late summer (February-March).Instead, a comparison of P-ATP and D-ATP concentrations showed a high degree of correlation betweenthese 2 parameters (Tables 1 and 2). P-ATP was highduring the first sampling in December and remainedhigh in January. Later in the season, D-ATP declinedconcomitant with P-ATP. Overall, there was a significant and positive correlation between P- and D-ATPmeasurements, especially in the early portion of theseason (Table 1). Consequently, w e conclude that theconcentration of D-ATP is positively correlated withmicrobial biomass.D-ATP was already present throughout the RACERstudy area in December, at the measured height ofphytoplankton productivity (Holm-Hansen et al. 1987).At this point, the mean intracellular ECA of the totalmicrobial community ( 202 pm) was slightly less thanthe 0.8 value that is indicative of a healthy, nonstressed population (Karl 1980). There are 2 possibleexplanations for this result: ( l ) the population as a
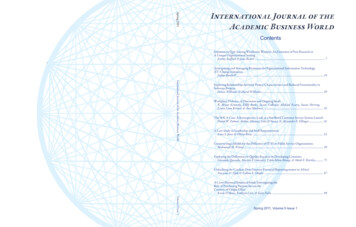
Nawrocki & Karl: Dissolved ATP dynamicsTable 3. Water column depth profiles of D-ATP uptake rateand estimated turnover time for 5 stations in the RACER studyarea in January 1987StationWaterD-ATPdepth take rate( n g 1-' d - l )41whole was physiologically stressed and the energycharge of all cells was on the decline, or (2) the population was heterogeneous, comprised of both healthycells with a relatively high energy charge and dying ordead cells with a relatively low energy charge, theaverage of which resulted in a less than optimal measured value. The high rates of phytoplankton andmicroheterotrophic production (Ba llff et al. 1987,Holm-Hansen et al. 1987) demonstrate that this was nota senescent population. It was more likely to be anassociation of actively growing cells with dead, dyingor dormant cells. In this regard it is worthwhile to pointout that diatom resting spores, which were common inthe water column throughout the period of our observations (Karl et al. unpubl.), might also contribute to therelatively low ECA measured for the particulate materials. Jewson et al. (1981) have previously shown that theECA ratio of a diatom-dominated phytoplankton crop inLough Neagh (N. Ireland) undergoes a systematic shiftfrom a value of 0.8 to 0.5 as resting spore formationtakes place.In addition to particulate ECA ratios, we also measured the ECA of the dissolved adenine nucleotidepools. To our knowledge, these are the first dissolvedEC, data to be reported. Although McGrath & Sullivan (1981) previously presented total adenine nucleotide pool (ATP ADP AMP) data for coastalwaters off Southern California, they did not include ordiscuss any ECA values. It was our belief that comparisons of the particulate and dissolved ECA for the samewater mass might help to identify, or eliminate, certainprocesses involved in the potential production of dissolved nucleotides. Our results indicate that the dissolved ECA ratios at each station during the Decembercruise were indistinguishable from the correspondingparticulate ECA ratios for each water mass sampled(Table 4; Fig. 4). This indicates that the dissolved ECAreflected the population as a whole, a s would b e predicted if D-ATP was produced by excretion/exudationby growing and non-growing cells or by indiscrimin- DISSOLVED ATP UPTAKE, ng I - ' d-lFig. 3. Uptake rates for D-ATP versusdepth for stations located in the RACERstudy area. All data are from the J a n 1987cruise100
Mar. Ecol. Prog. Ser 57. 3 5 4 4 , 198942Table 4 Dissolved and total particulate adenylate energy charge ratios for water samples collected at 5 stations in the RACERstudy area from December 1986 to March 1987. All data are mean values ( I standard deviation) estimated for the upper 50 m ofthe water columnStationDateDissolved ECAParticulate ECAD-EC,/P-ECA13Dec 1986J a n 1987Feb 19870.64 ( f 0 . 0 7 )0.57 ( f 0.10)0.35 ( t 0 . 3 5 )0.63 ( 5 0 . 11)0.66 ( 20.09)0.74 ( k 0 . 0 6 )1.020.890.4720Jan 1987Feb 1987Mar 19870.60 ( O.l6)0.42 ( 2 0 . 1 5 )0.46 ( k 0 . 2 3 )0.64 ( 2 0 . 0 8 )0.59 ( 2 0 . 0 6 )0.59 ( 0.10)0 940 710.78Dec 1986Jan 1987Feb 19870.59 (f0.11)0.39 ( f 0 . 0 5 )0 25 ( f 0 . 2 5 )0.58 ( t 0 . 0 5 )0.67 ( k 0 . 0 3 )0.44 ( 2 0 . 0 9 )1.010.580.57Dec 1986J a n 1987Feb 1987Mar 19870.710.510.440.49(20.03)(20.02)(20.02)( f 0.20)0.65 ( 2 0 . 0 3 )0.60 ( 2 0 . 1 3 )0.71 ( 2 0 . 0 6 )0.58 ( 2 0 . 0 9 )1.090.850.620.84Dec 1986J a n 1987Feb 19870.67 ( k 0 . 0 4 )0.63 (k0.24)0.56 ( f 0.09)0.68 ( 2 0 . 0 6 )0.70 (k0.24)0.70 (k0.05)0.980.900.80ant heterotrophic grazing activity. If the dissolvedadenine nucleotides were derived from only the dyingsegment of the population, the dissolved ECA wouldbe lower than the particulate ECA because only thesubpopulation of stressed or moribund cells with lowintracellular E C A would then contribute to theextracellular nucleotide pools. As phytoplankton cellsaccount for r 75% of the total microbial biomass inthe early portion of the bloom (Holm-Hansen et al.1987, Karl et al. unpubl.), they would appear to be alikely source of D-ATP. Later in the season, however,the particulate and dissolved E C A began to diverge(Table 4; Fig. 4). By the February and March cruisesthe dissolved and particulate ECA ratios were substantially different and D-ATP concentrations had subsided to barely detectable levels. Whlle these resultsmay be d u e to differential turnover rates of the individual dissolved adenine nucleotide compounds ordifferential rates of chemical hydrolysis, a more likelyexplanation would seem to be the resuIt of the greater contribution of dissolved nucleotides from dead ordying cells (with low E C A ) during the post-bloomperiod. Temporal biomass changes observed in theRACER study area are consistent with this conclusion.The peak accumulation of D-ATP occurred at 2 stations (nearshore Stn 43 and frontal zone Stn 13) inJanuary. This accumulation could, in theory, be theresult of either a decrease in D-ATP uptake rates or anincrease in D-ATP production rates, or both. D-ATPturnover rates measured in January were on the orderof days, not as rapid as reported from eutrophic BritishColumbia water (Azam & Hodson 1977), but similar inmagnitude to values measured in the western sector ofMcMurdo Sound (Holm-Hansen et al. 1977, Hodson etal. 1981a) and in the Gulf Stream frontal zone (Hodsonet al. 1981b).Grazing activity is a possible source of D-ATP thatwas not directly evaluated in the RACER program.However, an indirect assessment is possible by using2 complementary RACER data sets. The first is theenumeration of heterotrophic microflagellate ( 5220pm) populations by direct microscopy (G. Taylor & D.Bir
laboratory studies of microbial food web-induced nu- trient flux. Batch cultures which contained nanoprotist grazers along with bacteria and algae showed elevated concentrations of D-ATP and D-ATP/P-ATP ratios greater than 1. Flasks with only exponentially-growing bacteria and/or algae had persistently low levels of D- ATP (Berman et al. 1987).