Transcription
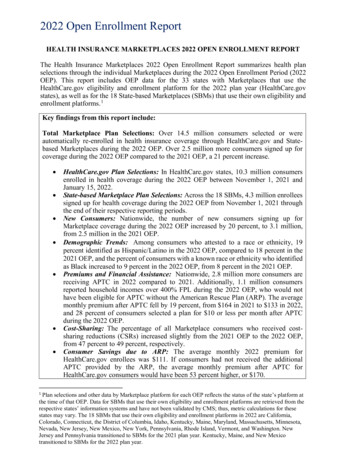
2022 Open Enrollment ReportHEALTH INSURANCE MARKETPLACES 2022 OPEN ENROLLMENT REPORTThe Health Insurance Marketplaces 2022 Open Enrollment Report summarizes health planselections through the individual Marketplaces during the 2022 Open Enrollment Period (2022OEP). This report includes OEP data for the 33 states with Marketplaces that use theHealthCare.gov eligibility and enrollment platform for the 2022 plan year (HealthCare.govstates), as well as for the 18 State-based Marketplaces (SBMs) that use their own eligibility andenrollment platforms. 1Key findings from this report include:Total Marketplace Plan Selections: Over 14.5 million consumers selected or wereautomatically re-enrolled in health insurance coverage through HealthCare.gov and Statebased Marketplaces during the 2022 OEP. Over 2.5 million more consumers signed up forcoverage during the 2022 OEP compared to the 2021 OEP, a 21 percent increase. HealthCare.gov Plan Selections: In HealthCare.gov states, 10.3 million consumersenrolled in health coverage during the 2022 OEP between November 1, 2021 andJanuary 15, 2022.State-based Marketplace Plan Selections: Across the 18 SBMs, 4.3 million enrolleessigned up for health coverage during the 2022 OEP from November 1, 2021 throughthe end of their respective reporting periods.New Consumers: Nationwide, the number of new consumers signing up forMarketplace coverage during the 2022 OEP increased by 20 percent, to 3.1 million,from 2.5 million in the 2021 OEP.Demographic Trends: Among consumers who attested to a race or ethnicity, 19percent identified as Hispanic/Latino in the 2022 OEP, compared to 18 percent in the2021 OEP, and the percent of consumers with a known race or ethnicity who identifiedas Black increased to 9 percent in the 2022 OEP, from 8 percent in the 2021 OEP.Premiums and Financial Assistance: Nationwide, 2.8 million more consumers arereceiving APTC in 2022 compared to 2021. Additionally, 1.1 million consumersreported household incomes over 400% FPL during the 2022 OEP, who would nothave been eligible for APTC without the American Rescue Plan (ARP). The averagemonthly premium after APTC fell by 19 percent, from 164 in 2021 to 133 in 2022,and 28 percent of consumers selected a plan for 10 or less per month after APTCduring the 2022 OEP.Cost-Sharing: The percentage of all Marketplace consumers who received costsharing reductions (CSRs) increased slightly from the 2021 OEP to the 2022 OEP,from 47 percent to 49 percent, respectively.Consumer Savings due to ARP: The average monthly 2022 premium forHealthCare.gov enrollees was 111. If consumers had not received the additionalAPTC provided by the ARP, the average monthly premium after APTC forHealthCare.gov consumers would have been 53 percent higher, or 170.Plan selections and other data by Marketplace platform for each OEP reflects the status of the state’s platform atthe time of that OEP. Data for SBMs that use their own eligibility and enrollment platforms are retrieved from therespective states’ information systems and have not been validated by CMS; thus, metric calculations for thesestates may vary. The 18 SBMs that use their own eligibility and enrollment platforms in 2022 are California,Colorado, Connecticut, the District of Columbia, Idaho, Kentucky, Maine, Maryland, Massachusetts, Minnesota,Nevada, New Jersey, New Mexico, New York, Pennsylvania, Rhode Island, Vermont, and Washington. NewJersey and Pennsylvania transitioned to SBMs for the 2021 plan year. Kentucky, Maine, and New Mexicotransitioned to SBMs for the 2022 plan year.1
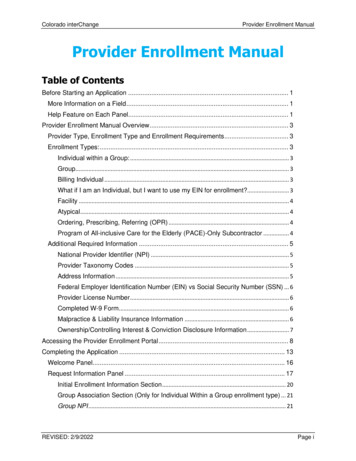
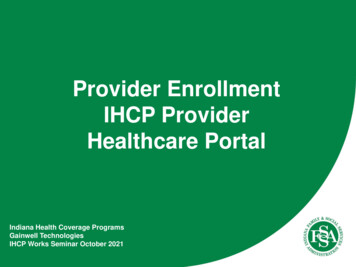
CONSUMERS SELECTING PLANS THROUGH THE MARKETPLACES: 50STATES, PLUS DCOver 14.5 million consumers selected or were automatically re-enrolled 2 in a Marketplace planduring the 2022 OEP. This includes 10.3 million consumers in states using the HealthCare.govplatform and 4.3 million consumers in SBMs using their own platforms (see Figure 1).Figure 1: Plan Selections during 2018 – 2022 Open Enrollment Periods 3HealthCare.gov StatesState-based 10.3M202022Nationwide, the number of plan selections during the 2022 OEP increased by 21 percent incomparison to the 2021 OEP (see Table 1). In HealthCare.gov states, plan selections increasedby 24 percent, to 10.3 million from 8.3 million during the 2021 OEP, while SBM plan selectionsincreased by 13 percent from 3.8 million in 2021 to 4.3 million in 2022. The HealthCare.govdata reported reflects the HealthCare.gov platform’s 2022 OEP from November 1, 2021 throughJanuary 15, 2022. For the SBMs, the number of plan selections included in this report reflectsthe timeframe of each SBM’s active 2022 OEP, which varies by state.At the state level, more than half of states saw increases in plan selections of 10 percent or more.Generally, Medicaid non-expansion states, which comprised over half of total 2022 OEPenrollment, saw higher enrollment increases than expansion states. The states with the greatestincreases in plan selections included Texas (42%), Georgia (36%), Arkansas (33%), SouthDakota (32%), and North Dakota (32%). In contrast, the states with the lowest increases in planAs in prior years, consumers with coverage at the end of 2021 who did not make an active selection weregenerally automatically re-enrolled for 2022. When consumers had 2022 Marketplace plans available to themfrom their 2021 issuer, they were automatically re-enrolled into the same plan as 2021 or a different plan from thesame issuer. Depending on the Marketplace, they could also be automatically re-enrolled into a suggestedalternate plan from a different issuer, if no plan from their current issuer was available to them.3For HealthCare.gov states: the 2018 OEP was from 11/1/2017 to 12/15/2017 with data reported through12/23/2017; the 2019 OEP was from 11/1/2018 to 12/15/2018 with data reported through 12/22/2018 (thisincludes the additional time provided to consumers who were unable to enroll by the original deadline); the 2020OEP was from 11/1/2019 to 12/15/2019 with data reported from 11/1/2019 to 12/21/2019 (this includes theadditional time provided to consumers who were unable to enroll by the original deadline); the 2021 OEP wasfrom 11/1/2020 to 12/15/2020 with data reported through 12/21/2020 (this includes the additional time providedto consumers who were unable to enroll by the original deadline); the 2022 OEP was from 11/1/2021 to 1/15/2022with data reported through 1/15/2022. Dates through which data are reported vary for SBMs; see the PUF FAQsfor detailed information.2
selections included Idaho (7%), New Mexico (6%), Oregon and Rhode Island (4%), and NewYork (3%).Table 1: OEP Plan Selections by niaColoradoConnecticutDelawareDistrict of kaNevadaNew HampshireNew JerseyNew MexicoNew YorkNorth CarolinaNorth DakotaOhioOklahomaOregonPennsylvaniaRhode IslandSouth CarolinaSouth DakotaPlatformHealthCare.gov & 375% %25%32%29%10%4%11%4%31%32%
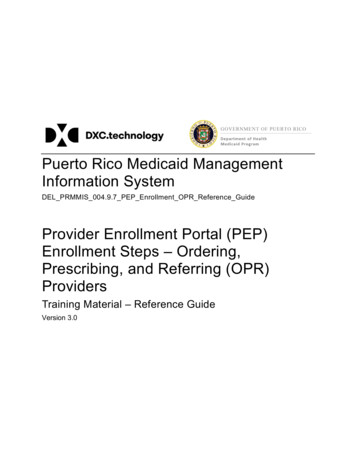
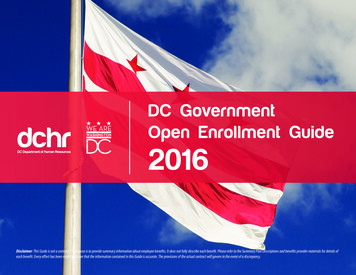
st 9,381191,70226,728% Change29%42%24%7%18%8%19%11%30%Table 2 shows enrollment for states that have implemented Basic Health Programs (BHP). InNew York and Minnesota, consumers with household incomes at or below 200 percent of theFPL who are not eligible for Medicaid or the Children’s Health Insurance Program (CHIP) whoapply for coverage are enrolled in the applicable state Basic Health Program instead of aQualified Health Plan (QHP). Year over year, total BHP enrollment increased 8 percent fromapproximately 975,000 enrollees in the 2021 OEP to approximately 1.1 million enrollees duringthe 2022 OEP. Minnesota’s BHP enrollment increased by 7 percent and New York’s increasedby 8 percent from 2021 to 2022.Table 2: Basic Health Program (BHP) Enrollment 4StateTotalMinnesotaNew ,451Figure 2 compares new and returning consumer plan selections nationwide during OEPs from2018-2022. During the 2022 OEP, new consumer plan selections through all Marketplacesexceeded 3 million for the first time since 2018, and increased 20 percent from the 2021 OEP,despite the 2.8 million new plan selections under the 2021 Special Enrollment Period that wasmade available from February 15 to August 15, 2021 on HealthCare.gov, and through varyingdates for SBMs. As demonstrated below, 11.4 million enrollees returned to the Marketplacesactively or through auto re-enrollment, a 21 percent increase from 9.5 million in 2021.4New York's BHP is known as the Essential Plan and Minnesota's BHP is known as MinnesotaCare.
Figure 2: New and Returning Consumer Plan Selections during 2018 – 2022 OpenEnrollment PeriodsNew ConsumersReturning .5M3.1M2020182019202020212022Table 3 summarizes consumers who selected plans during the 2022 OEP by enrollment type.Nationally, new and actively returning consumers’ plan selections as a percentage of total planselections remained steady from the 2021 OEP to the 2022 OEP at 21 percent and 46 percentrespectively. Similar to 2021, in HealthCare.gov states, 23 percent of enrollees represented newconsumers while 55 percent were consumers who actively returned to the HealthCare.govplatform. For states using SBM platforms, 16 percent of plan selections were new consumersand 25 percent were actively returning. Additional plan selection and demographic data for all50 states plus DC are provided in the accompanying PUFs.Table 3: Summary of OEP Plan Selections by Enrollment TypeCount2022Count2021New Consumers: All States3,066,360 2,545,559Returning Consumers Re-enrolling in Coverage:11,444,717 9,458,806All StatesActive Re-enrollees: All States6,742,948 5,513,796Automatic Re-enrollees: All States4,701,769 3,945,010HealthCare.gov StatesNew Consumers: HC.gov States2,380,835 1,884,174Returning Consumers Re-enrolling in Coverage:7,874,801 6,367,529HC.gov StatesActive Re-enrollees: HC.gov States5,680,878 4,648,617Automatic Re-enrollees: HC.gov States2,193,923 1,718,912State-based MarketplacesNew Consumers: SBMs685,525661,385Returning Consumers Re-enrolling in Coverage: SBMs 3,569,916 3,091,277Active Re-enrollees: SBMs1,062,070865,179Automatic Re-enrollees: SBMs2,507,846 2,226,098Total Plan Selections: All States14,511,077 12,004,365Total Plan Selections: HC.gov States10,255,636 8,251,703Total Plan Selections: SBMs4,255,441 3,752,662% ofTotal202221% 0010010018822359100100100
CONSUMERS APPLYING FOR AND SELECTING PLANS: DETAILSReported below are statistics on the individuals who requested coverage on submittedapplications for the 2022 and 2021 OEPs. During the 2022 OEP, 68 percent of applicantsrequesting coverage through the Marketplaces were determined eligible to make a Marketplaceplan selection, compared to 66 percent during the 2021 OEP. On the HealthCare.gov platform,94 percent of applicants were determined eligible to make a Marketplace plan selection, and 44percent of applicants using the SBMs were determined eligible to make a plan selection. Thepercentage of consumers who applied for coverage through HealthCare.gov and werepreliminarily determined eligible for their state’s Medicaid or Children’s Health InsuranceProgram (CHIP) fell by 2 percentage points to 6 percent in comparison to 2021.Table 4: Marketplaces Application Activity and Eligibility for 2022 and 2021% ofTotal2022% ofTotal202125,830,064 22,186,05510010017,485,459 14,696,181HealthCare.gov States68661001009469381001004444Count2022Consumers Requesting Coverage onApplications Submitted – All StatesMarketplace Eligible – All StatesCount2021Consumers Requesting Coverage on12,194,577 9,932,394Applications Submitted – HC.gov States 5Marketplace Eligible – HC.gov States511,486,135 9,249,680Medicaid/CHIP Eligible – HC.gov States743,544762,533State-based Marketplaces 6Consumers Requesting Coverage on13,635,487 12,253,661Applications Submitted – SBMsMarketplace Eligible - SBMs5,999,324 5,446,501Table 5 shows demographic and plan characteristics among consumers who selected or wereautomatically re-enrolled in a plan during the 2022 and 2021 OEPs. Some of the changes in the2022 OEP demographic composition and plan choices of consumers can be attributed to theimpacts of the ARP. For example, the percent of consumers with a household income over 400%FPL increased by 4 percentage-points for HealthCare.gov states and SBMs, from 2 percent and6 percent in 2021 to 6 percent and 10 percent in 2022 respectively. Nationally, during the 2022OEP, 89 percent of consumers had their premiums reduced by APTC compared to 85 percent inthe 2021 OEP. 92 percent of HealthCare.gov consumers had plan selections with APTCcompared to 88 percent in 2021 while 83 percent of SBM consumers had plan selections withAPTC compared to 78 percent in 2021. The percentage of all Marketplace consumers whoreceived cost-sharing reductions (CSRs) increased slightly from 47 percent during the 2021 OEPThe Consumers Requesting Coverage on Applications Submitted and Consumers Determined Eligible for QHPmetrics have an updated methodology this year that consistently excludes auto re-enrollment applicationsassociated with only cancelled policies. Such applications are considered operational artifacts, rather than trueapplication submissions. To allow for cross-year comparison, the 2021 values for these metrics were recalculatedusing the updated methodology and differ from what was published in last year's Open Enrollment snapshots andfinal report.6Most State-based Marketplaces have integrated eligibility systems with their State Medicaid. In those states,Consumers Requesting Coverage on Applications Submitted includes applications received for MAGI Medicaidrenewals, in addition to QHP renewal applications and new applications. Some SBMs do not report on consumersdetermined eligible for Medicaid/CHIP and thus a total number is not provided here. See the PUF definitions forfurther information.5
to 49 percent during the 2022 OEP. Over 30 percent of 2022 OEP HealthCare.gov enrolleesselected plans that cover 94 percent of their expected health care costs (94% AV).Table 5: Demographic and Plan Characteristics of Consumers with OEP Plan Selections(HealthCare.gov States and SBMs, Unless Otherwise Noted)Age 1818 - 3435 - 5455 GenderFemaleMaleLocation: HealthCare.gov StatesRuralNon-ruralHousehold Income: HealthCare.gov States 100% 100% and 150% 100% and 138% 150% and 250% 250% and 400% 400% FPLOther Household Income 8Household Income: SBMs 9 100% 100% and 150% 100% and 138% 150% and 250% 250% and 400% 400% FPLOther Household Income8Financial AssistanceWith APTC: All StatesHealthCare.gov StatesSBMsWith CSR: All States9HealthCare.gov States73% AV87% AV94% AVAmerican Indian/Alaskan NativeSBMs9% of Total 72022% of 5137858878475141234139Totals may not sum to 100% due to rounding.Other household income includes plan selections for which consumers were not requesting financial assistanceand unknown household income. Please see PUFs for more information.9Idaho has been excluded from SBM household income metrics as Idaho’s household income data was notavailable for both years at the time of this report. Nevada has been excluded from SBM CSR metrics as Nevada’sCSR data was not available for both years at the time of this report.78
Metal LevelCatastrophicBronzeSilverGoldPlatinum% of Total 72022% of Total72021132561011355581Table 6 provides race and ethnicity demographics for all consumers who enrolled in plans duringthe 2022 OEP. Overall, among consumers who attested to a race or ethnicity, 19 percentidentified as Hispanic/Latino in the 2022 OEP, compared to 18 percent in the 2021 OEP. Thepercentage of consumers who self-reported as Black, Non-Hispanic increased to 9 percent from8 percent in 2021. Similarly, 20 percent of HealthCare.gov consumers attested to beingHispanic/Latino, an increase from 19 percent in 2021, and 11 percent of enrollees self-reportedas Black compared to 9 percent in 2021. SBM consumers who identified as Hispanic/Latinoincreased from 17 percent to 18 percent from 2021 to 2022, and those who attested to beingBlack remained steady at 5 percent for 2022 and 2021.Table 6: Race and Ethnicity Demographics of Consumers with OEP Plan SelectionsRace/Ethnicity: All StatesRace/Ethnicity KnownHispanic/LatinoWhite, Non-HispanicBlack, Non-HispanicAsian, Non-HispanicNative Hawaiian/Pacific Islander, Non-HispanicAmerican Indian/Alaska Native, Non-HispanicOther, Non-HispanicMulti-Racial, Non-HispanicRace/Ethnicity Unknown, Non-HispanicRace/Ethnicity: HealthCare.gov StatesRace/Ethnicity KnownHispanic/LatinoWhite, Non-HispanicBlack, Non-HispanicAsian, Non-HispanicNative Hawaiian/Pacific Islander, Non-HispanicAmerican Indian/Alaska Native, Non-HispanicOther, Non-HispanicMulti-Racial, Non-HispanicRace/Ethnicity Unknown, Non-Hispanic10Totals may not sum to 100% due to rounding.% of Total 102022% of Total102021671955912 112233691857813 11NA231622056119 11123866195999 111234
Race/Ethnicity: SBMs 11Race/Ethnicity KnownHispanic/LatinoWhite, Non-HispanicBlack, Non-HispanicAsian, Non-HispanicNative Hawaiian/Pacific Islander, Non-HispanicAmerican Indian/Alaska Native, Non-HispanicOther, Non-HispanicMulti-Racial, Non-HispanicRace/Ethnicity Unknown, Non-Hispanic% of Total 102022% of Total102021791853517 1 15221741755519 1 1NA226CONSUMER PREMIUMS AND FINANCIAL ASSISTANCETable 7 shows the average premiums for consumers who made plan selections in theMarketplaces during the 2022 OEP. Nationally, the average monthly premium after APTCdecreased by 19 percent from 164 in 2021 to 133 in 2022 and 28 percent of consumers selecteda plan for 10 or less per month after APTC. Likewise, the average monthly APTC for allconsumers increased by 4 percent from 485 in 2021 to 505 in 2022.The average monthly premium after APTC for all HealthCare.gov consumers fell 22 percent,from 143 in 2021 to 111 in 2022. The expansion in financial assistance for consumers resultedin a 3 percent increase of the average monthly APTC amount for HealthCare.gov enrollees, from 509 in 2021 to 524 in 2022. As shown in table 7, 32 percent of all HealthCare.gov consumershad a plan selection with a premium of 10 or less per month after APTC, a 14 percentage-pointincrease from 18 percent in 2021. Similarly, 38 percent of new HealthCare.gov enrollees and 30percent of returning enrollees benefited from a plan selection with a premium of 10 or less afterAPTC in 2022.In the SBMs, the average monthly premium after APTC decreased by 10 percent to 188 in 2022from 210 in 2021. Of all SBM consumers who enrolled in plans through the 2022 OEP, 19percent selected plans that were 10 or less per month.SBM race/ethnicity breakouts for the 2022 OEP do not add up to total plan selections as WA reportedconsumers choosing more than one race in multiple categories. SBM race/ethnicity breakouts for the 2021 OEPdo not add up to total plan selections as NY, VT, and WA reported consumers choosing more than one race inmultiple categories. Some SBM applications do not include Other or Multi-Racial as an option. Colorado did notreport race or ethnicity metrics for the 2021 OEP so is excluded from the metrics for both years.11
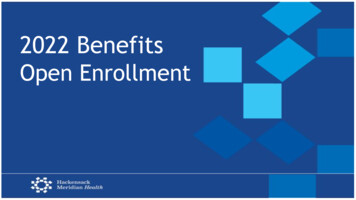
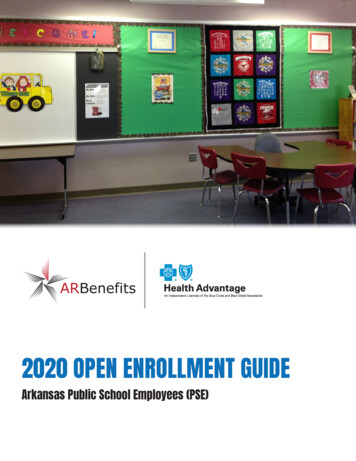
Table 7: Average Monthly Premium before and after APTC% of PlanSelectionswith 10Premiumafter APTC2022: All Consumers 122021: All Consumers122022: All Consumers2022: New Consumers2022: Returning ConsumersActively Re-enrolledAuto Re-enrolled2021: All Consumers2021: New Consumers2021: Returning ConsumersActively Re-enrolledAuto Re-enrolled2022: All Consumers122021: All Consumers12AverageMonthlyPremiumafter APTCAll States28% 133NA 164HealthCare.gov States32% 11138% 10630% 11232% 9924% 14818% 14323% 11916% 15117% 12913% 210State-based Marketplaces19% 188NA TCAmount forConsumersReceivingAPTC 585 579 505 485 594 538 611 615 601 590 533 607 611 596 524 473 540 545 526 509 468 521 529 496 563 553 452 426Figure 3 illustrates the distributions of monthly premiums after APTC for HealthCare.govconsumers during the 2021 and 2022 Open Enrollment Periods. Despite the increase inconsumers with higher incomes, which would drive average net premiums up, 2022 coveragewas made more affordable for consumers in comparison to the 2021 OEP due to the expandedAPTC provided by the ARP. During the 2022 OEP, 22 percent of consumers selected plans witha 0 monthly premium after APTC, versus 14 percent during the 2021 OEP, and over half of2022 OEP consumers had premiums of 50 or less after APTC, an increase of 13 percentagepoints from 2021.Nevada has been excluded from average APTC and average premium metrics as this data was not available atthe time of this report.12
Figure 3: 2021 and 2022 OEP Premium Distribution in HealthCare.gov States 13100%Distribution of Plan Selections18%80%14%17%23%15%60%18%40% 020%2021 OEP 50 - 100 0 - 5028%0% 250 100 - 25033%14%NetPremiumRanges22%2022 OEPTable 8 details average 2022 monthly premiums for consumers in HealthCare.gov states due tothe APTC expansion made available through the ARP. The table also simulates what the averagemonthly premium would be, for each HealthCare.gov state, without the ARP APTC expansion,assuming the same level and demographic composition of enrollment and plan choices. Theaverage monthly premium for 2022 would have been 170, 53 percent higher than the averagepremium enrollees will actually pay in 2022 under ARP. In 23 states, monthly premiums wouldrise by at least 50 percent, on average, without the ARP expansion. In 30 of the 33HealthCare.gov states, the difference in the actual average monthly 2022 premium with APTCand the average monthly 2022 premium without ARP expansion was at least 50, which wouldequate to a 2,500 increase in premiums annually.The 2021 OEP distribution of monthly premiums after APTC has been adjusted to exclude states thattransitioned to SBMs for the 2022 coverage year (Kentucky, Maine, and New Mexico), therefore, these numbersmay not match what was previously published.13
Table 8: HealthCare.gov Consumer Savings due to ARP 14StateActual AverageMonthly 2022Premium withARP APTCExpansionAverageMonthly 2022PremiumwithoutARP APTCExpansion PremiumIncreasewithout ARPATPCExpansion% PremiumIncreasewithout asLouisianaMichiganMissouriMississippiMontanaNorth CarolinaNorth DakotaNebraskaNew HampshireOhioOklahomaOregonSouth CarolinaSouth DakotaTennesseeTexasUtahVirginiaWisconsinWest VirginiaWyoming 111 158 96 134 180 169 80 105 164 135 204 193 149 157 170 137 72 142 96 100 121 212 230 93 201 107 91 128 86 62 126 161 204 88 170 255 158 207 250 270 129 155 235 233 281 266 214 242 236 205 120 225 159 180 219 272 298 153 284 167 178 188 133 115 197 251 332 203 59 97 62 73 69 101 49 50 71 97 78 73 65 85 66 68 48 83 63 80 98 60 68 60 82 60 87 60 47 53 71 90 128 3%132%The Average Monthly 2022 Premium without ARP Expansion metric calculates APTC assuming a consumers’income, family composition, and OE 2022 plan selection remain the same. However, in the absence of theexpanded APTC available from the ARP, some consumers would choose not to enroll at all and others wouldselect less generous plans with lower premiums. APTC is calculated with the applicable percentages that would bein effect without the ARP. For coverage year 2022, the applicable percentages at 26 CFR 1.36B-3(g)(2) would bemultiplied by 1.0113319445, the excess of the rate of premium growth over the rate of income growth for 2013 to2021 (Patient Protection and Affordable Care Act; HHS Notice of Benefit and Payment Parameters for 2022 andPharmacy Benefit Manager Standards; Final Rule, 86 FR 24140 at 24228).14
Appendix A:Public Use FilesPublic Use Files Contents: More information on applications and plan selections is available ina suite of accompanying public use files (PUFs). The PUFs contain information on applicationssubmitted and the number of medical and stand-alone dental plan selections by state, county andZIP code. The 2022 OEP State-Level PUF includes other plan and demographic informationincluding the metal level of selected plans, premium and financial assistance information, age,gender, rural location, self-reported race and ethnicity, and household income as a percentage ofthe FPL. Within the 2022 OEP State, Metal Level, and Enrollment Status PUF, data are stratifiedby new, returning, and automatically re-enrolled consumers and by plan metal level. Themethodology for this report and detailed metric definitions are included in the materials for thePUFs. The state-level PUFs can be found at: lment-period-public-use-files
The Health Insurance Marketplaces 2022 Open Enrollment Report summarizes health plan selections through the individual Marketplaces during the 2022 Open Enrollment Period (2022 OEP). This report includes OEP data for 33 states with Marketplaces that use the the HealthCare.gov eligibility and enrollment platform for the 2022 plan year .