Transcription
Introducing theTools forContinuous Improvement
The ConceptIn today’s highly competitive business environment it hasbecome a truism that only the fittest survive. Organisationsinvest in many different aspects of managing their business inorder to remain competitive.There is one single concept which can provide a competitiveedge. A concept which will directly contribute to bottom lineprofit. And that is the concept of Continuous Improvement.No matter whether you invest in business management systemsor services they can always be improved. There is a sayingthat may well be true in your own organisation – “unless youcan measure something then you won’t realise an improvement”The Tools you will be exposed to in this presentation willprovide you with an opportunity to measure almost anything.You will be learning how to use the Tools for ContinuousImprovement. Each Tool is used for a particular purpose asyou will see later. Make yourself familiar with the names of theTools.
Principal Areas For ImprovementThere are three key areas which contribute to the efficiency andeffectiveness of an organisation. These involve? the reduction of waste? the way we do our job? the way any process is undertaken.To improve any one of these we need to :? observe all our actions and the consequences? record what we see in some detail? analyse the resultsFACILITATED GROUP OR REFLECTIVE EXERCISEDiscuss which areas in your organisation you feel would benefitfrom improvement.Make a list of these for future reference.What do you think you would need to measure?
INTRODUCTION
How would you go about helping toreduce waste? Or find ways to reduce thetime taken to see a customer? Where doyou start? How do you begin to break thetask into manageable bite size pieces.Whether you are providing a servicemanufacturing something, or simplytrying to do a job better, there are anumber of simple Tools that can helpyou understand and improve the waythings are done.This programme is an introduction tothe Tools for ContinuousImprovement. It will show in simpleterms how each Tool is constructed,and outline when and why they areused.
Before exploring the specific Tools, let’s start by having a quicklook at what’s involved in improving a process.A process can be anything from a production line to serving acustomer. To improve a process you need to have a clear pictureof what’s actually happening not what you think is happening, orwhat’s happening in theory, but how the process is actuallyworking.You gather information about the process by talking to the peopleinvolved, watching, and recording. Then analyse the information,or, data to isolate the opportunity to improve the process.For example, you might think that thegreatest cause of waste in manufacturingbuns is caused by product falling on thefloor. However, after gathering andanalysing information about the process,it turns out that there is much morewastage from buns being upside down.
Some of the Continuous ImprovementTools relate to how you look at theprocess, some at how you analyse andpresent the data. We’ll be looking at eachTool with examples of how they apply intwo different work environments: a largebakery; and a hospital clinic.
The Tools?Flow chartsCause and effect diagramsCheck sheetsPareto charts?HistogramsScatter diagramsRun chartsControl charts
Areas for Improvement?How do you reduce waste ?How do you do a job better ?How do you improve a process ?WatchRecordAnalyse
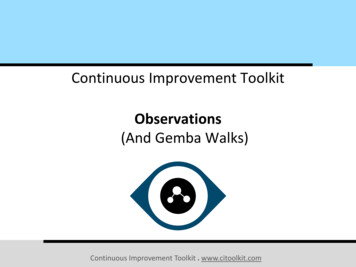
THE PROCESS FOR CONTINUOUS IMPROVEMENTThings do not improve on their own! There is a mechanism forimprovement. First you need to Plan carefully what you are going to doand the sequence in which you will do it. Next you Do it. Then youCheck that what you intended to do is being done as you expected.Finally you Act on the results to improve your plan until you achieve whatyou set out to achieve.The whole process is then repeated continuously; that’s whatContinuous Improvement means.The ProcessWHAT is the Continuous ImprovementProcess ?ActPlanCheckDo
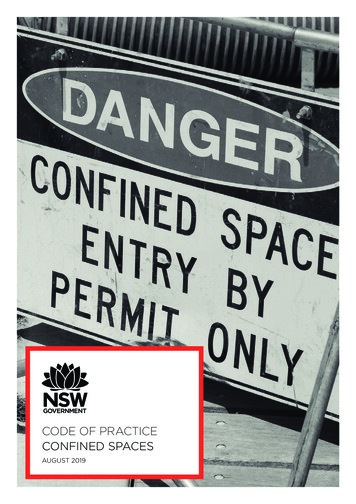
ORGANISING THE STAFFTo ensure that there is commitment from everyone in yourorganisation to the process of Continuous Improvement they all needto be involved. Each person in the organisation has a role to play.Senior Management are typically responsible for laying down thePolicy on Continuous Improvement. They will certainly need to seethat the process is resourced properly.A Quality Improvement Team can be set up consisting of keymanagers and supervisors. Their role will be to agree and prioritiseareas for improvement and decide on targets.The Quality Action Teams, normally lead by one of the keymanagers, undertake the task of collecting and analysing the data,providing the solutions and implementing them.FACILITATED GROUP OR REFLECTIVE EXERCISEDecide who will be members of your teams. Don’t forget to takeinto account the areas you feel will benefit from improvement.Who are involved in these areas? These should be the peoplein the team to find the solution.Draw up a list of the teams you will require.Which manager will head up which team?
The PeopleThe Team StructureExecutive : PolicyQualityAction TeamQualityAction TeamQuality Improvement TeamQualityAction TeamQualityAction Team
FLOW CHARTS
Flow ChartsWHAT is a Flow Chart used for ?Used to describe a processTo see the different activities or tasksinvolved in a processTo provide a clear picture of what ishappeningAllows for standardised practices
Flow ChartsWHEN are Flow Charts used ?Can be used for any processEnables problem areas to be identifiedUsed to identify unnecessary loops of activities
Flow ChartsHOW is a Flow Chart constructed ?The following symbols are used for different parts ofthe process :?Each process has a start and end?Each activity is identified?Decision points are identified?Other complex processes may be involved?All records are identified
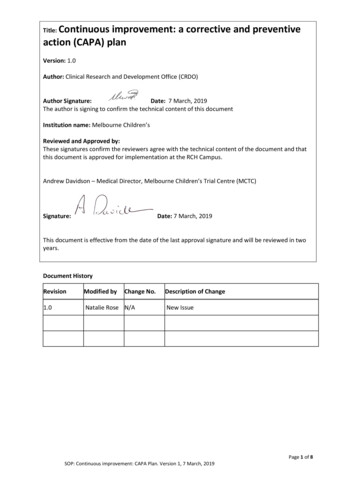
Flow PassinspectionMake doughRecordtemperatureCrumb ordiscardYesBunsslicedDough piecesinto trayNoRecordRecordingredientsweightPacked andstoredProofed &bakedStopRecordslice height
To begin with, let’s have a look ata Tool for helping you see what’shappening within a process.A Flow chart is a graphic Tool that showshow a process works. It can be applied toany process from manufacturing buns tothe steps involved in admitting patients.The Flow Chart helps us to illustrate andunderstand the different activities thatmake up a process.For example, if you want to make surethat patients are given proper care withoutunnecessary delay, you’ll need to followevery activity that effects the patient fromreception, through to when they leave theclinic.
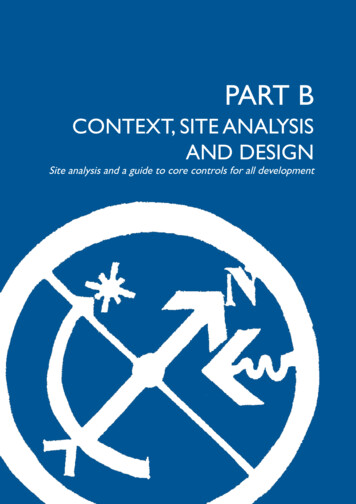
To see how a Flow Chart works, let’s look at theprocess of making buns.It’s important that you are clear on what the process ismeant to achieve in this case : packaged buns. You canthen define the boundaries of the process you will FlowChart. We’ll begin with weighing the ingredients, andend with the finished buns packed and ready fordistribution.Flow Charts use a number ofsymbols to show different parts of aprocess.An oval is used to show where theprocess begins and ends.
So we commence drawingthe Flow Chart with the ‘Start’oval. An arrow is then used toindicate the direction of theflow.Each specific activity performed in theprocess is represented by a rectangle.In our example, the first activity inproducing buns is the weighing of theingredients, so the words ‘WeighingIngredients’ are placed in the first activityrectangle.When a set of activities is toocomplex to be shown on the samechart, a circle is used. The processof ordering, receiving and storingthe ingredients can therefore berepresented by a circle linked to thefirst rectangle by an arrow.
What happens next? Afterbeing weighed, the ingredientsare mixed into a dough. Anarrow connects the activities,and ‘Make Dough’ is placed inthe next rectangle.Whenever a document is produced inthe process, a rectangle with a wavy lineis used.As each dough is made, a record is keptof the temperature. The documentrecording the temperature is thereforerepresented by placing a rectangle with awavy line next to the ‘Make Dough’rectangle.The Flow Charting continues inthis way to cover the variousactivities in the process.
Where a decision is made in theprocess, a diamond is used. It usuallyindicates a simple ‘yes’ or ‘no’.In this process as buns ‘PassInspection’, they move on to be‘Sliced’, then ‘Packed and Stored’.However, if they fail inspection theyare either crumbed or disposed of,depending upon demand.Once all the parts of theprocess have been included,the ‘Stop’ oval indicates the endof the Flow Chart.Flow Charts can be simple orcomplex, depending upon theprocess involved.
In the case of our hospital example, aFlow Chart of the steps involved in apatient’s visit would look like this.The Flow Chart enables us to pinpoint areas and unnecessaryloops or activities, and to find opportunities for improvement.It also enables us to identify activities that have a major effecton performance. For example, you might find that a particulartask is causing unnecessary delays in the process.Finally through creating the Flow Chart, and getting input fromthe people involved, you are able to standardise the way thingsare done.
Flow ChartsExerciseDraw a Flow Chart for the process you areinvolved in at work.What records (or Forms) have you identified?Where does the process fail ? identify the actualactivity involved?
CAUSE AND EFFECTDIAGRAMS
Cause and Effect DiagramWHAT is a Cause and Effect diagramused for ?Used to identify all the Causes which contribute to aparticular EffectUsed to aid Brainstorming
Cause and Effect DiagramWHEN are Cause and Effectdiagrams used ?Used to identify things which combine to give aProblemor?Used to look at the various factors which contributeto produce a Desired Outcome
Cause and Effect DiagramHOW is a Cause and Effect diagramconstructed ?The following steps are taken :? The Problem or Desired Outcome is placed at thehead of a Fishbone skeleton? The main categories of Causes are identified? The categories are Brainstormed to identifyspecific contributory Causes
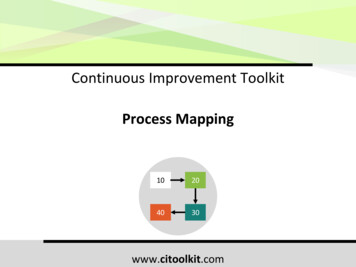
Cause and Effect octorInterruption ofadmissionsMedicalstudentsBooking-inlocation
Tools like the Flow Chart can helpdescribe a process. But how do youidentify opportunities for improvement?What are the contributing factors? Whichdo you tackle first? And once a changehas been made, how can you tell if it hasin fact been an improvement?Information from people isimportant, but it needs to bebacked up by objective data measuring things to get the factsabout a process.By comparing measurements made beforeand after a change, it’s possible to gaugethe effect of the change on the process.There are a number of Tools that enableus to clearly present and analyse the data.
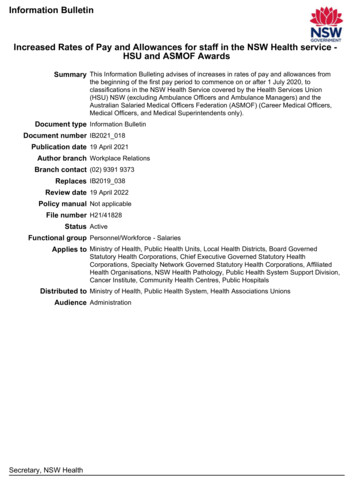
The Cause and Effect Diagram isa Tool that enables you to identifyall the causes that contribute to aparticular effect.It’s used to look at the differentthings that combine to cause agiven problem, or the variousfactors that are necessary toproduce a desired outcome.Brainstorming can be a useful aid when using continuousimprovement tools particularly when constructing a Causeand Effect Diagram. Working together, a group of peopleinvolved in a process are able to think more freely, buildingon each other’s ideas to identify and explore all the possiblecauses behind the effect you are studying.In our example, we’ll be identifying the causes that upset thesmooth flow of patients through the clinic - causes like theinterruptions created by phone enquiries.
Because it’s reminiscent of a fishskeleton, the Cause and EffectDiagram is sometimes called a FishBone Diagram. You begin by placingthe effect (the problem, or desiredoutcome) in a box at the ‘head’ of thediagram.In our example, the effect we areanalysing is interruptions toAdmissions.You next need to work out themain categories of causes thatcontribute to interrupting theflow.In our examples, these wouldbe Patient Phone Enquiries,Internal Enquiries, AssistingDoctors, Medical Students,and the Booking-In Location.
Having decided on the categories,further brainstorming will allow youto be more specific about thecontributing causes. These arethen included under theappropriate category.For example, under Patient Phone Enquiries, delays arecaused by advising other patients over the phone, andwaiting for doctors to answer their pagers.Under Internal Enquiries, there are general phone calls,ward enquiries, Registered Nurse enquiries, and so on.You’ll have to use common sense to know when to stopadding causes to the chart. It’s usually when you’vecovered each category and the ideas start to slow down.
The bakery ‘Cause and Effect’ Diagramwas helpful in working out the causesresponsible for waste in the making ofbuns. In this case, the causes fell under theheadings; people, methods, machines,materials and environment. These generalheadings are often used as they can helpguide you to the contributing causes.‘Cause and Effect’ Diagrams can be usedwhenever you need to trace a problem backto its root causes. They also allow you to workout the things that need to be looked at toachieve a desired result.
Cause and Effect DiagramExerciseDraw a Cause and Effect diagram for any Problem youhave experienced at work.Which is the most probable specific Cause ofthe Problem?What is the solution to the Problem?
CHECK SHEETS
Check SheetsWHAT is a Check Sheet used for ?Used to collect Data about an activity in a way thatis easy to use and analyse
Check SheetsWHEN is a Check Sheet used ?Used to count the number of timessomething happensUsed in many different ways to collect dataEach type serves a different function
Check SheetsHOW is a Check Sheet constructed ?The following s
And that is the concept of Continuous Improvement. No matter whether you invest in business management systems or services they can always be improved. There is a saying that may well be true in your own organisation – “unless you can measure something then you won’t realise an improvement” The Tools you will be exposed to in this presentation will provide you with an opportunity to .