Transcription
AutocallablesSource: SSPA Swiss Derivative Map, 2016
Global Market Share of 22%20132014201522%14%201220162017Source: www.StructuredRetailProducts.com
Annualised Returns* by Maturing Volume, All %5%5%0% 0%0%0%-2%2%-4%4%-6%*All performance figures in the presentation are calculated as sales-weighted annualised averages6%-8%8%-10% 10%Source: www.StructuredRetailProducts.com
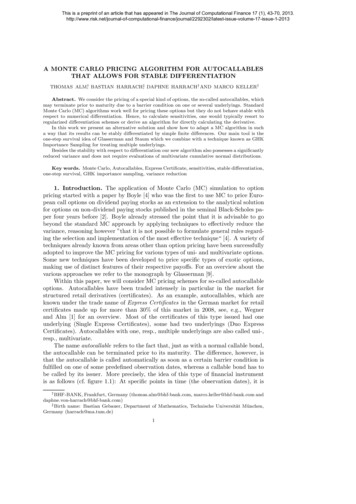
Half of Autocallables Mature on 1st ObservationMaturing Volume by KO Event, all Products1st47%2ndAverage Performance by KO Event, all Products10%8%5%7.35%7.94%6.65%7.17%6%3rd4%Later ter KOMaturity-2%-4%-2.25%Source: www.StructuredRetailProducts.com
Annualised Returns by Maturing Volume, Pre-2008 %5%6%3%0% 0%0%0%-2%2%-4%4%-6%6%-8%8%-10% 10%Source: www.StructuredRetailProducts.com
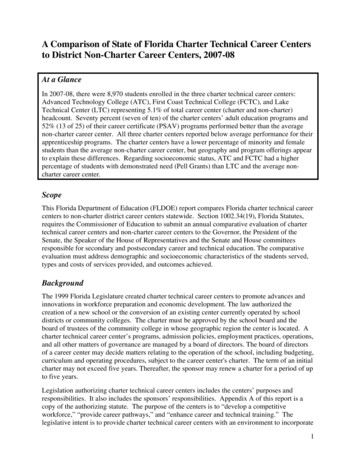
Most pre-2008 Autocallables lasted until MaturityMaturing Volume by KO Event, pre-GFC StrikesAverage Performance by KO Event, Pre-GFC 3%Later rdLater KO Maturity-3.73%Source: www.StructuredRetailProducts.com
Overview of the Global Market
Global Outstanding Volume – per Region in USDbn2,5002017 vs. 20162,0001,500 APAC 15%1,000 Americas 9%500 Europe rce: www.StructuredRetailProducts.com
Average Annualised Performance – Global 2017 vs. 201620%15%10%5%0% 0012Average Annualised Performance:20165.2%20175.8%3420165678910 102017Source: www.StructuredRetailProducts.com
Key Features - Americas
Annualised Performance by Matured Volume %17%16%Share of matured volume, %15%13%11%14%14%12%11% 12% 12%9%11%8%8%4%2% 0Average Annualised Performance byMatured 179-11 11-13 13-15 15Source: www.StructuredRetailProducts.com
Annualised Performance by Matured Volume % – Asset ClassShare of matured volume, %12%11%9%4%5%0%6%4% 5%2%7%8%5%2%0%0%1%0%0%0%-1%-2%-11%20162017Source: www.StructuredRetailProducts.com
Share of matured volume, %Annualised Performance by Matured Volume % – Payoff11%9%8%EnhancedTracker8%8%7% 6%5%5%2%9%8%2%1%Protected Capped Call Knock ource: www.StructuredRetailProducts.com
Share of matured volume, %Annualised Performance by Matured Volume % – Capital Protection10%7%4%6%6%5%5%4%2%Equal to 0%Between 0% and Between 90%90%and 100%20162017Equal to 100%3%Over 100%Source: www.StructuredRetailProducts.com
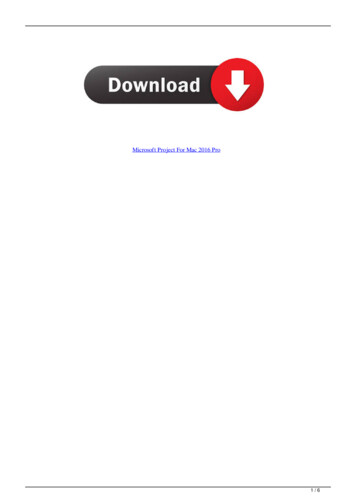
Growing and Shrinking Payoffs in North America 2017Capped Call, Enhanced TrackerUncapped CallCapped Call, Enhanced Tracker, PT***Digital, Knock OutEnhanced TrackerKnock Out, RC*DigitalEnhanced Tracker, PT***Knock Out, RC*, WoO**Callable, RC*, WoO**Capped Call-20% 0%20% 40% 60% 80% 100% 120% 140% 160% 180% Knock outs remain one of the main structures Capped Call Payoff on the rise*Reverse Convertible, **Worst of Option, ***Protected TrackerSource: www.StructuredRetailProducts.com
Growing and Shrinking Payoffs in Latin America 2017Knock Out, RCAccrual, RangeFloater, RangeKnock Out, RC,SnowballEnhanced Tracker (Capped)Digital, RangeUncapped CallDual Currency-600%-400%-200%0% Knock Out, RC has been replaced by Knock Out*Reverse Convertible, **Worst of OptionKnock Out, WoO0%25%50%75%100% RC with a Snowball featureSource: www.StructuredRetailProducts.com
Growing and Shrinking Underlyings in North America 2017JPMorgan Efficiente Plus DS 5 IndexEurostoxx 50, FTSE 100, S&P/ASX 200 Index, Swiss Eurostoxx 50, Russell 2000Share Basket (Unspecified)Russell 2000Russell 2000, S&P 500Eurostoxx 50, Russell 2000, S&P 500Eurostoxx 50S&P 500-100%0%100%200%300%400%500%600%700%Source: www.StructuredRetailProducts.com
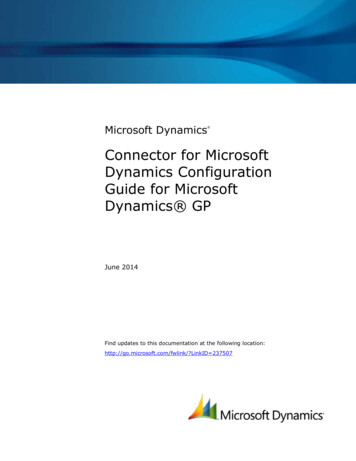
Growing and Shrinking Underlyings in Latin America 2017USD/MXNEurostoxx 50S&P 500TIIE (28 days)USD/BRL20%15%10%5%0%SPDR S&P 500 ETF TrustiShares Core S&P 500 ETFiShares MSCI Brazil CappedETFGrupo Mexico0%20% 40% 60% 80% 100%Source: www.StructuredRetailProducts.com
Market Trends Americas
Index Types as per Sales Volume100%Themantic IndicesCountry & Regional IndicesProprietary & Custom IndicesStrategy Indices2017 vs. 201680% Thematic Indices 28%60% Country & Regional Indices -45%40% Strategy Indices 123% Proprietary Indices 118%20%0%20132014201520162017Source: www.StructuredRetailProducts.com
Index Sectors as per Market Share in 20171%1%4%Country & Regional IndecesProprietary & Custom IndecesBanks (Equity - Financials)1%1%4% 99% of sales volume ofproducts linked to indices in2017 was invested into thesesectors10%Strategy IndicesOil & Gas (Equity - Oil & Gas)Utilities (Equity - Utilities)Gold (Commodity - Metals)Other commodities77%Source: www.StructuredRetailProducts.com
Most Popular Indices in 2017 – AmericasIndex SectorsIndex (total Sales Volume)% of Sales VolumeRegional IndexS&P 50036%Proprietary IndexJPMorgan Efficiente Plus DS 5 Index4%Thematic IndexS&P/TSX Composite Index Banks3%Strategy IndexS&P/TSX Composite Low Volatility Index3%Index SectorsBest Selling IndexSales Volume USDmRegional IndexS&P 500174Proprietary IndexBloomberg Commodity Index61Thematic IndexS&P GSCI Light Energy TR48Strategy IndexS&P/TSX Composite Low Volatility Index42Source: www.StructuredRetailProducts.com
Where next?
Main Implications: Products Innovation is focusing on underlyings: indices, funds, AMC Indices: quantitative & systematic strategies pushing smart beta andthematic indices Yield enhancement products and short term increased in popularity Increase of product transparency & harmonisation
Main Implications: Americas 2017 record year for the US market with sales of US 64bn The implementation of the [Department of Labor (DoL)] is impactingannuity market Single- /Multi-dealer platforms gain visibility: TPT, Halo, Simon, JPM SI360
Main Implications: forms
Thank you for your attentionTiago FernandesManaging DirectorDirect: 44 (0)20 7779 8228Mobile 44 (0)7971 464509Tiago@structuredretailproducts.comCopyright 2018 Structured Retail Products Limited. All Rights Reserved.Reproduction & distribution of this report in any form without prior written permission is strictly prohibited.The information contained herein has been obtained from sources believed to be reliable. SRP disclaims allwarranties as to the accuracy, completeness or adequacy of such information. Use of this report is at your solerisk & SRP accept no responsibility for any problems or incidents arising from its use.
JPMorgan Efficiente Plus DS 5 Index. Growing and Shrinking Underlyings in Latin America 2017 Source: www.StructuredRetailProducts.com 0% 20% 40% 60% 80% 100% Grupo Mexico iShares MSCI Brazil Capped ETF iShares Core S&P 500 ETF SPDR S&P 500 ETF Trust USD/BRL TIIE (28 days) S&P 500 Eurostoxx 50 USD/MXN