Transcription
FLUID-STRUCTURE INTERACTION AND TRANSIENT CAVITATIONTESTS IN A T-PIECE PIPEARRIS S TIJSSELINGALAN E VARDYDepartment of Mathematics and Computer ScienceCivil Engineering DivisionEindhoven University of TechnologyUniversity of DundeeP.O. Box 513, 5600 MB EindhovenDundee DD1 4HNThe NetherlandsUnited Kingdome-mail: a.s.tijsseling@tue.nle-mail: a.e.vardy@dundee.ac.ukAbstractA physical model featuring the combined phenomena of fluid-structure interaction (FSI) and vaporouscavitation is presented. The model is a closed, water-filled, T-shaped, laboratory pipe system, where the Tjunction and the three closed ends are potential locations for strong FSI coupling and/or column separation.The system is suspended horizontally on long steel wires and is excited through external impact. The impactforce and the static pressure of the liquid control the severity of the cavitation phenomenon.Keywords: Water hammer; Fluid-structure interaction (FSI); Vaporous cavitation; Column separation1
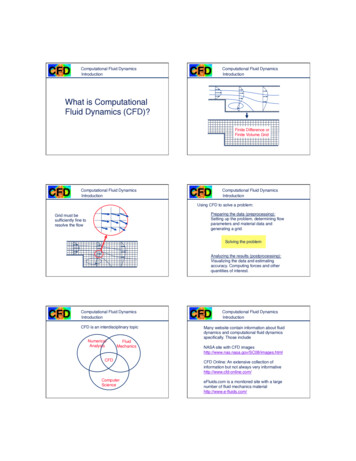
1.IntroductionPressure variations in a water-hammer incident can cause low absolute pressures that enable vaporousand/or gaseous cavities to form. Sometimes, at specific locations such as closed ends, tees, knees andhigh points, the cavity can occupy the entire pipe cross-section, thereby separating adjacent regions offully-liquid flow. The separated columns subsequently behave semi-independently and, in somecircumstances, can induce a rapid collapse of the void, resulting in a sudden, large pressure rise. Thesteepness of wave fronts travelling away from the point of collapse can make it likely that less-restrainedparts of the pipe system will move significantly as a result of unbalanced pressure forces. This paperreports an experimental study of these phenomena in a T-shaped pipe system.Reviews by Tijsseling (1996) and Wiggert and Tijsseling (2001) reveal that both FSI experiments inpipe systems with branches and FSI experiments with cavitation are rare. In that sense, the present studyis entirely new: it combines FSI and cavitation in a system with a branch. The study builds on previouswork. Vardy and Fan (1989) measured the transient vibration of a straight, liquid-filled pipe and theyanalysed FSI in the time domain. Zhang et al. (1999) considered the free vibration of the same pipe withmeasurement and analysis in the frequency domain. L-shaped and T-shaped systems have been thesubject of study in (Tijsseling et al., 1996: L-shaped system, transient vibration, time-domain analysis),(Vardy et al., 1996: T-shaped system, transient vibration, time-domain analysis) and (Tijsseling andVaugrante, 2001: L- and T-shaped systems, free vibration, frequency-domain analysis). Fan andTijsseling (1992) and Tijsseling et al. (1996) presented experimental results for FSI with cavitation instraight and L-shaped pipes, respectively. The present paper completes the series of FSI/cavitationexperiments with the T-shaped pipe.2.Laboratory apparatusThe T-piece pipe is shown in Fig. 1. It consists of a 4.51 m long pipe (pipe 1) connected through arigid T-junction to two 1.34 m short pipes (pipes 2 and 3). The pipes are made of stainless steel and have2
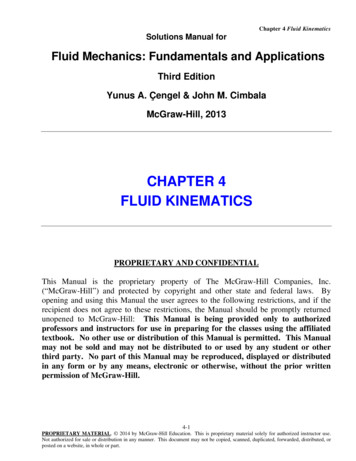
an inner diameter of 52 mm and a wall thickness of 3.945 mm. They are closed at their remote ends andfilled with pressurised ordinary tap water. The system is symmetrical and is suspended in a horizontalplane. It hangs on four long, thin, vertical, adjustable, steel wires, which allow horizontal vibrationwithout significant restraint. The system is excited by the external impact of a 5 m long solid steel rod,also hanging on wires. In the experiments reported herein, the rod hits the end plug axially, i.e. the centralaxes of the rod and the long pipe are in one line at the instant of impact. Table 1 gives the material andgeometrical properties of the system. Fig. 2 shows the impact end and Fig. 3 shows the T-junction.The T-piece pipe is instrumented with piezo-electric pressure transducers ("pt") at 8 locations andstrain gauges ("sg") at 6 locations, as indicated in Fig. 1. The pressure transducers are positioned alongthe bottoms of the pipes and at the centres of the end caps. Each transducer (Kistler 7031) records thetransient dynamic pressure and one transducer (Kistler 4073A100) also records the initial and final staticpressures. The strain gauges record the dynamic axial strains at the top, bottom and sides of the pipes.The sensed signals are amplified and fed into two data acquisition systems (with, in total, 22 channels) atsampling rates up to a maximum of 1 MHz per channel.An essential element of the experiment is the lining out of the system. This is done with an estimatedaccuracy of two tenths of a millimetre. A surveying level and staff are used to confirm the system’shorizontal alignment and a theodolite is used when bringing the impact rod and the long pipe into onevertical plane. The proper relative vertical elevation of the rod and pipe is checked with a dial gauge. Thesystem is held in its stationary position by remote-controlled magnets that have negligible influence onthe subsequent dynamic behaviour.A small valve in the end plug enables changing the static pressure in the system by means of a handpump. The static pressure controls the occurrence and severity of cavitation in the water.This physical experiment has the important advantages of (i) no unknown support conditions, (ii)clearly defined excitation, and (iii) no gaseous cavitation in the transient event. Gaseous cavitation is adiffusive process with an "incubation time" of several seconds (for water at room temperature) (Zielke etal., 1989), which is long compared to the time scale of the experiment (milliseconds). Furthermore, theinfluence of gas is much reduced by pressurising the water directly after filling. One minor disadvantagefor the cavitation experiments is the strong temperature-dependence of the static pressure. The watertemperature, which itself was not measured, could be deduced from the static pressure.3
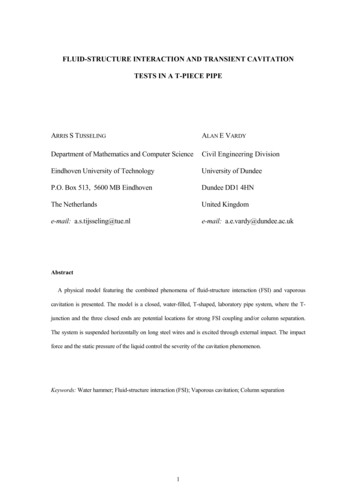
3.Experimental resultsIn theory, the T-shaped pipe and the excitation are symmetrical about the central axis of the long pipe.This means that the long pipe should vibrate in its axial direction only, i.e. in-plane and out-of-planeflexural vibration should not occur. The axial motion of the long pipe induces lateral motion of the shortpipes. The pressure variations in the liquid cause axial motion of the short pipes. Cavitation occurs whenthe pressure falls to vapour pressure, which is about 0.002 MPa for water at room temperature.Figs. 4 and 5 show absolute transient pressures measured close to the T-junction for different staticpressures. Fig. 4 shows pressures measured in two subsequent (typically five-minutes time gap)experimental runs under practically the same conditions. Fig. 5 shows pressures measured on both sidesof the T-junction.Figs 4(a) and 5(a) display experiments without cavitation. The initial (static) pressure P0 is 2 MPa,which is sufficiently high to prevent cavitation occurring at any location in the system. Fig. 4(a) showsthat the repeatability of the experiment is excellent and Fig. 5(a) confirms the symmetry of the system; inboth figures, two different lines are drawn, but these are not distinguishable at this plotting scale.The axial impact of the rod onto the closed end of the long pipe generates a pressure wave in the liquidand a longitudinal stress wave in the pipe wall. The front of the stress wave arrives at the T-junctionabout 1 ms after impact and it makes the T-junction move suddenly. This movement results in a pressuredrop according to the Joukowsky relation P ρc V, where the jumps in pressure ( P) and velocity( V) are proportional; the factor ρc is the product of the liquid’s mass density and its effective sonicspeed. The compressive pressure wave generated by the rod impact needs 3.4 ms to reach the T-junction.This sudden pressure rise makes the T-junction move. A detailed analysis and interpretation of themeasurements is practicable only with the aid of a dedicated computer code (Vardy et al., 1996).The Figs. 4(b) and 5(b) show measured pressures for a decreased initial (static) pressure P0 of 0.90MPa. The signals differ from those in the Figs. 4(a) and 5(a) because of cavitation in the liquid. At somepoint in the system (but not at "pt5" and "pt7", see below), the pressure has reached the vapour pressure.The signals indicate that cavitation has not occurred near the T-junction itself: the pressure histories are4
well above the zero line.The Figs. 4(c,d) and 5(c,d) show measured pressures for further decreased initial pressures P0 of 0.70MPa and 0.50 MPa, respectively. The pressure signals touch the zero line, so some cavitation might haveoccurred at the T-junction.The Figs. 4(e,f) and 5(e,f) show measured pressures for low initial pressures P0 of 0.30 MPa and 0.10MPa, respectively. The liquid cannot sustain the first potential pressure drop of 0.5 MPa and a void willdevelop at the T-junction. The pressure remains at the vapour pressure of 0.002 MPa until the voidcollapses. In this instance, the void-collapse, like the rod-impact, gives a steep rise in pressure.It is evident that the occurrence of cavitation has a negative effect on the repeatability and symmetry ofthe experiment. This is due to the random nature of cavitation and its dependence on the system’s staticpressure, which itself is highly sensitive to the temperature.Fig. 6 shows the pressures at the remote ends of pipes 2 and 3. The lateral motion of these short pipeshas no direct effect on the mean pressure, so the first pressure drop is due to the low-pressure waveoriginating at the T-junction and arriving at the far ends about 1.3 ms after impact. Because the ends areclosed, the pressure reduction becomes twice as large upon reflection, namely about 1 MPa. Fig. 6(b)shows that an initial pressure P0 of 0.90 MPa is not sufficient to sustain this pressure drop, and so it islikely that the closed ends of the short pipes are the locations where cavitation occurs first (for P0 largerthan 0.50 MPa, otherwise cavitation starts elsewhere). As already observed in previous experiments,short-duration tensile stresses (P 0) precede the first occurrence of cavitation.Fig. 7 shows the bending strains in the short pipes. These are defined as the differences (ε1 ε 3 ) / 2 inaxial strain measured at opposite sides of the pipe circumference and they are directly related to thebending moments via M (ε1 ε 3 ) E I / [ 2 ( R e) ] , with EI the flexural stiffness and R e the outerradius of the pipe. The flexural vibration of the short pipes is not much influenced by the containedliquid. The effect of the liquid is indirect through the changed axial vibration of the long pipe, this beingthe driver of flexure of the short pipes.Fig. 8 shows the corresponding axial strains (ε1 ε 3 ) / 2 in the short pipes. Axial vibration of the shortpipes is caused by pressure variations in the water.5
Fig. 9 shows pressures near the impact plug measured in two subsequent runs. The rod impactgenerates a pressure rise of 0.77 MPa magnitude. Cavitation is observed in all five figures (b)-(f). It isnoted that the pressure transducer ("pt1" in Fig. 1) is 20 mm away from the closed end and may be closeto the edge of the column separations occurring there. All signals measured at this location, also withdifferent transducers and different types of mounting, showed spurious oscillations and unrealistic spikes.In fact, several transducers were damaged, some with a hole in the diaphragm. Apparently, the local,nearby explosion and implosion of small cavitation bubbles is a too severe load for them.Most interesting is Fig. 9(f) from which it is clearly seen that cavitation starts almost immediately afterimpact. The initial static pressure is so low here that the radial expansion of the pipe wall (accompanyingthe compressive axial stress wave) induces a pressure drop sufficiently high to cause cavitation.4.Conclusions1.Detailed measurements of FSI and vaporous cavitation have been presented for a laboratoryapparatus including three pipes in an horizontal plane. All three pipes share a common junction (a Tpiece) and their remote ends are closed.2.The apparatus is nominally symmetrical and so is the excitation, namely a controlled, axialimpact at the remote end of the longest pipe. In theory, identical results should be obtained in pipes 2 and3, and on opposite faces of pipe 1. In practice, minor differences are observed, but a high degree ofsymmetry is exhibited even in cases involving significant degrees of cavitation.3.The measurements have been shown to be highly reproducible. This is a necessary requirementof any measurements designed expressly for software validation purposes. It is especially noteworthy inthe case of successive tests involving vaporous cavitation of ordinary tap water.4.The data are believed to be sufficiently accurate, sufficiently detailed and sufficiently completeto justify their widespread use for the assessment of theoretical models of FSI and cavitation.Accordingly, the data will be made freely available to the international community through a website atEindhoven University of Technology with financial support from the Surge-Net project: www.win.tue.nl/fsi.6
AcknowledgementsThe Surge-Net project (www.surge-net.info) is supported by funding under the European Commission’sFifth Framework ‘Growth’ Programme via Thematic Network “Surge-Net” contract reference: G1RTCT-2002-05069. The authors of this paper are solely responsible for its content, which might not reflectthe opinion of the Commission. The Commission is not responsible for any use that might be made ofdata herein.Colin Stark, Della Leslie and Ernie Kuperus are thanked for their skills and technical assistance inrunning the experiments.ReferencesFan, D., Tijsseling, A., 1992. Fluid-structure interaction with cavitation in transient pipe flows. ASMEJournal of Fluids Engineering 114, 268-274.Tijsseling, A.S., 1996. Fluid-structure interaction in liquid-filled pipe systems: a review. Journal of Fluidsand Structures 10, 109-146.Tijsseling, A.S., Vardy, A.E., Fan, D., 1996. Fluid-structure interaction and cavitation in a single-elbow pipesystem. Journal of Fluids and Structures 10, 395-420.Tijsseling, A.S., Vaugrante, P., 2001. FSI in L-shaped and T-shaped pipe systems. In: Brekke, H., Kjeldsen,M. (Eds.), Proceedings of the 10th International Meeting of the IAHR Work Group on the Behaviour ofHydraulic Machinery under Steady Oscillatory Conditions, Trondheim, Norway, Paper C3.Vardy, A.E., Fan, D., 1989. Flexural waves in a closed tube. In: Thorley, A.R.D. (Ed.), Proceedings of the 6thInternational Conference on Pressure Surges, BHRA, Cambridge, UK, 43-57.Vardy, A.E., Fan, D., Tijsseling, A.S., 1996. Fluid/structure interaction in a T-piece pipe. Journal of Fluidsand Structures 10, 763-786.7
Wiggert, D.C., Tijsseling, A.S., 2001. Fluid transients and fluid-structure interaction in flexible liquid-filledpiping. ASME Applied Mechanics Reviews 54, 455-481.Zhang, L., Tijsseling, A.S., Vardy, A.E., 1999. FSI analysis of liquid-filled pipes. Journal of Sound andVibration 224(1), 69-99.Zielke, W., Perko, H.-D., Keller, A., 1989. Gas release in transient pipe flow. In: Thorley, A.R.D. (Ed.),Proceedings of the 6th International Conference on Pressure Surges, BHRA, Cambridge, UK, 3-13.8
Fig. 1. Top view of the symmetric T-piece apparatus with lengths in mm (not to scale).Table 1Material and geometrical properties of the T-piece apparatus.Length(s)RadiusSteel pipesImpact rod4.51 m, 1.34 m, 1.34 m5.006 m26.01 mm (inner)25.37 mm29.96 mm (outer)Young modulus168 GPa200 GPaMass density7985 kg/m37848 kg/m3Bulk modulusPoisson ratio999 kg/m32.14 GPa0.29Impact velocityMassWater0.809 m/sImpact plugT-junctionEnd cap1.30 kg1.06 kg0.32 kg9
Fig. 2. Impact rod (A), long pipe (B) and pressure transducer "pt1" (C).Fig. 3. T-junction connecting the pipes 1, 2 and 3.10
3.5220.750.5P0 2.00 MPa00.01500.50.03(a)0.0150.03P0 0.50 MPa(d)2.5210.750.500.01500.030.5P0 0.90 MPa(b)0.0150.03P0 0.30 MPa(e)2.5210.750.500.015P0 0.70 MPa00.030.5(c)0.0150.03P0 0.10 MPa(f)Fig. 4. Repeatability of the experiment for six different static pressures. In each figure, two lines are drawn,corresponding to two different tests under practically the same conditions. Transient pressures measured close to the Tjunction at location "pt7" (in Fig. 1) are shown. The initial static pressure P0 ranges from 2 MPa (and no cavitation) infigure (a) to 0.1 MPa (and much cavitation) in figure (f). Horizontal axis: time (s). Vertical axis: absolute pressure(MPa).11
3.5220.750.5P0 2.00 MPa00.01500.50.03(a)0.0150.03P0 0.50 MPa(d)2.5210.750.500.01500.030.5P0 0.90 MPa(b)0.0150.03P0 0.30 MPa(e)2.5210.750.500.015P0 0.70 MPa00.030.5(c)0.0150.03P0 0.10 MPa(f)Fig. 5. Symmetry of the experiment for six different static pressures. In each figure, two lines are drawn, correspondingto transient pressures measured close to the T-junction at the opposite locations "pt5" and "pt7" (in Fig. 1). The initialstatic pressure P0 ranges from 2 MPa (and no cavitation) in figure (a) to 0.1 MPa (and much cavitation) in figure (f).Horizontal axis: time (s). Vertical axis: absolute pressure (MPa).12
3.5220.750.5P0 2.00 MPa00.01500.50.03(a)0.0150.03P0 0.50 MPa(d)2.5210.750.500.01500.030.5P0 0.90 MPa(b)0.0150.03P0 0.30 MPa(e)2.5210.750.500.015P0 0.70 MPa00.030.5(c)0.0150.03P0 0.10 MPa(f)Fig. 6. Symmetry of the experiment for six different static pressures. In each figure, two lines are drawn, correspondingto transient pressures measured close to the remote ends at the opposite locations "pt6" and "pt8" (in Fig. 1). The initialstatic pressure P0 ranges from 2 MPa (and no cavitation) in figure (a) to 0.1 MPa (and much cavitation) in figure (f).Horizontal axis: time (s). Vertical axis: absolute pressure (MPa).13
50050005000.0150.030500P0 2.00 MPa(a)0.0150.03P0 0.50 MPa(d)50050005000.0150.030500P0 0.90 MPa(b)0.0150.03P0 0.30 MPa(e)50050005000.0150.030500P0 0.70 MPa(c)0.0150.03P0 0.10 MPa(f)Fig. 7. Symmetry of the experiment for six different static pressures. In each figure, two lines are drawn, correspondingto bending strains measured in the short pipes at the opposite locations "sgE" and "sgF" (in Fig. 1). The initial staticpressure P0 ranges from 2 MPa (and no cavitation) in figure (a) to 0.1 MPa (and much cavitation) in figure (f).Horizontal axis: time (s). Vertical axis: bending strain (micro-strain).14
60600600.0150.03060P0 2.00 MPa(a)0.0150.03P0 0.50 MPa(d)60600600.0150.030(b)0.03P0 0.30 MPa60P0 0.90 MPa0.015(e)60600600.0150.03060P0 0.70 MPa(c)0.0150.03P0 0.10 MPa(f)Fig. 8. Symmetry of the experiment for six different static pressures. In each figure, two lines are drawn, correspondingto axial strains measured in the short pipes at the opposite locations "sgE" and "sgF" (in Fig. 1). The initial staticpressure P0 ranges from 2 MPa (and no cavitation) in figure (a) to 0.1 MPa (and much cavitation) in figure (f).Horizontal axis: time (s). Vertical axis: axial strain (micro-strain).15
3.5321.250.500.0150.030.5P0 2.00 MPa(a)00.015P0 0.50 MPa0.0300.015P0 0.30 MPa0.0300.015P0 0.10 MPa0.03(d)331.251.250.500.0150.030.5P0 0.90 MPa(b)(e)331.251.250.500.015P0 0.70 MPa0.030.5(c)(f)Fig. 9. Repeatability of the experiment for six different static pressures. In each figure, two lines are drawn,corresponding to two different tests under practically the same conditions. Transient pressures measured close to theimpact end at location "pt1" (in Fig. 1) are shown. The initial static pressure P0 ranges from 2 MPa (and no cavitation)in figure (a) to 0.1 MPa (and much cavitation) in figure (f). Horizontal axis: time (s). Vertical axis: absolute pressure(MPa).16
The T-piece pipe is instrumented with piezo-electric pressure transducers ("pt") at 8 locations and strain gauges ("sg") at 6 locations, as indicated in Fig. 1. The pressure transducers are positioned along the bottoms of the pipes and at the centres of the end caps. Each transducer (Kistler 7031) records the