Transcription
WINTER 2018SALARY SURVEYSTARTING SALARY PROJECTIONS FOR CLASS OF 2018 NEW COLLEGE GRADUATESDATA REPORTED BY EMPLOYERSSALARIES BY MAJORp. 7SALARIES BY INDUSTRYp. 16SALARIES BY REGIONp. 36FEATURINGStarting SalaryProjections forDegree LevelsBACHELOR’SMASTER’SDOCTORALNATIONAL ASSOCIATION OF COLLEGES AND EMPLOYERSwww.naceweb.org
TABLE OF CONTENTSABOUT THE SURVEY . 2HOW TO READ SALARY SURVEY . 3EXECUTIVE SUMMARY . 4STARTING SALARIES BY MAJOR . 7Bachelor’s Degrees . 8Master’s Degrees . 12Doctoral Degrees . 15STARTING SALARIES BY MAJOR AND INDUSTRY .16Bachelor’s Degrees . 17Master’s Degrees . 24Doctoral Degrees . 25STARTING SALARIES BY INDUSRTY AND MAJOR .26Bachelor’s Degrees . 27Master’s Degrees . 34SALARY BY REGION AND MAJOR .36Bachelor’s Degrees . 37Master’s Degrees . 44Doctoral Degrees . 47APPENDIX .48 Copyright 2018 National Association of Colleges and Employers. All rights reserved.NATIONAL ASSOCIATION OF COLLEGES AND EMPLOYERS 2018 WINTER SALARY SURVEY 1
ABOUT THIS SURVEYABOUT THIS SURVEYThe Winter 2018 Salary Survey contains annual salary projections for Class of 2018 college graduates. Thefigures reported are for base salaries only and do not include bonuses, commissions, fringe benefits, or overtimerates. The report provides the detailed salary projections by academic major and degree level, along withbreakouts by both industry and geographic region.Data contained in the report were obtained by surveying NACE employer members from August 9, 2017,through December 4, 2017. A total of 196 surveys were returned—a 23.9 percent response rate. Of thoseresponding, 14.8 percent of respondents were from the West, 25.5 percent were from the Northeast, 25 percentwere from the Southeast, and 34.7 percent were from the Midwest. A list of respondents by industry and size,and a partial list of organizations that supplied data for this report can be found in the Appendix.Salary Survey (ISSN 1520-8648) is available to individuals holding membership in the National Association ofColleges and Employers; it is also available on a subscription basis. The Salary Survey report is published threetimes a year—January, April, and September—by the National Association of Colleges and Employers,62 Highland Ave., Bethlehem, PA 18017-9085. For more information, see www.naceweb.org/store/subscription/salary-survey/ or contact NACE at 610.868.1421.NACE RESEARCH STAFFEdwin W. Koc, Director of Research, Public Policy, and Legislative AffairsAndrea J. Koncz, Research ManagerLouisa Eismann, Research AssociateAnna Longenberger, Research AssistantSALARY SURVEY ISSUES FOR THE CLASS OF 2018The Winter issue features starting salary projections by major from employer-provided data. The Winter 2018 reportis the first report for the Class of 2018. Data are available by major, industry, and region. There are also data foradvanced-degree candidates—the report includes data for 33 master’s and 10 doctoral degree disciplines.The Fall issue reports data from participating institutions; the data are provided to the schools by their graduates.In this sense, the data are “early” returns of the First-Destination Survey salary data. The report includes data bymajor and region. The Fall 2018 issue will provide actual starting salary data for the Class of 2018.The Spring issue serves as the final report for the previous year’s graduating class; its data are provided throughthe national First-Destination Survey initiative and represent actual, starting salaries (not projections) reported bygraduates to their institutions. Data are by major and region. The Spring 2018 report will serve as the final reporton starting salaries for the Class of 2017. The Spring 2019 Salary Survey will serve as the final report for theClass of 2018.SALARY DATA FOR THE CLASS OF 2018REPORTWHATDATA SOURCEFirst Report – Winter 2018Pre-graduation projected startingsalariesEmployersSecond Report – Fall 2018Early results, post-graduation actualstarting salariesFirst-Destination Survey – Early Results(Students/Schools)Final Report – Spring 2019Final results, post-graduation actualstarting salariesFirst-Destination Survey(Students/Schools)2 2018 WINTER SALARY SURVEY NATIONAL ASSOCIATION OF COLLEGES AND EMPLOYERS
HOW TO READ SALARY SURVEYHOW TO READ SALARY SURVEYBACHELORS / MASTER’S / DOCTORALPAGE 7STARTING SALARIES BY ACADEMIC MAJORIn this section, you will find the average starting salary according to the major field of study, with noregard to the type of employer reporting the salary. Refer to this section when you want to know thestarting salary for a graduate holding a degree in a specific discipline, such as accounting or computerscience.PAGE 16STARTING SALARIES BY MAJOR AND INDUSTRYThis section shows data first by the major field of study, then by the type of employer (industry) reportingthe salaries. Employer types are listed in alphabetical order under each major. See this section when youwant the average starting salary reported by a specific type of employer to a graduate earning a degreein a specific major. (Example: Average salary that chemical manufacturing firms are reporting for electricalengineering graduates.)PAGE 26STARTING SALARIES BY INDUSTRY AND MAJORThis section contains the same basic information as “Starting Salaries by Major and Industry,” but in adifferent order. You will see data by a specific type of employer (industry), then according to the averagesalary by major field of study. Industries are arranged in alphabetical order. Majors are listed under eachindustry in the typical report order by broad category, then alphabetical within the category. Use this sectionto find the average starting salary reported by a specific type of employer to a graduate in a specific major.(Example: Majors hired by construction firms, and their corresponding average starting salaries.)PAGE 36STARTING SALARIES BY REGION AND MAJORIn this section, you will find the average starting salary according to the major field of study, within thefour geographic regions (Northeast, Southeast, Midwest, and West.) The regional data are based uponthe locations of the participating organizations that supplied information for the majors within each region.The majors are reported in typical report order by broad category, then alphabetical within the category.Averages are provided strictly by major field of study with no regard to the type of employer reporting thesalary. Refer to this section when you want to know the starting salary for a graduate holding a degree in aspecific discipline in a regional location, such as mechanical engineering majors hired by participants in theWest.NATIONAL ASSOCIATION OF COLLEGES AND EMPLOYERS 2018 WINTER SALARY SURVEY 3
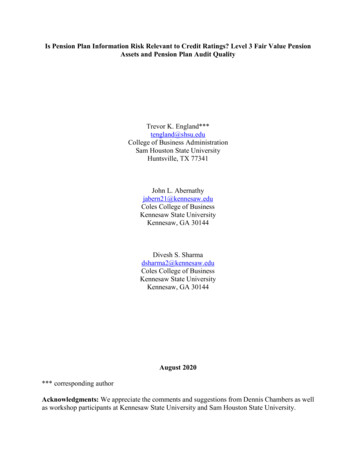
EXECUTIVE SUMMARYEXECUTIVE SUMMARYStarting Salary Projections for the Class of 2018BACHELOR’S DEGREE GRADUATESIn this first look at starting salary projections for the Classof 2018, employers responding for NACE’s Winter2018 Salary Survey report expect to make studentsearning engineering, computer science, and mathand sciences degrees the top-paid graduates at thebachelor’s-degree level. (See Figure 1.) These fields werealso in high demand among employers responding to theassociation’s Job Outlook 2018 survey.The salary and increase projections for the two highestpaid majors—engineering and computer science—are nearly identical. With an overall average salaryprojection of 66,521, engineering graduates are onceagain expected to be the highest paid. However, witha gain of less than 1 percent over last year’s averageprojection of 66,097 for Class of 2017 graduates,their average remains essentially flat.Similarly, the average salary for Class of 2018computer science graduates is expected to be 66,005, which also is an increase of less than 1percent over last year’s average salary projection of 65,540.Meanwhile, math and sciences graduates are expectedto see a more significant increase. These graduates areprojected to earn salaries that average 61,867, whichis up 4.2 percent over last year’s average of 59,368.Although data are extremely limited, the increase formath and sciences graduates overall is driven by theaverage salary projection of 69,900 for studentsspecifically earning physics degrees. Last year, theseparticular graduates had an average salary projectionof 64,438.Although business majors were tops in terms of demandin the Job Outlook 2018 survey, their overall averagesalary projection of 56,720 falls fourth among thetop-paid degrees in this report. The current averagesalary projection for business majors is 3.5 percenthigher than last year’s projection of 54,803 for Classof 2017 business majors. Among the reported businessdisciplines, marketing is the highest paid this year, withan average salary projection of 62,634—significantlyhigher than last year’s projection of 52,988.The average offer for Class of 2018 social sciencesgraduates is expected to rise 6 percent to 56,689,continuing the upward trend seen for thesegraduates. Last year, their average projected salaryrose 15 percent. Although data for Class of 2018 socialsciences graduates is limited, all five of the reporteddisciplines in the social sciences—economics, politicalscience, psychology, sociology, and social work—areexpected to receive higher average starting salaries, withincreases ranging from almost 2 percent for economicsmajors to nearly 14 percent for social work majors.The graduates who are expected to see the largestgain in starting salary are those earning degrees in thehumanities. The average salary projection for graduatesin the humanities this year ( 56,688) is up 16.3 percentfrom last year’s average ( 48,733). The catalyst for thisFIGURE 1 AVERAGE SALARIES BY DISCIPLINE / BACHELOR’S DEGREESBROAD CATEGORY2018AVERAGESALARYEngineering 66,521418Computer Science 66,005173Math & Sciences 61,86762Business 56,720595Social Sciences 56,68963Humanities 56,68834Agriculture & Natural Resources 53,56531Communications 51,448624 2018 WINTER SALARY SURVEY NATIONAL ASSOCIATION OF COLLEGES AND EMPLOYERSRESPONSES
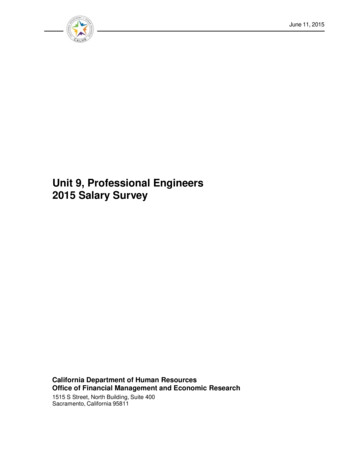
EXECUTIVE SUMMARYlarge increase is the fact that all reported disciplinesshow average salary projections that exceed 55,000.By comparison, the projected average salaries forhumanities degrees in last year’s Winter 2017 SalarySurvey report ranged between 46,000 and 51,000.On the other side, Class of 2018 communicationsgraduates are the only group at the bachelor’sdegree level who are projected to earn a loweraverage starting salary than did their Class of 2017counterparts. However, the decrease is minimal. Theiroverall average starting salary projection of 51,448is down less than 1 percent over last year’s projectionof 51,925. In examining the individual majors in thisgroup, the average salary projection for advertisingmajors is 1.6 percent lower than last year, causing theslight drop for the group.MASTER’S DEGREE GRADUATESAt the master’s-degree level, math and sciencesgraduates top the list of highest-paid majors for theClass of 2018. (See Figure 2.) Their overall averagesalary projection stands at 76,745, which is 9.5percent higher than last year’s salary projection forthis group.Engineering graduates earning master’s degrees areprojected to earn an average salary of 75,481; thatrepresents a less than 1 percent increase over lastyear’s average of 75,053. However, eight of the11 individual reported majors have average salaryprojections that exceed the overall projection forthe group and range from 75,543 for mechanicalengineering majors to 81,156 for industrial/manufacturing engineering majors.FIGURE 2 AVERAGE SALARIES BY DISCIPLINE / MASTER’S DEGREESBROAD CATEGORY2018AVERAGESALARYMath & Sciences 76,74521Engineering 75,481128Computer Science 75,10371Social Sciences 73,70911Business 69,756183RESPONSESNATIONAL ASSOCIATION OF COLLEGES AND EMPLOYERS 2018 WINTER SALARY SURVEY 5
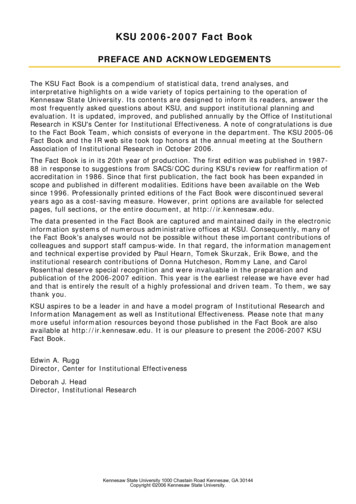
EXECUTIVE SUMMARYFIGURE 3 AVERAGE SALARIES BY DISCIPLINE / DOCTORAL DEGREESBROAD CATEGORY2018AVERAGESALARYMath & Sciences 99,2147Engineering 90,92919Computer Science 86,57013Last year, Class of 2017 computer science graduatestopped the list of highest-paid majors at the master’sdegree level with an average projected salary of 81,039. This year, their projected average salary isdown 7.3 percent to 75,103; the current projection ismore in line with where average salaries for this grouphave been in the past. (Last year’s average projectionwas more than 12 percent higher than the prior year’sprojection.) In addition, this year’s three individualcomputer science disciplines show more moderate salaryprojections, falling in the 72,000 to 77,000 range,while last year’s were in a significantly higher range of 79,000 and 82,000.With their overall average salary projection rising 20percent, master’s graduates earning social sciencedegrees are among the highest paid from the Class of2018. Their average projected salary has jumped to 73,709 from last year’s average of 61,333. Whiledata here are extremely limited and should be usedwith caution, large increases to the average projectedsalary for economics majors (from 63,778 last year to 76,175 this year) and political science majors (from 54,000 to 67,133) are clearly driving the overallincrease.The average salary projection for Class of 2018master’s degree business graduates is down 5.8 percentto 69,756. Driving that reduction is the fact that 10 ofthe 11 reported business disciplines are experiencingdecreases; these range from a 1.5 percent decrease foractuarial science majors to a drop of 16.2 percent forinternational business majors. Sales majors are the onlymaster’s degree business major showing an increase;their projected average salary is up 13.3 percent from 66,000 last year to 74,750 this year.The average starting salary projection for an M.B.A.graduate is 78,332. That represents a 4.1 percentdrop in the average offer for M.B.A.s and means theyare ceding ground gained last year when their averageprojected offer rose 5.2 percent.RESPONSESDOCTORAL DEGREE GRADUATESRespondents to the Job Outlook 2018 surveyreported that just 1.7 percent of their new hires willhold doctoral degrees. With such limited data toreport, average salary projections for the Class of2018 are shown in just three categories of majors.(See Figure 3.)As was the case at the master’s-degree level, mathand sciences top the list in terms of highest-paidmajors at the doctoral degree level. At 99,214, theoverall average salary projection for these graduatesis quite a bit higher this year—up 14.4 percentover last year’s average of 86,713. The individualsalary projection for physics majors ( 114,667)is driving this increase; an average projection forphysics majors was not provided last year.The average salary projection for engineeringgraduates earning doctoral degrees currently standsat 90,929, which is down 5.2 percent over lastyear’s average of 95,973. Four of the five reportedengineering disciplines top 90,000 in terms oftheir average salary projections, with just materialsengineering/science having a slightly lower salaryprojection of 85,165. Last year, all reportedengineering disciplines for the Class of 2017 toppedthe 90,000 mark.Computer science graduates at this degree level areshowing greatly reduced average salary projections;their overall average projection has dropped morethan 21 percent, from 110,841 last year to just 86,570 this year. The average salary projectionsby individual major tell the story, with drops forcomputer science (from 110,850 to 94,877),information sciences (from 110,000 to 76,046),and software applications ( 110,000 to 77,713)majors. Again, however, the data are extremelylimited and highly dependent upon the respondentsto the survey, so any trend analysis among this groupis not possible.6 2018 WINTER SALARY SURVEY NATIONAL ASSOCIATION OF COLLEGES AND EMPLOYERS
STARTING SALARY BY ACADEMIC MAJORSTARTING SALARYBY ACADEMIC MAJORNATIONAL ASSOCIATION OF COLLEGES AND EMPLOYERS 2018 WINTER SALARY SURVEY 7
STARTING SALARY BY ACADEMIC MAJORBACHELOR’S DEGREESBACHELOR’S DEGREES / SALARY RANGES BY BROAD CATEGORY 80,000 71,786 70,000 66,124 60,000 50,000 58,290 55,245 49,677 60,202 60,339 69,588 66,495 69,615 64,059 62,695 63,667 55,088 56,065 55,588 56,514 50,806 51,311 50,241 50,397 47,903 40,000AGRICULTURE & BUSINESS COMMUNICATIONS COMPUTERNATURAL S 60,919 53,903MATH &SCIENCESBACHELOR’S DEGREE SALARIES BY MAJORACADEMIC ESAGRICULTURE AND NATURAL RESOURCES MAJORSAgricultural Business/Management 56,175 52,800 56,000 62,00012Conservation/Natural Resources Management 49,867 40,000 54,600 55,0003Animal Science 51,150 47,300 54,800 55,0004Food Science 53,075 51,000 54,800 56,5008BUSINESS MAJORS / SALARY RANGES 70,000 60,000 50,000 67,500 59,000 60,000 55,000 54,080 50,000 50,000 62,000 56,000 53,000 60,500 61,000 60,000 55,620 55,000 52,500 55,000 52,250 57,000 57,000 53,000 53,000 48,000 48,500 ANCELOGISTICS/ MANAGEMENT/SUPPLY CHAIN INFORMATIONSYSTEMS8 2018 WINTER SALARY SURVEY NATIONAL ASSOCIATION OF COLLEGES AND EMPLOYERSMARKETINGSALES
STARTING SALARY BY ACADEMIC MAJORBACHELOR’S DEGREE SALARIES BY MAJOR25THPERCENTILEMEDIAN75THPERCENTILE 51,900 47,300 54,800 56,5004Accounting 55,264 50,000 55,000 59,00082Actuarial Science 59,400 52,000 60,000 65,00019Business Administration/Management 54,660 50,000 54,080 60,00072Economics 58,103 53,000 56,000 62,00047Finance 56,809 52,250 55,620 60,50080Hospitality Management 53,880 50,000 53,560 60,0007Human Resources 52,322 47,500 51,338 57,50048International Business 56,073 50,000 56,500 60,00022Logistics/Supply Chain 56,823 52,500 55,000 61,00055Management Information Systems 60,583 55,000 60,000 67,50058Marketing 62,634 48,000 53,000 57,00059Sales 52,612 48,500 53,000 57,00046Advertising 51,150 47,000 51,500 57,00010Communications 51,340 48,000 51,000 55,00029Journalism 53,722 50,000 55,000 57,0009Public Relations 50,421 47,000 49,450 57,00014Computer Science 67,605 60,840 67,500 73,00075Information Sciences & Systems 64,638 59,500 64,750 70,00056Software Applications 64,971 60,000 65,500 72,00042 70,000 69,100 70,000 70,000ACADEMIC MAJORMEANPlant ScienceRESPONSESBUSINESS MAJORSCOMMUNICATIONS MAJORSCOMPUTER SCIENCES MAJORSENGINEERING MAJORS / SALARY RANGES 80,000 71,500 70,000 67,500 68,250 65,000 65,000 66,560 6 ,000 62,000 60,000 59,549 67,500 64,000 66,000 70,000 70,000 70,000 67,500 6 ,000 63,000 61,000 59,000 ANICALSOFTWARESYSTEMSNATIONAL ASSOCIATION OF COLLEGES AND EMPLOYERS 2018 WINTER SALARY SURVEY 9
STARTING SALARY BY ACADEMIC MAJORBACHELOR’S DEGREE SALARIES BY MAJORACADEMIC ESENGINEERING MAJORSAerospace/Aeronautical Engineering 63,237 59,549 65,000 67,50012Biomedical Engineering 65,550 63,000 67,250 70,00010Chemical Engineering 68,764 65,000 68,250 71,50038Civil Engineering 63,071 59,000 62,000 66,56027Computer Engineering 69,510 65,000 69,100 70,00043Electrical Engineering 67,358 64,000 67,500 70,00062Engineering Technology 61,617 59,000 61,250 67,50018Environmental Engineering 64,548 59,500 65,000 70,50020Industrial/Manufacturing Engineering 65,104 62,000 65,000 68,00042Materials Engineering/Science 64,945 61,000 66,000 71,00023Mechanical Engineering 66,659 63,000 66,000 70,00065Nuclear Engineering 63,550 65,000 65,500 68,3006Software Engineering 70,073 65,000 70,000 70,00030Systems Engineering 66,623 61,000 67,500 70,00022 55,200 46,000 55,000 64,5005Area & Gender Studies 59,000 55,000 57,000 65,0003English Language & Literature 55,075 49,300 54,000 61,0008Foreign Language & Literature 59,000 55,000 57,000 65,0003History 55,371 47,000 55,000 65,0007Liberal Arts/General Studies 57,160 50,000 56,000 65,00010Philosophy 57,867 51,600 57,000 65,0003 57,794 51,600 58,000 65,00031HEALTHCARE MAJORSHealthcare AdministrationHUMANITIES MAJORSSOCIAL SCIENCES MAJORSEconomicsHUMANITIES MAJORS / SALARY RANGES 70,000 60,000 40,000 65,000 57,000 55,000 55,000 65,000 65,000 56,000 57,000 61,000 54,000 50,000 65,000 50,000 49,300ENGLISH 51,600 47,000FOREIGNLANGUAGESHISTORYLIBERAL ARTS/GENERAL STUDIES10 2018 WINTER SALARY SURVEY NATIONAL ASSOCIATION OF COLLEGES AND EMPLOYERSPHILOSOPHY
STARTING SALARY BY ACADEMIC MAJORBACHELOR’S DEGREE SALARIES BY MAJORACADEMIC ESPolitical Science/International Relations 57,055 47,000 57,000 65,00011Psychology 54,733 51,600 55,000 61,0009Sociology 55,075 50,000 53,300 61,0008Social Work 54,750 48,500 53,500 61,0004Mathematics/Statistics 61,016 53,000 61,000 70,00030Biology/Biological Sciences 64,250 61,000 63,500 67,5004Chemistry 63,818 59,000 62,000 70,00011Environmental Science 57,500 48,000 57,500 65,0006Geology/Geological Sciences 53,000 46,500 51,000 59,5004Physics 69,900 55,000 66,000 78,3007MATHEMATICS AND SCIENCES MAJORSSOCIAL SCIENCES MAJORS / SALARY RANGES 70,000 65,000 60,000 50,000 58,000 65,000 57,000 51,600 61,000 61,000 61,000 55,000 51,600 53,300 53,500 47,000 40,000ECONOMICSPOLITICAL SCIENCEPSYCHOLOGY 50,000SOCIOLOGY 48,500SOCIAL WORKMATH & SCIENCES MAJORS / SALARY RANGES 80,000 70,000 60,000 78,300 70,000 61,000 67,500 63,500 61,000 70,000 65,000 62,000 59,000 57,500 53,000 50,000 40,000 66,000 55,000 SCIENCEPHYSICSNATIONAL ASSOCIATION OF COLLEGES AND EMPLOYERS 2018 WINTER SALARY SURVEY 11
STARTING SALARY BY ACADEMIC MAJORMASTER’S DEGREESMASTER’S DEGREES / SALARY RANGES BY BROAD CATEGORY 100,000 93,636 80,460 80,000 81,181 73,451 71,000 65,848 60,000BUSINESS 74,922 73,429 68,926 66,095 64,473 61,000 56,246 40,000 66,803 83,381 80,439 56,600 ALSCIENCESMATH &SCIENCESMASTER’S DEGREE SALARIES BY MAJORACADEMIC ESAGRICULTURE AND NATURAL RESOURCES MAJORSAgricultural Business/Management 68,500 59,000 68,500 78,0004Food Science 63,600 60,000 63,000 65,0005 62,025 55,000 58,355 66,35026BUSINESS MAJORSAccountingBUSINESS MAJORS / SALARY RANGES 100,000 100,000 98,000 98,000 65,000 63,500 55,000 55,000 80,000 66,350 60,000 58,355 55,000 68,000 55,000 71,000 72,000 64,500 64,500 56,000 56,000 75,000 68,000 75,000 70,000 60,000 56,000 ANCELOGISTICS/ MANAGEMENTSUPPLY CHAIN INFORMATIONSYSTEMS12 2018 WINTER SALARY SURVEY NATIONAL ASSOCIATION OF COLLEGES AND EMPLOYERSMARKETINGSALES
STARTING SALARY BY ACADEMIC MAJORMASTER’S DEGREE SALARIES BY MAJORACADEMIC ESActuarial Science 69,250 62,000 68,000 74,0008Business Administration/Management 78,332 55,000 68,000 100,00031Economics 66,986 56,000 64,500 71,00011Finance 68,389 56,000 64,500 72,00023Human Resources 69,939 56,000 72,500 80,00018International Business 58,600 55,000 56,000 56,0005Logistics/Supply Chain 66,080 56,000 68,000 75,00015Management Information Systems 69,996 60,000 70,000 75,00021Marketing 73,505 55,000 65,000 98,00017Sales 74,750 55,000 63,500 98,0008 63,000 55,000 61,000 71,0004Computer Science 77,394 69,000 75,000 84,22532Information Sciences & Systems 72,834 65,000 70,000 75,00022Software Applications 73,726 65,000 75,000 83,45017Aerospace/Aeronautical Engineering 71,679 65,000 75,000 77,0007Chemical Engineering 76,282 71,500 78,000 82,00011Civil Engineering 68,892 61,000 66,500 71,50010Computer Engineering 77,115 71,500 75,000 83,45017COMMUNICATIONS MAJORSCommunicationsCOMPUTER SCIENCES MAJORSENGINEERING MAJORSENGINEERING MAJORS / SALARY RANGES 100,000 80,000 77,000 75,000 83,450 82,000 78,000 71,500 65,000 71,500 66,500 75,000 71,500 82,000 75,625 80,000 76,000 70,000 70,000 81,000 75,000 71,500 77,000 65,000 61,000 60,000 85,000 ANICALSOFTWARESYSTEMSNATIONAL ASSOCIATION OF COLLEGES AND EMPLOYERS 2018 WINTER SALARY SURVEY 13
STARTING SALARY BY ACADEMIC MAJORMASTER’S DEGREE SALARIES BY MAJORACADEMIC ESElectrical Engineering 76,139 70,000 75,625 82,00022Environmental Engineering 68,471 61,000 68,300 71,5007Industrial/Manufacturing Engineering 81,156 72,000 78,400 85,0009Materials Engineering/Science 76,437 71,500 76,600 81,0006Mechanical Engineering 75,543 70,000 76,000 80,00021Software Engineering 77,959 71,500 75,000 81,00011Systems Engineering 76,214 65,000 77,000 85,0007Economics 76,175 57,200 67,500 95,0008Political Science/International Relations 67,133 55,000 56,400 90,0003Mathematics/Statistics 75,742 65,000 74,000 80,00013Chemistry 72,625 68,500 70,750 76,7504Physics 84,125 67,250 74,250 101,0004SOCIAL SCIENCES MAJORSMATHEMATICS AND SCIENCES MAJORSMATH & SCIENCES MAJORS / SALARY RANGES 120,000 101,000 100,000 80,000 80,000 74,000 65,000 60,000MATH/STATISTICS 76,750 70,750 68,500CHEMISTRY14 2018 WINTER SALARY SURVEY NATIONAL ASSOCIATION OF COLLEGES AND EMPLOYERS 74,250 67,250PHYSICS
STARTING SALARY BY ACADEMIC MAJORDOCTORAL DEGREESDOCTORAL DEGREES / SALARY RANGES BY BROAD CATEGORY 120,000 119,714 100,000 94,269 88,269 95,842 92,789 91,857 85,306 85,857 80,000 75,218 60,000COMPUTER SCIENCEENGINEERINGMATH & SCIENCESDOCTORAL DEGREE SALARIES BY r Science 94,877 80,000 96,000 105,0007Information Sciences & Systems 76,046 69,638 78,500 80,0003Software Applications 77,713 69,638 80,000 83,5003Chemical Engineering 90,875 87,750 91,000 94,0004Computer Engineering 95,500 85,500 100,000 101,0003Electrical Engineering 94,500 88,500 96,000 100,5004Materials Engineering/Science 85,165 77,330 87,750 93,0004Mechanical Engineering 89,750 87,500 91,000 92,0004 87,625 78,250 87,250 97,0004 114,667 96,000 98,000 150,0003ACADEMIC MAJORRESPONSESCOMPUTER SCIENCES MAJORSENGINEERING MAJORSMATHEMATICS AND SCIENCES MAJORSMathematics/StatisticsPhysicsNATIONAL ASSOCIATION OF COLLEGES AND EMPLOYERS 2018 WINTER SALARY SURVEY 15
STARTING SALARIES BY MAJOR AND INDUSTRYSTARTING SALARIESBY MAJOR AND INDUSTRY16 2018 WINTER SALARY SURVEY NATIONAL ASSOCIATION OF COLLEGES AND EMPLOYERS
STARTING SALARIES BY MAJOR AND INDUSTRYBACHELOR’S DEGREESBACHELOR’S DEGREE SALARIES BY MAJOR AND INDUSTRY25THPERCENTILEMEDIAN75THPERCENTILE 56,267 51,000 56,300 60,0006 54,920 52,000 54,600 58,0005Chemical (Pharmaceutical) Manufacturing 50,833 47,500 50,000 55,0003Computer & Electronics Manufacturing 55,534 50,000 56,000 62,00010Finance, Insurance, & Real Estate 58,083 51,500 56,000 63,00018Food & Beverage Manufacturing 59,287 57,720 59,000 61,0006Government 52,533 51,600 52,000 54,0003Information 58,167 45,000 64,500 65,0003Miscellaneous Manufacturing 54,636 50,000 55,500 61,00011Miscellaneous Professional Services 52,500 47,500 55,000 55,0003Motor Vehicle Manufacturing 53,293 50,000 55,000 55,4665Retail Trade 54,000 50,000 55,000 57,0003Transportation 52,167 47,000 52,500 57,0003Utilities 49,133 41,000 50,500 55,0006 61,917 56,000 60,000 67,00012Computer & Electronics Manufacturing 54,542 49,450 53,000 63,5008Finance, Insurance, & Real Estate 58,600 50,000 55,000 68,00015Food & Beverage Manufacturing 56,020 53,500 53,560 61,0003Information 53,875 43,000 55,250 64,7504Miscellaneous Manufacturing 52,786 50,000 55,000 58,0007Miscellaneous Professional Services 54,375 51,250 55,000 57,5004Motor Vehicle Manufacturing 53,438 52,000 53,315 55,0003Retail Trade 54,657 49,600 55,000 57,0007Transportation 53,767 47,000 52,500 61,8003Utilities 51,120 50,000 51,000 54,6005Finance, Insurance, & Real Estate 62,688 54,000 61,500 70,00016Food & Beverage Manufacturing 57,853 53,560 59,000 61,0003ACADEMIC MAJOR/INDUSTRYMEANRESPONSESAGRICULTURE AND NATURAL RESOURCES MAJORSAgricultural Business/ManagementFood & Beverage ManufacturingFood ScienceFood & Beverage ManufacturingBUSINESS MAJORSAccountingActuarial ScienceFinance, Insurance, & Real EstateBusiness Administration/Management
4 2018 WINTER SALARY SURVEY NATIONAL ASSOCIATION OF COLLEGES AND EMPLOYERS EXECUTIVE SUMMARY BACHELOR'S DEGREE GRADUATES In this first look at starting salary projections for the Class of 2018, employers responding for NACE's Winter 2018 Salary Survey report expect to make students earning engineering, computer science, and math