Transcription
WINTER 2019NACESALARY SURVEYSTARTING SALARY PROJECTIONS FOR CLASS OF 2019 NEW COLLEGE GRADUATESDATA REPORTED BY EMPLOYERSSALARIESBY MAJORp. 8SALARIESBY INDUSTRYp. 18SALARIESBY REGIONp. 38FEATURINGStarting SalaryProjections forAll Degree LevelsBACHELOR’SMASTER’SDOCTORALNATIONAL ASSOCIATION OFCOLLEGES AND EMPLOYERSwww.naceweb.org
TABLE OF CONTENTSABOUT THE SURVEY. 2HOW TO READ SALARY SURVEY. 4EXECUTIVE SUMMARY. 5STARTING SALARY BY ACADEMIC MAJOR. 8STARTING SALARY BY MAJOR AND INDUSTRY .18STARTING SALARY BY INDUSTRY AND MAJOR.28STARTING SALARY BY REGION AND MAJOR.38APPENDIX.52 2019 National Association of Colleges and Employers. All rights reserved.NATIONAL ASSOCIATION OF COLLEGES AND EMPLOYERS WINTER 2019 SALARY SURVEY 1
ABOUT THE SURVEYABOUT THE SURVEYThe Winter 2019 Salary Survey contains annual salary projections for Class of 2019 college graduates. Thefigures reported are for base salaries only and do not include bonuses, commissions, fringe benefits, or overtimerates. The report provides the detailed salary projections by academic major and degree level, along withbreakouts by both industry and geographic region.Data contained in the report were obtained by surveying NACE employer members from August 1, 2018,through December 3, 2018. A total of 186 surveys were returned for a 20 percent response rate. Of thoseresponding, 8.1 percent of respondents were from New England, 8.1 percent were from the Plains, 11.9 percentwere from the Mideast, 12.4 percent of respondents were from the Rocky Mountain/Far West, 15.7 percent werefrom the Southeast, 17.3 percent were from the Southwest, and 26.5 percent were from the Great Lakes. A list ofrespondents by industry and a partial list of organizations that supplied data for this report, can be found in theAppendix.Salary Survey (ISSN 1520-8648) is available to individuals holding membership in the National Associationof Colleges and Employers; it is also available on a subscription basis. The Salary Survey report is publishedthree times a year—January, July, and September—by the National Association of Colleges and Employers,62 Highland Ave., Bethlehem, PA 18017-9085. For more information, see www.naceweb.org/salaryresources/index.aspx or contact NACE at 610.868.1421.NACE RESEARCH STAFFEdwin W. Koc, Director of Research, Public Policy, and Legislative AffairsJoshua Kahn, Assistant Director of Research and Public PolicyAndrea J. Koncz, Research ManagerAngelena Salvadge, Research AssociateAnna Longenberger, Research Assistant2 WINTER 2019 SALARY SURVEY NATIONAL ASSOCIATION OF COLLEGES AND EMPLOYERS
SALARY SURVEY ISSUES FOR THE CLASS OF 2019The Winter issue features starting salary projections by major from employer-provided data. The Winter 2019report is the first report for the Class of 2019. Data are available by major, industry, and region. There arealso data for advanced-degree candidates—the report includes data for 33 master’s and 11 doctoral degreedisciplines.The Fall issue reports data from participating institutions; the data are provided to the schools by their graduates.In this sense, the data are “early” returns on First-Destination Survey salary data. The report includes data bymajor and region. The Fall 2019 issue will provide actual starting salary data for the Class of 2019.The Summer issue serves as the final report for the previous year’s graduating class. The report features dataprovided through the national First-Destination Survey initiative; the data represent actual starting salaries (notprojections) report by graduates to their institutions. Data are reported by major and region. The Summer 2019issue is the final report on starting salaries for the Class of 2018. The Summer 2020 Salary Survey will serve asthe final report for the Class of 2019.SALARY DATA FOR THE CLASS OF 2019REPORTWHATDATA SOURCEFirst Report—Winter 2019Pre-graduation projected starting salariesEmployersSecond Report—Fall 2019Early results, post-graduation actual starting salariesStudents/SchoolsFinal Report—Summer 2020Final results, post-graduation actual starting salariesFirst-Destination Survey(Students/Schools)NATIONAL ASSOCIATION OF COLLEGES AND EMPLOYERS WINTER 2019 SALARY SURVEY 3
HOW TO READ SALARY SURVEYHOW TO READ SALARY SURVEYBACHELOR’S / MASTER’S / DOCTORALPAGE 8STARTING SALARY BY ACADEMIC MAJORIn this section, you will find the average starting salary according to the major field of study, with noregard to the type of employer reporting the salary. Refer to this section when you want to know thestarting salary for a graduate holding a degree in a specific discipline, such as accounting or computerscience.PAGE 18STARTING SALARY BY MAJOR AND INDUSTRYThis section shows data first by the major field of study, then by the type of employer (industry) reporting thesalaries. Employer types are listed in alphabetical order under each major. See this section when you wantthe average starting salary reported by a specific type of employer to a graduate earning a degree in aspecific major. (Example: Average salary that chemical (pharmaceutical) manufacturing firms are reportingfor electrical engineering graduates.)PAGE 28STARTING SALARY BY INDUSTRY AND MAJORThis section contains the same basic information as “Starting Salary by Major and Industry,” but in adifferent order. You will see data by a specific type of employer (industry), then according to the averagesalary by major field of study. Industries are arranged in alphabetical order. Majors are listed under eachindustry in the typical report order by broad category, then alphabetical within the category. Use this sectionto find the average starting salary reported by a specific type of employer to a graduate in a specific major.(Example: Majors hired by construction firms, and their corresponding average starting salaries.)PAGE 38STARTING SALARY BY REGION AND MAJORIn this section, you will find the average starting salary according to the major field of study, within sevengeographic regions (New England, Mideast, Great Lakes, Plains, Southeast, Southwest, and RockyMountain/Far West. Note: For the master’s and doctoral degree levels, regions have been combined dueto limited data.) The regional data are based upon the locations of the participating organizations thatsupplied information for the majors within each region. The majors are reported in typical report order bybroad category, then in alphabetical order within the category. Averages are provided strictly by major fieldof study with no regard to the type of employer reporting the salary. Refer to this section when you want toknow the starting salary for a graduate holding a degree in a specific discipline in a regional location, suchas mechanical engineering majors hired by participants in the West.4 WINTER 2019 SALARY SURVEY NATIONAL ASSOCIATION OF COLLEGES AND EMPLOYERS
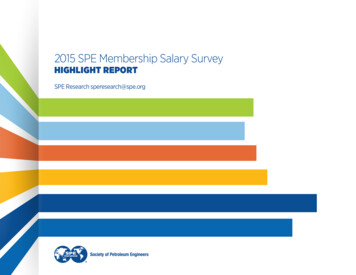
EXECUTIVE SUMMARYEXECUTIVE SUMMARYSTARTING SALARY PROJECTIONS FOR THE CLASS OF 2019BACHELOR’S DEGREE GRADUATESThe initial starting salary projections for Class of 2019 bachelor’s degree graduates strongly indicate that thosewith STEM degrees will continue to earn the highest starting salaries. The top-paid graduates this year are onceagain expected to earn engineering, computer science, and math and sciences degrees. (See Figure 1.)Overall, at this point in the reporting cycle, the news is generally positive for Class of 2019 graduates. While thegains in average starting salary projections across all reported disciplines are relatively small, there is only onethat dropped and—at -0.1 percent—it is negligible.At 69,188, the average starting salary projection for Class of 2019 engineering graduates is 4 percent higherthan last year’s salary projection. Among the individual engineering disciplines, petroleum engineering majorshave the highest salary projection, which—at 84,160—soars high above the overall average for these majors.FIGURE 1 AVERAGE SALARIES BY DISCIPLINE / BACHELOR’S DEGREESBROAD CATEGORY2019 SALARYPROJECTION2018 SALARYPROJECTIONPERCENTCHANGEENGINEERING 69,188 66,5214.0%COMPUTER SCIENCE 67,539 66,0052.3%MATH & SCIENCES 62,177 61,8670.5%BUSINESS 57,657 56,7201.7%SOCIAL SCIENCES 57,310 56,6891.1%HUMANITIES 56,651 56,688-0.1%AGRICULTURE & NATURAL RESOURCES 55,750 53,5654.1%COMMUNICATIONS 52,056 51,4481.2%Computer science graduates are also projected to earn an average starting salary that exceeds last year’s. Thesalary projection for this year’s computer science graduates is 67,539, which is a gain of 2.3 percent. Amongthe reported disciplines, individual computer science majors have the highest salary projection of 68,103,which is up 1 percent. Additionally, the average salary projections for both information sciences and softwareapplications are greater this year, with the projection for information sciences ( 66,705) rising 3.2 percent andfor software applications ( 67,691) jumping 4.2 percent from last year’s projections.The overall average starting salary projection for math and sciences graduates remains nearly level at 62,177,an increase of less than 1 percent over last year. Individual math majors are expected to earn starting salariesgreater than the overall average, as their salary projection has edged up 3 percent to 62,823.Business majors have an overall average salary projection of 57,657 this year, an increase of 1.7 percent. Inlast year’s Winter 2018 Salary Survey report, marketing majors were projected to be the highest-paid businessNATIONAL ASSOCIATION OF COLLEGES AND EMPLOYERS WINTER 2019 SALARY SURVEY 5
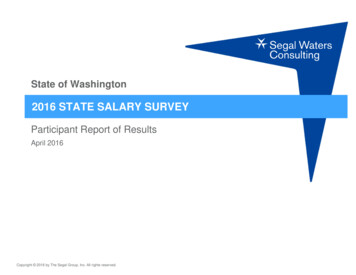
EXECUTIVE SUMMARYmajor. This is not the case for the Class of 2019, as actuarial science and management information systems (MIS)majors—with average salary projections of 63,820 and 61,697, respectively—now top the list. Demand forMIS graduates may be pushing their salary projection upward. Nearly half of employers responding to the NACEJob Outlook 2019 survey reported plans to hire these particular graduates. Meanwhile, the projected average formarketing majors has dropped 10.3 percent, from 62,634 last year to 56,186 this year.The average salary projection for social sciences graduates continues to rise, albeit by just 1.1 percent this year.Although data in these fields are limited, this particular group of majors has seen significant increases over the pasttwo years—6 percent last year and 15 percent for the Class of 2017. While all of the individual reported disciplinesalso have higher salary projections this year, this positive news is tempered by the fact that four of the five reportedincreases are between just 0.3 and 1.3 percent. Psychology majors anticipate the highest increase at 4.1 percent.Class of 2019 graduates earning communications degrees are on track to receive salaries that are slightly higherthan their counterparts from the Class of 2018. The overall average starting salary projection of 52,056 is up1.2 percent from last year. Advertising and public relations majors are expected to see the most positive changes:The average salary projection for advertising is expected to grow 3.4 percent to 52,909, while projections havepublic relations majors seeing a gain of 3 percent to 51,929.Humanities graduates are the only ones to see their salary projection drop, although, at 56,651, it is down just0.1 percent from last year. All seven reported humanities majors currently have average starting salary projectionsthat exceed 55,000, which was also the case last year. Furthermore, the good news for these graduates is thattheir salary projections appear to be holding steady this year. Two years ago, the highest-paid of the seven reportedhumanities degrees was liberal arts/general studies, which had a projected salary of just 51,100.MASTER’S DEGREE GRADUATESThe average salary projections for Class of 2019 master’s degree graduates are characterized by largeincreases. In fact, the projections for one of the four reported disciplines exceeds 10 percent, while those for twoothers are greater than 8 percent. (See Figure 2.)Engineering majors are expected to earn the highest average salary among Class of 2019 master’s degreegraduates. Their overall average salary projection has rocketed 9.4 percent to 82,589 this year.Computer science graduates are also seeing significant gains in their average salary projection as it has climbed8.5 percent to 81,466. Driving the overall increase for these graduates may be the average salary projectionfor information sciences and systems majors. Their anticipated salary of 81,895 is up 12.4 percent this year.While Class of 2019 master’s degree business graduates are third on the list of top-paid majors, they boast thehighest expected salary increase—10.9 percent. This boost brings their projection to 77,347 this year. Of the12 reported individual business majors, one-third have salary projections that exceed 80,000, including M.B.A.graduates, whose average projection is up 8 percent to 84,580.The overall average salary projection for Class of 2019 master’s degree graduates in math and sciences is down1.3 percent to 75,737. However, extremely limited data for these particular degrees may be partly to blame.Each of the five reported math and sciences majors at the master’s degree level this year have fewer than 10salary projections provided.6 WINTER 2019 SALARY SURVEY NATIONAL ASSOCIATION OF COLLEGES AND EMPLOYERS
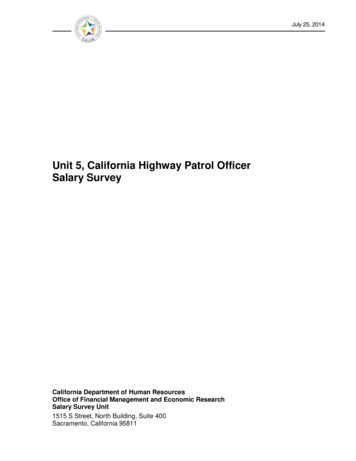
EXECUTIVE SUMMARYFIGURE 2 AVERAGE SALARIES BY DISCIPLINE / MASTER’S DEGREES2019 SALARYPROJECTIONBROAD CATEGORY2018 SALARYPROJECTIONPERCENTCHANGEENGINEERING 82,589 75,4819.4%COMPUTER SCIENCE 81,466 75,1038.5%BUSINESS 77,347 69,75610.9%MATH & SCIENCES 75,737 76,745-1.3%DOCTORAL DEGREE GRADUATESWith extremely limited data also provided at the doctoral degree level, average salary projections for the Classof 2019 are available in just three major categories—engineering, computer science, and math and sciences. Allhave average salary projections that exceed 100,000. (See Figure 3.)This year, doctoral degree graduates earning engineering degrees have a considerably higher average salaryprojection than last year. Their current projection of 102,074 is 12.3 percent higher than the projected startingsalary for the Class of 2018. The large increase comes as no surprise as the salary projections of five of theseven reported individual majors surpassed 100,000. In addition, the 113,000 salary projection for softwareengineering majors has pushed the overall average higher.FIGURE 3 AVERAGE SALARIES BY DISCIPLINE / DOCTORAL DEGREESBROAD CATEGORY2019 SALARYPROJECTION2018 SALARYPROJECTIONPERCENTCHANGEENGINEERING 102,074 90,92912.3%COMPUTER SCIENCE 101,462 86,57017.2%MATH & SCIENCES 100,920 99,2141.7%The average salary projection for computer science graduates has recovered from where it stood in last year’sWinter 2018 Salary Survey report. The current average of 101,462 is 17.2 percent higher than last year’saverage, which itself was down 21 percent from that for the Class of 2017. With extremely limited data at thisdegree level and for this discipline, software applications majors have the highest salary projection— 108,333—with specific computer science majors following with an average of 103,833.NATIONAL ASSOCIATION OF COLLEGES AND EMPLOYERS WINTER 2019 SALARY SURVEY 7
STARTING SALARYBY ACADEMIC MAJOR8 WINTER 2019 SALARY SURVEY NATIONAL ASSOCIATION OF COLLEGES AND EMPLOYERS
STARTING SALARY BY ACADEMIC MAJORBACHELOR’S DEGREESBACHELOR'S DEGREES / SALARY RANGES BY BROAD CATEGORY 80,000 70,000 60,000 50,000 57,277 52,813 72,024 66,041 67,795 64,840 68,189 62,020 61,713 58,000 55,500 54,313 70,827 59,233 57,221 53,872 58,157 51,370 60,707 63,557 57,828 53,103 54,481 44,778 40,000AGRICULTURE & BUSINESS COMMUNICATIONS COMPUTERNATURAL SMATH &SCIENCESBACHELOR’S DEGREE SALARIES BY tural Business/Management 54,056 54,000 55,000 55,0009Conservation/Natural Resources Management 57,667 55,000 57,000 61,0003Animal Science 54,167 52,500 53,000 57,0003Food Science 57,167 55,000 56,000 60,0006Plant Science 57,667 55,000 57,000 61,0003Accounting 57,511 54,000 57,250 60,00074Actuarial Science 63,820 57,500 62,400 70,00015Business Administration/Management 57,133 52,500 55,500 60,00058Economics 59,480 53,500 58,448 65,00044Finance 58,464 53,500 57,750 62,50072Hospitality Management 55,000 50,000 57,000 59,00011Human Resources 54,295 50,460 54,000 58,72340International Business 56,778 50,000 57,000 59,00018Logistics/Supply Chain 57,060 53,000 58,896 62,50049Management Information Systems 61,697 57,250 62,350 67,60040Marketing 56,186 50,000 55,000 60,00047Sales 55,561 50,000 54,600 59,00035ACADEMIC MAJORRESPONSESAGRICULTURE AND NATURAL RESOURCES MAJORSBUSINESS MAJORSNATIONAL ASSOCIATION OF COLLEGES AND EMPLOYERS WINTER 2019 SALARY SURVEY 9
STARTING SALARY BY ACADEMIC MAJORBACHELOR’S DEGREE SALARIES BY sing 52,909 45,000 54,000 59,00011Communications 51,412 45,000 50,000 57,50017Journalism 52,333 44,000 52,500 58,50012Public Relations 51,929 45,000 50,000 58,00014ACADEMIC MAJORRESPONSESCOMMUNICATIONS MAJORSBUSINESS MAJORS / SALARY RANGES 80,000 70,000 67,600 65,000 60,000 60,000 57,250 54,000 50,000 40,000ACCOUNTING 60,000 55,500 52,500 62,500 62,500 58,448 57,750 58,896 53,500 53,500 53,000BUSINESSECONOMICSADMINISTRATIONFINANCE 62,350 57,250LOGISTICS/ MANAGEMENTSUPPLY CHAIN INFORMATIONSYSTEMS 60,000 59,000 55,000 54,600 50,000 50,000MARKETINGSALESENGINEERING MAJORS / SALARY RANGES 80,000 73,000 70,000 74,000 70,000 66,346 65,000 67,000AEROSPACECHEMICAL 60,000 68,000 65,000 62,000 72,500 73,000 68,500 69,000 67,000 64,000 72,000 72,000 68,000 65,000 68,500 71,500 65,000 66,346 65,000SOFTWARESYSTEMS 50,000 40,000CIVILCOMPUTERELECTRICALMECHANICAL10 WINTER 2019 SALARY SURVEY NATIONAL ASSOCIATION OF COLLEGES AND EMPLOYERS
STARTING SALARY BY ACADEMIC MAJORBACHELOR’S DEGREE SALARIES BY r Science 68,103 63,000 66,673 72,00062Information Sciences & Systems 66,705 60,000 65,000 70,00049Software Applications 67,691 63,000 66,346 70,00039Aerospace/Aeronautical Engineering 69,507 65,000 66,346 73,00013Biomedical Engineering 67,675 65,000 66,000 73,00010Chemical Engineering 72,889 67,000 70,000 74,00039Civil Engineering 65,977 62,000 65,000 68,00023Computer Engineering 68,778 64,000 68,500 72,50041Electrical Engineering 70,635 67,000 69,000 73,00053Engineering Technology 62,936 60,000 65,000 65,50021Environmental Engineering 65,894 62,000 65,000 72,00018Industrial/Manufacturing Engineering 68,619 65,000 68,000 72,00032Materials Engineering/Science 67,375 65,000 67,000 68,00018Mechanical Engineering 70,329 65,000 68,000 72,00059Nuclear Engineering 66,250 64,500 65,500 68,0004Petroleum Engineering 84,160 70,000 75,000 104,0005Software Engineering 69,117 65,000 68,500 72,00035Systems Engineering 68,833 65,000 66,346 71,50017ACADEMIC MAJORRESPONSESCOMPUTER SCIENCES MAJORSENGINEERING MAJORSHUMANITIES MAJORS / SALARY RANGES 70,000 60,000 60,750 57,750 50,000 40,000 59,000 58,000 57,500 51,500ENGLISH 59,000 57,500 58,000 55,000 53,000 59,000 58,000 57,500 50,000FOREIGN LANGUAGESHISTORYLIBERAL ARTS/GENERAL STUDIESPHILOSOPHYNATIONAL ASSOCIATION OF COLLEGES AND EMPLOYERS WINTER 2019 SALARY SURVEY 11
STARTING SALARY BY ACADEMIC MAJORBACHELOR’S DEGREE SALARIES BY MAJORMEAN25THPERCENTILEMEDIAN75THPERCENTILEArea & Gender Studies 57,400 57,500 58,000 59,0005English Language & Literature 57,250 51,500 57,750 60,7508Foreign Language & Literature 57,400 57,500 58,000 59,0005History 55,714 50,000 57,500 59,0007Liberal Arts/General Studies 55,444 53,000 55,000 58,0009Philosophy 57,400 57,500 58,000 59,0005Visual & Performing Arts 57,000 53,750 57,750 60,2504Economics 58,565 54,000 58,000 63,00023Political Science/International Relations 57,200 53,000 57,750 60,00010Psychology 57,000 53,500 57,750 59,50012Sociology 55,813 52,000 57,750 58,5008Social Work 54,900 50,000 57,500 58,0005Mathematics/Statistics 62,823 55,000 64,000 68,00022Biology/Biological Sciences 61,333 50,000 64,000 68,0006Construction Science 62,136 55,000 64,000 68,00010Chemistry 57,429 50,000 58,000 63,0007Environmental Science 61,667 55,000 64,500 68,0006Geology/Geological Sciences 62,250 56,500 65,500 68,0004Physics 66,718 59,557 65,000 75,7506ACADEMIC MAJORRESPONSESHUMANITIES MAJORSSOCIAL SCIENCES MAJORSMATHEMATICS AND SCIENCES MAJORS12 WINTER 2019 SALARY SURVEY NATIONAL ASSOCIATION OF COLLEGES AND EMPLOYERS
STARTING SALARY BY ACADEMIC MAJORSOCIAL SCIENCES MAJORS / SALARY RANGES 70,000 63,000 60,000 60,000 58,000 54,000 57,750 59,500 57,750 53,000 53,500 58,500 57,750 52,000 50,000 40,000 58,000 57,500 50,000ECONOMICSPOLITICAL SCIENCEPSYCHOLOGYSOCIOLOGYSOCIAL WORKMATH & SCIENCES MAJORS / SALARY RANGES 80,000 75,750 70,000 68,000 68,000 64,000 64,000 60,000 68,000 64,500 63,000 59,557 58,000 55,000 55,000 50,000 50,000MATH/STATISTICS 65,000BIOLOGY 50,000CHEMISTRYENVIRONMENTALSCIENCEPHYSICSNATIONAL ASSOCIATION OF COLLEGES AND EMPLOYERS WINTER 2019 SALARY SURVEY 13
STARTING SALARY BY ACADEMIC MAJORMASTER’S DEGREESMASTER’S DEGREES / SALARY RANGES BY BROAD CATEGORY 100,000 90,183 89,950 88,66784,207 80,000 79,728 77,338 73,961 75,457 71,905 70,327 67,167 62,749 60,000BUSINESSCOMPUTER SCIENCEENGINEERINGMATH & SCIENCESMASTER’S DEGREE SALARIES BY ing 69,605 59,500 65,000 73,62025Actuarial Science 90,000 80,000 80,000 110,0003Business Administration/Management 84,580 65,000 80,000 110,00031Economics 75,052 58,000 65,076 85,00011ACADEMIC MAJORRESPONSESBUSINESS MAJORSBUSINESS MAJORS / SALARY RANGES 120,000 110,000 106,500 100,000 80,000 80,000 85,000 85,000 73,620 60,000 40,000 65,000 59,500ACCOUNTING 65,000 65,076 58,000BUSINESSECONOMICSADMINISTRATION 68,550 55,000FINANCE 80,000 73,620 80,000 78,200 68,000 82,500 69,500 80,000 65,076 63,800 54,000LOGISTICS/ MANAGEMENTSUPPLY CHAIN INFORMATIONSYSTEMS14 WINTER 2019 SALARY SURVEY NATIONAL ASSOCIATION OF COLLEGES AND EMPLOYERSMARKETINGSALES
STARTING SALARY BY ACADEMIC MAJORMASTER’S DEGREE SALARIES BY MAJORMEAN25THPERCENTILEMEDIAN75THPERCENTILEFinance 74,201 55,000 68,550 85,00019Hospitality Management 78,333 45,000 80,000 110,0003Human Resources 75,792 68,775 77,500 85,00016International Business 88,333 75,000 80,000 110,0003Logistics/Supply Chain 72,338 54,000 73,620 80,00011Management Information Systems 76,106 68,000 78,200 80,00017Marketing 85,633 69,500 82,500 106,50012Sales 73,775 63,800 65,076 80,0005Computer Science 82,275 70,000 79,500 92,00026Information Sciences & Systems 81,895 65,000 80,000 95,00019Software Applications 79,519 65,000 79,780 80,00015Aerospace/Aeronautical Engineering 87,393 75,000 83,750 92,0007Biomedical Engineering 81,393 68,000 80,000 92,0007Chemical Engineering 89,793 77,000 83,125 98,77210Civil Engineering 76,987 62,920 65,500 80,0006Computer Engineering 82,133 71,952 78,000 88,50020Electrical Engineering 82,270 74,000 80,000 92,00019Engineering Technology 78,433 65,000 67,500 80,0006Environmental Engineering 80,820 66,000 70,000 80,0005Industrial/Manufacturing Engineering 79,300 70,000 75,000 82,50011 90,000 90,000ACADEMIC MAJORRESPONSESCOMPUTER SCIENCES MAJORSENGINEERING MAJORSENGINEERING MAJORS / SALARY RANGES 100,000 90,000 98,772 92,000 92,000 88,500 83,750 85,000 83,125 80,000 80,000 75,000 77,000 78,000 71,952 70,000 80,000 74,000 76,000 77,000 75,000 70,000 76,000 70,000 65,500 62,920 ANICALSOFTWARESYSTEMSNATIONAL ASSOCIATION OF COLLEGES AND EMPLOYERS WINTER 2019 SALARY SURVEY 15
STARTING SALARY BY ACADEMIC MAJORMASTER’S DEGREE SALARIES BY ls Engineering/Science 85,708 75,000 79,750 83,7506Mechanical Engineering 82,107 70,000 76,000 90,00018Software Engineering 81,809 75,000 77,000 90,00017Systems Engineering 82,073 70,000 76,000 85,0009 64,833 57,000 62,500 75,0003Mathematics/Statistics 84,100 77,000 80,000 92,0009Biology/Biological Sciences 67,333 50,000 72,000 80,0003Chemistry 71,481 72,000 72,903 80,0005Physics 75,131 72,903 77,000 83,7505ACADEMIC MAJORRESPONSESSOCIAL SCIENCES MAJORSEconomicsMATHEMATICS AND SCIENCES MAJORSMATH & SCIENCES MAJORS / SALARY RANGES 100,000 92,000 83,750 80,000 80,000 80,000 77,000 77,000 72,903 72,000 60,000MATH/STATISTICSCHEMISTRY16 WINTER 2019 SALARY SURVEY NATIONAL ASSOCIATION OF COLLEGES AND EMPLOYERS 72,903PHYSICS
STARTING SALARY BY ACADEMIC MAJORDOCTORAL DEGREESDOCTORAL DEGREES / SALARY RANGES BY BROAD CATEGORY 150,000 126,692 120,000 98,769 113,220 100,963 99,920 96,620 90,338 90,000 60,000 115,532 83,846COMPUTER SCIENCEENGINEERINGMATH & SCIENCESDOCTORAL DEGREE SALARIES BY MAJORMEAN25THPERCENTILEMEDIAN75THPERCENTILE 103,833 90,000 102,000 130,0006 92,750 70,000 93,000 115,5004 108,333 90,000 100,000 135,0003 84,667 50,000 100,000 104,0003Chemical Engineering 107,000 92,000 104,000 125,0003Computer Engineering 105,000 95,000 102,000 125,0006Electrical Engineering 103,200 95,000 100,000 104,0005 97,833 92,000 97,500 104,0003Mechanical Engineering 104,500 92,000 102,000 125,0006Software Engineering 113,000 100,000 104,000 135,0003 102,000 95,000 100,000 125,0005ACADEMIC MAJORRESPONSESCOMPUTER SCIENCES MAJORSComputer ScienceInformation Sciences & SystemsSoftware ApplicationsENGINEERING MAJORSBiomedical EngineeringMaterials Engineering/ScienceMATHEMATICS AND SCIENCES MAJORSMathematics/StatisticsNATIONAL ASSOCIATION OF COLLEGES AND EMPLOYERS WINTER 2019 SALARY SURVEY 17
STARTING SALARYBY MAJOR AND INDUSTRY18 WINTER 2019 SALARY SURVEY NATIONAL ASSOCIATION OF COLLEGES AND EMPLOYERS
STARTING SALARY BY MAJOR AND INDUSTRYBACHELOR’S DEGREESTOP-PAYING INDUSTRIES / BACHELOR’S DEGREESAVERAGE SALARYPROJECTIONINDUSTRYNUMBER OF SALARYPROJECTIONSOil & Gas Extraction 79,36141Engineering Services 69,61328Management Consulting 69,39433Miscellaneous Professional Services 67,65040Chemical (Pharmaceutical) Manufacturing 66,73289BACHELOR’S DEGREE SALARIES BY MAJOR AND INDUSTRYMEAN25THPERCENTILEMEDIAN75THPERCENTILE 53,333 48,000 55,000 57,0003 58,333 55,000 57,000 63,0003Chemical (Pharmaceutical) Manufacturing 62,115 58,896 59,450 68,0003Computer & Electronics Manufacturing 57,743 54,000 60,000 62,5007Finance, Insurance, & Real Estate 57,608 52,500 56,250 62,50018Government 51,095 48,000 52,000 54,0005Information 61,250 55,000 62,500 67,5004Miscellaneous Manufacturing 58,900 56,000 58,500 60,00010Motor Vehicle Manufacturing 53,307 50,920 54,000 55,0003Retail Trade 55,750 54,500 55,000 57,0004Utilities 56,400 54,000 55,000 60,0005Wholesale Trade 53,667 48,000 55,000 58,0003 63,989 57,500 60,000 70,0009Chemical (Pharmaceutical) Manufacturing 60,632 55,000 58,896 68,0003Computer & Electronics Manufacturing 60,340 60,000 60,000 62,5005Finance, Insurance, & Real Estate 58,361 52,500 57,500 62,50013Food & Beverage Manufacturing 59,000 55,000 57,000 65,0003Government 51,159 46,476 52,000 55,0003Information 58,333 50,000 60,000 65,0003ACADEMIC MAJOR/INDUSTRYRESPONSESAGRICULTURE AND NATURAL RESOURCES MAJORSAgricultural Business/ManagementFood & Beverage ManufacturingFood ScienceFood & Beverage ManufacturingBUSINESS MAJORSAccountingActuarial ScienceFinance, Insurance, & Real EstateBusiness Administration/ManagementNATIONAL ASSOCIATION OF COLLEGES AND EMPLOYERS WINTER 2019 SALARY SURVEY 19
STARTING SALARY BY MAJOR AND INDUSTRYBACHELOR’S DEGREE SALARIES BY MAJOR AND ellaneous Manufacturing 54,429 52,000 54,000 57,0007Retail Trade 56,000 54,000 55,000 58,0005Utilities 56,667 55,000 55,000 60,0003Wholesale Trade 48,000 45,000 48,000 51,0003Chemical (Pharmaceutical) Manufacturing 62,115 58,896 59,450 68,0003Finance, Insurance, & Real Estate 58,412 51,250 56,250 64,00016Information 60,000 50,000 65,000 65,0003Oil & Gas Extraction 74,400 66,000 67,200 90,0003Retail Trade 56,250 54,000 56,000 58,5004Wholesale Trade 52,000 46,500 51,500 57,5004Chemical (Pharmaceutical) Manufacturing 60,712 57,698 59,173 63,7254Computer & Electronics Manufacturing 62,850 58,550 60,000 62,5007Finance, Insurance, & Real Estate 59,083 52,500 57,750 65,00018Food & Beverage Manufacturing 58,000 55,000 57,000 62,0003Government 50,369 47,238 50,000 53,5004Information 61,250 55,000 62,500 67,5004Miscellaneous Manufacturing 58,000 55,500 57,000 60,0008Motor Vehicle Manufacturing 53,307 50,920 54,000 55,0003Retail Trade 56,900 55,000 58,000 58,5005Utilities 55,300 48,500 55,000 60,0005Wholesale Trade 50,167 44,500 48,000 58,0003 54,500 49,000 53,750 60,0004Chemical (Pharmaceutical) Manufacturing 62,115 58,896 59,450 68,0003Computer & Electronics Manufacturing 56,888 54,500 56,775 59,2754Finance, Insurance, & Real Estate 54,800 50,000 54,000 60,00010Information 55,667 50,000 52,000 65,0003Miscellaneous Manufacturing 53,000 51,000 51,500 55,0004Motor Vehicle Manufacturing 51,307 49,000 50,920 54,0003Retail Trade 56,000 54,000 55,000 58,0005Finance, Insurance, & Real Estate 55,750 46,500 51,500 60,0008Retail Trade 57,000 54,000 58,000 59,0003ACADEMIC MAJOR/INDUSTRYRESPONSESEconomicsFinanceHospitality ManagementFinance, Ins
Salary Survey (ISSN 1520-8648) is available to individuals holding membership in the National Association . resources/index.aspx or contact NACE at 610.868.1421. ABOUT THE SURVEY ABOUT THE SURVEY NACE RESEARCH STAFF Edwin W. Koc, Director of Research, Public Policy, and Legislative Affairs