Transcription
Animal Biodiversity and Conservation 44.1 (2021)67Effects of elevation gradientand aspect on butterfly diversityon Galičica Mountainin the Republic of Macedonia(south–eastern Europe)M. Popović, B. Micevski, R. VerovnikPopović, M., Micevski, B., Verovnik, R., 2021. Effects of elevation gradient and aspect on butterfly diversity onGaličica Mountain in the Republic of Macedonia (south–eastern Europe). Animal Bodiversity and Conservation,44.1: 67–78, Doi: ffects of elevation gradient and aspect on butterfly diversity on Galičica Mountain in the Republic of Macedonia (south–eastern Europe). The patterns of butterfly diversity and community changes in relation to elevationare an interesting and well–covered topic in ecology, but the effects of aspect have rarely been evaluated.Here we studied the changes in butterfly species richness and communities along the elevation gradient andaspect of Galičica Mountain. As expected, species richness changed with altitude, showing a bimodal patternwith two peaks and a declining trend towards higher altitude. Changes were well–correlated with the area ineach altitudinal zone, while the effects of productivity were less clear. Butterfly communities at higher altitudeswere the most distinct when grouped according to β diversity estimates, followed by mid– and low–altitudecommunities. Indicator species were found in mid–altitudes and for the combination of low–mid and mid–highaltitudes, but not among aspects. Overall, aspect produced a less conclusive effect on species richness andcommunity composition. South and north accounted for most of these differences despite dominant western andeastern and exposition of the mountain slopes. The community temperature index declined with altitude and onthe northern aspect, showing these areas hosted more cold–adapted species. Notes on butterfly conservationare provided as 23 species known from historical surveys have not been recorded recently.Data published through GBIF (Doi: 10.15470/jacl7y)Key words: Species richness, Altitude, Exposition, Lepidoptera, iNEXTResumenEfectos del gradiente de altitud y la orientación en la diversidad de mariposas de la montaña Galičica, en laRepública de Macedonia (Europa sudoriental). Los patrones de diversidad de mariposas y los cambios en lascomunidades en relación con la altitud son un tema interesante y bien estudiado en ecología, pero los efectosde la orientación se han evaluado muy poco. En el presente estudio analizamos los cambios en la riquezade especies de mariposas y sus comunidades a lo largo del gradiente de altitud y según la orientación dela montaña Galičica. De acuerdo con lo esperado, la riqueza de especies cambió con la altitud siguiendo unpatrón bimodal con los máximos y una tendencia decreciente hacia mayores altitudes. Los cambios estuvieronbien correlacionados con la superficie de cada zona de altitud, mientras que los efectos de la productividadfueron menos evidentes. Las comunidades de mariposas a mayor altitud fueron las más peculiares cuandose agruparon según las estimaciones de la diversidad beta, seguidas de las comunidades a media altitudy a baja altitud. Se observaron especies indicadoras en altitudes medias y en la combinación de altitudesmedias bajas y medias altas, pero no entre las orientaciones. En general, la orientación produjo un efectomenos concluyente en la riqueza de especies y la composición de las comunidades. La mayor parte de estasdiferencias se produjeron en el norte y en el sur, a pesar de que las laderas de la montaña están predominantemente orientadas al oeste y el este. El índice de temperatura comunitaria disminuyó con la altitud y enla orientación norte, lo que pone de manifiesto que estas zonas albergaban más especies adaptadas al frío.Se proporcionan notas sobre la conservación de las mariposas, ya que recientemente no se han registrado23 de las especies observadas en estudios históricos.Datos publicados en GBIF (Doi: 10.15470/jacl7y)ISSN: 1578–665 XeISSN: 2014–928 X [2021] Copyright belongs to the authors, who license thejournal Animal Biodiversity and Conservation to publish thepaper under a Creative Commons Attribution 4.0 License.
68Popović et al.Palabras clave: Riqueza de especies, Altitud, Exposición, Lepidoptera, iNEXTReceived: 10 VI 20; Conditional acceptance: 18 VIII 20; Final acceptance: 05 X 20Miloš Popović, University of Niš, Faculty of Natural Sciences and Mathematics, Department for Biology andEcology, Višegradska 33, 18000 Niš, Serbia.– Branko Micevski, University of Skopje, Faculty of NaturalSciences, Department for Animal Taxonomy and Ecology, Arhimedova 3 1000 Skopje, Republic of Macedonia.– Rudi Verovnik, University of Ljubljana, Biotechnical Faculty, Department of Biology, Jamnikarjeva 101,1000 Ljubljana, Slovenia.Corresponding author: M. Popović. E–mail: mpopovic@pmf.ni.ac.rsORCID ID: Miloš Popović: 0000-0003-0887-6683; Rudi Verovnik: 0000-0002-5841-5925
Animal Biodiversity and Conservation 44.1 (2021)IntroductionIt is generally agreed that species diversity declineswith altitude, somewhat repeating the more stablelatitudinal pattern (Rahbek, 1995). However, changeswith elevation are more complex and species diversitytends to follow four main patterns with rising altitude:decreasing, low plateau, low plateau with mid–elevation peak, and mid–elevation peak (McCain et al.,2010). These patterns could be explained by severalecological factors, including climate and productivity,species–area relationship, mid–domain effect, effectsof ecotone, biotic factors, evolution, and historical circumstances (Colwell and Lees, 2000; Lomolino, 2001;McCain, 2007; McCain et al., 2010). While studyingthe effects of biotic and evolutionary factors requiresdetailed planning and study design, other factors canoften be tested more easily. Relatively large mountainranges with diverse geological structure and climate(from Continental to Mediterranean) make south–eastern Europe an interesting region for studies of elevation gradients in species diversity. At the same time,data on butterfly diversity in this region is scatteredin a multitude of faunistic papers, while few studiesaddress the butterfly diversity pattern (Mihoci et al.,2011; Zografou et al., 2014, 2017; Kaltsas et al., 2018).Similarly, the effect of aspect is only rarely taken intoconsideration when addressing the distribution patternsof butterflies in mountains (Gutiérrez, 1997; Mihoci etal., 2011). However, the aspect of the mountain slopeis considered an important topographic factor (i.e.Bennie et al., 2008) and it could play a role in shapingbutterfly communities.The climate along the elevation gradient is knownto affect insect biology (Hodkinson, 2005) and ispredicted to produce the diversity pattern with mid–altitude peaks in temperate regions (Despland et al.,2012; McCain, 2007). Butterflies have shown thesame patterns of diversity changes in the mountains as other animal groups, and these changes arecommonly guided by variation in climate (MacNally etal., 2003; Gallou et al., 2017). Harsh conditions at ahigher elevation have prompted numerous ecologicaladaptations in butterflies (Junker et al., 2010; Kevanand Shorthouse, 1970; Leingärtner et al., 2014) and ithas been suggested that species communities at highelevations tend to show some evolutionary constraints(Pellissier et al., 2013). As the current global climatechange induces rapid shifts in butterfly communitiesacross continents (Devictor et al., 2012, Zografou etal., 2014), mountain systems have become increasingly important as refugia for species retractingpole–wards (Fleishman et al., 2000; Hampe and Petit,2005; Wilson et al., 2007). These rapid changes canbe traced by climate change indicators such as thecommunity temperature index (CTI) (Schweiger et al.,2014; Zografou et al., 2014). This index also allowsthe comparison of extant communities within altitudinalgradient or aspects, where CTI values are expectedto decline with altitude and on northern slopes.We compiled a check–list of butterfly species (Papilionoidea) and a large dataset of all records for theGaličica mountain range in the south–western part69of the Republic of Macedonia, combining data fromthe literature and the authors’ field observations. Themain goal of the study was to examine how butterflyspecies richness changes according to altitude andaspect of the mountain, which, in contrast to the nearby ranges, stretches in a north–south direction. Wetested the effect of the area, ecosystem productivityand mid–domain effect on elevational patterns ofspecies richness. In addition, we studied the similarities between butterfly communities and determinedwhether communities along the elevation gradient andaspect differed in community temperature indexes.We also provide notes on the potential extinction ofseveral butterfly species in the area and discuss theconservation value of this mountain range.Material and methodsStudy areaGaličica is a calcareous mountain range at the junctionof Macedonia, Albania and Greece and is sharedbetween the two first mentioned states (fig. 1). Itrises between the lakes of Prespa in the east andOhrid in the west. The climate is mild–continental andMediterranean, with climatic conditions stabilized bythe presence of large water bodies. The mountain issituated on an elevated plain, with the base at 695 mand reaching the altitude of 2,265 m (Avramoskiet al., 2010; Ćušterevska, 2016). It stretches in asouth–north direction; the east and west are therefore dominant aspects. In 1958 the Macedonian partof Galičica was proclaimed a National Park, with atotal area of 24,151 ha, and protected by the state(Matevski et al., 2011).Data collation and preparationA historical overview of butterfly fauna of Mt. Galičicawas summarized by Krpač et al. (2011). This publication was geo–referenced within Biologer.org biodiversity database (Popović et al., 2020) and used asa baseline for our study. Besides records from theliterature, we used an original dataset from Verovnik etal. (2010), unpublished data by I. Jugovic, A. Keymeulen, N. Micevski and the authors' personal records.Species observations of MP, RV and geo–referencedrecords from the literature can be downloaded afterregistration on Biologer.org or accessed through GBIF(Doi: 10.15470/jacl7y). Four major periods in butterflystudies can be recognized: i) an initial study in 1918; ii)short field surveys in the mid–19th century; iii) detailedinventory work in the seventies and eighties; and iv)intensive field studies by several experts from 1995onwards. A detailed checklist of recorded speciesis given in supplementary material, differentiatinghistorical (before 1995) and recent data.Compiling species observations from differentdatasets could produce bias in the data and shouldbe taken with caution. Thus, before proceeding to thestatistical analysis, species occurrence records weresubset to those with coordinate precision no less
Popović et al.70than 2 km. The unique combination of the speciesname, locality name and year was used to createsamples –lists of observed species– and was assumed to be equal to the list of species recorded at asingle sampling event. The incidence of frequency ofspecies was determined by combining the samplesfrom a certain elevation zone, or aspect. To removeaccidental individual observations, data were furthersubset to include only samples with more than fiveobserved species.Altitudes and aspects were extracted from a digital elevation model (European Environment Agency,2016), while all GIS calculations were made usingraster package in R (R Core Team, 2019). Altitude ateach point of observation was extracted and used todivide samples in n classes of equal length betweenmaximal and minimal altitude. Calculations weremade starting from n 20 and decreasing the valueuntil good estimates were obtained (i.e. low standarderrors, high sample coverage, and good representation of all classes). This resulted in 10 altitudinalclasses from 689 m to 2,234 m. Aspect values werecalculated in degrees and transformed to four majoraspects (cardinal directions): north (0º–45º) and315º–360º), east (45º–135º), south (135º–225º) andwest (225º–315º). To determine dominant mountainaspects for each sample, we included the area in aradius of 1 km around the observation point (i.e. notonly the aspect at the exact sampling location). Thejoint influence of several aspects was minimized byselecting samples with single aspects contributingmore than 50 %, and discarding data for sampleswith more uniform aspect contributions.Species richnessTo compare differences in species diversity betweenaltitudinal classes and aspects, we used speciesrichness measure as a representation of α diversity.Calculations were made using the iNEXT packagein R, allowing construction of both rarefaction andextrapolation curves; this provided a robust estimateof the true species diversity even in cases with lowand unequal sampling effort (Chao et al., 2014; Hsiehet al., 2016). Incidence frequencies prepared in theprevious step were used as input data and are available in supplementary material.The effect of an area on species richness wasassessed by plotting the available area in eachaltitudinal class or aspect versus estimated speciesrichness. The relationship between productivity andspecies richness was examined by plotting values ofnormalized difference vegetation index (NDVI) versusestimated species richness. NDVI was obtained fromMODIS (Didan, 2015) between April and September2017–2019 (representing the vegetation period forthe last three years). Average NDVI values were thencalculated for each altitudinal class and aspect. Sinceproductivity is directly related to climate, productivity–richness relationship could reflect the influenceof climate on butterflies along the altitudinal gradient(Levanoni et al., 2011; Pettorelli et al., 2005). Thepresence of mid–domain effect was checked byplotting 95 % CI of the null model (1,000 replicates)against observed species richness, using rangemodelR package in R (McCain, 2003; Colwell, 2008). Whereapplicable, statistical significance was checked usingSpearman correlation test in R.Changes in butterfly communitiesTo estimate the similarity between butterfly communities (β diversity) at different altitudes and aspects ofMt. Galičica, we used the probability version of theChao–Jaccard index, provided by CommEcol packagein R. This index is less biased than classic similarityindices and it is not sensitive to the omission of somespecies from the samples (Chao et al., 2005). Theresults are shown as unrooted dendrograms producedin ape package in R.In addition to providing the Chao–Jaccard estimate,we used the indicator value index to search for indicator species of a certain elevation zone and aspect(Cáceres and Legendre, 2009). Elevation zones weregrouped according to the estimates suggested byChao–Jaccard index in three elevation classes (low,mid and high altitudes). Estimates were obtained usingpackage indicspecies in R using IndVal.g estimatorwith 1,000 permutations.To test whether climate had any effects on shapingthe butterfly communities we calculated the communitytemperature index (CTI) for each delineated altitudinalclass and aspect of Mt. Galičica. CTI values werecalculated as an average of the species temperatureindex (STI), accounting also for butterfly abundance(Schweiger et al., 2014). If the climate affected thedistribution of butterflies in communities, it could beexpected that CTI would decline from the southern tothe northern aspect and from lower altitudes towardsthe top of the mountain. Differences were statisticallytested using ANOVA and pairwise t–test in R. Sincethe test could be affected by unequal sampling, different season, or year of observation, we used onlyour recent field observations that were collated withan even sampling effort and over the same period.ResultsA total of 4,137 occurrence records from Mt.Galičicawere collated, most of these (2,376) being newfield observations (see also the dataset publishedthrough GBIF (Doi: 10.15470/jacl7y). After removingduplicates and imprecise records, we retained 2,883observations for the analysis. A total of 168 specieswere recorded for Mt. Galičica, 159 of which wereknown before 1995, while 145 were confirmed in recent studies (supplementary material). The decline inspecies was also evident from an estimated 152 15species before 1995 to an estimated 143 3 speciesin the recent period (sample coverage 0.90 and 0.99respectively). Compared to the overview by Krpač etal. (2011), three species were recorded for the firsttime: Colias caucasica Staudinger, 1871 (alreadynoted by Verovnik et al., 2010), Satyrium pruni (Linnaeus, 1758) and Melitaea ornata Christoph, 1893.
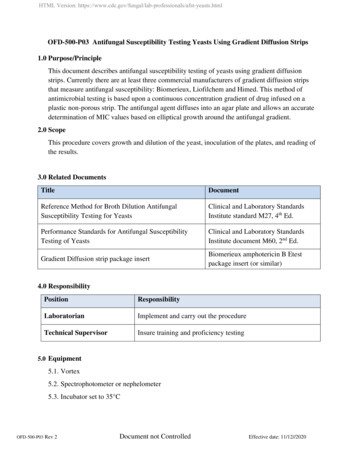
Animal Biodiversity and Conservation 44.1 (2021)Republic ofMacedonia71Country bordersNational ParkSamplinglocationsLakesRiversAltitudinal 2,234Albania0510 kmGreeceFig. 1. Galičica mountain range in the Republic of Macedonia shown on a relief map, with altitudescorresponding to the altitudinal classes given in the manuscript. Blue indicates the lakes of Ohrid (to thewest) and Prespa (to the east). All butterfly sampling locations are shown as white circles.Fig. 1. Mapa de relieve en el que se muestra la cadena montañosa Galičica en la República de Macedonia, con altitudes que se corresponden con las clases de altitud que figuran en el manuscrito. El colorazul indica los lagos de Ohrid (al oeste) y Prespa (al este). Todos los sitios de muestreo de mariposas seindican con círculos blancos.Species richness indicesEstimated sample coverage for the iNEXT analysisranged from 0.69 to 0.97 for altitudinal classes andfrom 0.61 to 0.98 for aspects, with the lowest estimatebeing for the southern aspect (supplementary material).Butterfly species richness on Mt. Galičica showed abimodal distribution along the altitudinal span, withpeaks at about 1,100 m and 1,500 m, and a declining trend towards the higher elevations (fig. 2A). Weobserved a strong correlation between the size of thearea available in each altitudinal zone and estimatedspecies richness (fig. 2A); this relation was statisticallysignificant (rho 0.81, S 32, P 0.008). A comparisonof species diversity among different aspects of the mountain showed a more uniform pattern, with somewhatlower estimates for species richness on the northernand eastern slopes and higher richness estimates forthe southern and the western slopes (fig. 2B). Thecorrelation between estimated species richness andthe area available in different aspects of the mountainwas not significant (rho –0.20, S 12, P 0.917).Most of the area of the mountain comprises westernand eastern slopes due to the mountain predominantsouth–north direction (fig. 1, 2B). However, it should benoted that observed and estimated species richnessshowed a large discrepancy for the southern aspect,while large standard errors and small sample coverageindicate imprecise calculations.We were unable to determine a clear correlationbetween ecosystem productivity and butterfly speciesrichness along the altitude, although estimates wereclose to significant (rho 0.60, S 66, P 0.073)and some positive relation is clearly visible in thegraph (fig. 2C). The highest discrepancies were nearthe second peak in species richness (fig. 2C). NDVItended to increase to about 1,000 meters, then slowlydecline towards the highest altitudes. In contrast,the NDVI index showed a similar distribution alongthe mountain aspects, with somewhat lower values
Popović et al.72CEstimatedObserved1501004,000502,000a b c d e f g h i jAltitudinal classes(ranges in 00North08,0006,000Mountain aspectDMean NDVISpecies richness2005,0000Available area(km2)5,000a b c d e f g h i jAltitudinal classes(ranges in m)35,000North050Mean h85,000Species richnessEstimatedObservedSpecies richness200Available area(km2)Species richnessA B0Mountain effect (95 % CI)Species richnessE150150100100505000a b c d e f g h i jAltitudinal classes(ranges in m)Fig. 2. The relationship between species richness at different altitudes and aspects of Mt. Galičica andseveral predictor variables. Upper graphs show the comparison of available area (histogram) and speciesrichness (lines) for each altitudinal class (A) and aspect (B). The middle graphs depict a similar comparisonfor productivity (histogram of mean NDVI values) and species richness (lines) between altitudinal class(C) and aspect (D). The lower graph (E) shows the 95 % confidence interval for the null model prediction(blue area) constructed to test the mid–domain effect. Estimated values of species richness are shownas diamonds with lower and upper confidence intervals. Observed species richness values are indicatedby circles. Altitudinal classes: a, 689–844; b, 844–998; c, 998–1,152; d, 1,152–1,307; e, 1,307–1,462; f,1,462–1,616; g, 1,616–1,770; h, 1,770–1,925; i, 1,925–2,080; j, 2,080–2,234.Fig. 2. La relación entre la riqueza de especies en diferentes altitudes y orientaciones de la montaña Galičicay varias variables predictivas. En los gráficos superiores se muestra la comparación de la superficie disponible(histograma) y la riqueza de especies (líneas) de cada clase de altitud (A) y orientación (B). En los gráficoscentrales se muestra una comparación parecida entre la productividad (histograma de los valores mediosdel índice normalizado diferencial de la vegetación) y la riqueza de especies (líneas) entre clases de altitudC) y orientación (D). En el gráfico inferior (E) se muestra el intervalo de confianza del 95 % para la predicción del modelo nulo (superficie azul) elaborada para comprobar el efecto del dominio medio. Los valoresestimados de la riqueza de especies se señalan con rombos con los límites inferior y superior del intervalode confianza. Los valores de la riqueza de especies observada se indican con círculos. Altitudinal classes:a, 689–844; b, 844–998; c, 998–1,152; d, 1,152–1,307; e, 1,307–1,462; f, 1,462–1,616; g, 1,616–1,770; h,1,770–1,925; i, 1,925–2,080; j, 2,080–2,234.
Animal Biodiversity and Conservation 44.1 010CTICTI14866abc d e f g h iAltitudinal classes(ranges in uth1307–1462Mountain aspectFig. 3. A, cluster dendrogram constructed from Chao–Jaccard dissimilarity index of β diversity amongbutterfly communities at different altitudinal zones; B, mountain aspects; C, box–plots showing meanvalues for the community temperature index (CTI) of butterfly assemblages along elevation gradient; andD, box–plots showing butterfly assemblages at different aspects of Mt. Galičica. Detailed statistics withresults of pairwise comparison in CTI values are given in supplementary material. For abbreviations ofaltitudinal classes see fig. 2.Fig. 3. A, dendrograma de grupos elaborado a partir del índice de similitud de Chao–Jaccard de la diversidad β entre las comunidades de mariposas de diferentes zonas de altitud; B, orientaciones de la montaña;C, diagramas de caja en los que se muestran los valores medios del índice de temperatura comunitariade los ensamblajes de mariposas a lo largo del gradiente de altitud, D, diagramas de caja en los que semuestran los ensamblajes de mariposas en las distintas orientaciones de la montaña Galičica. En materialsuplementatario se proporcionan estadísticas detalladas con resultados de la comparación por pares devalores del índice de temperatura comunitaria. Para las abreviaturas de las clases de altitud, véase la fig. 2.on the warmer mountain slopes (fig. 2D); this couldnot be correlated with estimated species richness(rho –0.80, S 18, P 0.333). We found no strongevidence for mid–domain effect on species richnessas most points fell outside the confidence intervalpredicted by the null model (fig. 2E).Changes in species communitiesThe Chao–Jaccard dissimilarity index was generallyhigher for communities at more distant altitudinal levels,with values ranging from 0.15 to 0.7 (more detailsavailable in supplementary material). Communities atthe highest altitudes were clearly the most distinctive,but those at mid–elevations also tended to form aseparate group in the dendrogram (fig. 3A). Communities on different aspects showed lower differentiationwith a dissimilarity index ranging from 0.1 to 0.36(supplementary material). Eastern and western aspectshosted practically the same communities, while somedifferences were evident for northern and especiallysouthern aspects (fig. 3B).The indicator value index was computed for 127and 75 species along the altitude and aspect, respectively. Indicator species were found in the mid–altitudezone and for the combination of low–mid and mid–highzones (table 1), while no indicator species were foundfor the mountain aspects.
Popović et al.74Table 1. Indicator species for three altitudinal zones of Mt. Galičica. Altitudinal zones were delineatedusing the values of the Chao–Jaccard estimate (fig. 3) to three zones: low elevation (689–1,462 m),mid elevation (1,462–1,770 m) and high elevation (1,770–2,234 m). Only statistically significant indicatorspecies are listed.Tabla 1. Especies indicadoras de tres zonas de altitud de la montaña Galičica. Utilizando los valores de laestimación de Chao–Jaccard (fig. 3) se definieron tres zonas según la altitud: altitud baja (689–1.462 m),altitud media (1.462–1.770 m) y altitud alta (1.770–2.234 m). Solo se muestran las especies indicadorasestadísticamente significativas.Mid elevation zone (15 species)Mid and low elevation (18 species)Parnassius apolloIphiclides podaliriusPyrgus alveusPyrgus cinaraeCarcharodus flocciferaThymelicus lineolaHesperia commaPieris balcanaHamearis lucinaPieris erganeFavonius quercusLeptidea sinapisLycaena thersamonLycaena phlaeasPlebejus argyrognomonPlebejus argusBrenthis hecateAricia agestisKirinia climenePolyommatus admetusLasiommata petropolitanaLysandra bellargusHyponephele lycaonArgynnis paphiaHyponephele lupinaIssoria lathoniaSatyrus ferulaPolygonia c–albumPseudochazara geyeriCoenonympha pamphilusMid and high elevation (5 species)Maniola jurtinaParnassius mnemosyneMelanargia galatheaLycaena candensBrintesia circePolyommatus erosBoloria graecaMelanargia russiaeThe community temperature index (CTI) valuesdiffered significantly between altitudinal zones(F 4.904, df 9, P 0.001) and also betweendifferent aspects (F 3.558, df 3, P 0.014). Adeclining trend was visible in average CTI valuestowards the higher altitudes, although the zonearound the mid–elevations deviated from the lineardecline pattern (fig. 3C). Statistical significance inpairwise comparisons between altitudinal zones wasobserved only for more distant altitudinal classes,with and the first two altitudinal zones accounting formost of this significance (details in supplementarymaterial).However, the comparison of communitiesat different mountain aspects showed more uniformdistribution of CTI (fig. 3D), and only the values onthe northern aspect were significantly lower (supplementary material).DiscussionButterfly diversity and its potential declineDespite the relatively small area studied, butterflyfauna of Mt. Galičica in the Republic of Macedoniais extremely rich, with 168 species recorded. This iscomparable to other high biodiversity mountain regionsin the Balkan Peninsula, such as Stara Planina inSerbia with 167 species (Langourov, 2019; Popovićand Đurić, 2014), Stara Planina in Bulgaria with184species (Kolev, pers. comm.), Shar Planina with 169species (Jakšić, 1998; Melovski, 2003), Mt. Olympuswith 155 species (Pamperis, 2009), Vitosha with 155(Beshkov, 2014), Rila with 174, and Pirin with 195(Kolev, pers. comm.). In addition to high butterflydiversity, Galičica is an important area for butterfly
Animal Biodiversity and Conservation 44.1 (2021)conservation due to the presence of one threatened(Phengaris arion) and 17 near–threatened speciesat the continental level (van Swaay et al., 2010), and21 threatened species at a national level (Krpač andDacremont, 2012). This mountain has also been recognized as a prime butterfly area in Europe (Jakšić,2003).The absence of new records for as many as 23 species together with a lower estimated number of speciesin the recent period is noteworthy, however, and mightindicate true extinctions of several taxa. The majorityof potentially extinct species include habitat specialists, such as Anthocharis damone, Euchloe penia,Tarucus balkanicus, Pseudochazara amalthea andSpialia phlomidis that were known only from the openrocky habitats, once abundant above Ohrid town. Thisarea in particular (authors pers. observ.) and the entiremountain is becoming overgrown due to abandonment of pasturing, with forest cover increasing on Mt.Galičica from 40 % to 58 %, and pastures declining from50 % to 24 % in the last decades (Despodovska et al.,2012). Similar patterns have been found throughoutMediterranean Europe, with open grassland butterfliesdeclining due to increased forest cover (Slancarova etal., 2016; Ubach et al., 2020). The lack of new recordsfor woodland species such as Limenitis camilla, Neptisrivularis and Erebia ligea is difficult to explain giventhe increased forest cover. However, these butterfliesare linked to more humid habitats, and recent changes in climate –with prolonged droughts and higheraridity– could cause their decline. The same could betrue for the extinction of Erebia oeme, one of sevenhigh alpine species (Varga and Varga–Sipos, 2001)recorded for Mt. Galičica.Species richness patternThe estimated richness of butterfly species on theelevation gradient of Galičica Mt. sh
Effects of elevation gradient and aspect on butterfly diversity on Galičica Mountain in the Republic of Macedo-nia (south-eastern Europe). The patterns of butterfly diversity and community changes in relation to elevation are an interesting and well-covered topic in ecology, but the effects of aspect have rarely been evaluated.