Transcription
Report # UNL-MST: 442 Final Report25-1121-0001-442LED Traffic Signal Replacement Schedules:Facilitating Smooth Freight FlowsSuzanna Long, Ph.D.Assistant ProfessorEngineering Management and Systems EngineeringMissouri University of Science and TechnologyRuwen Qin, Ph.D.Abhijit Gosavi, Ph.D.C.H. Wu, Ph.D.Tom Ryan, P.E.Casey Noll2012A Cooperative Research Project sponsored by theU.S. Department of Transportation Research andInnovative Technology AdministrationThe contents of this report reflect the views of the authors, who are responsible for the facts and the accuracy of theinformation presented herein. This document is disseminated under the sponsorship of the Department of TransportationUniversity Transportation Centers Program, in the interest of information exchange.The U.S. Government assumes no liability for the contents or use thereof.
LED Traffic Signal Replacement Schedules: Facilitating Smooth Freight FlowsSuzanna Long, Ph.D.Assistant ProfessorEngineering Management and Systems EngineeringMissouri University of Science and TechnologyRuwen Qin, Ph.D.Assistant ProfessorEngineering Management and Systems EngineeringMissouri University of Science and TechnologyAbhijit Gosavi, Ph.D.Assistant ProfessorEngineering Management and Systems EngineeringMissouri University of Science and TechnologyC.H. Wu, Ph.D.ProfessorEngineering Management and Systems EngineeringMissouri University of Science and TechnologyTom Ryan, PEEngineering Management and Systems EngineeringMissouri University of Science and TechnologyCasey NollGraduate ResearcherEngineering Management and Systems EngineeringMissouri University of Science and TechnologyA Report on Research Sponsored byMid-America Transportation CenterUniversity of Nebraska-LincolnNovember 2011
Technical Report Documentation Page1. Report No. 25-1121-0001-4422. Government Accession No.3. Recipient's Catalog No.4. Title and SubtitleLED Traffic Signal Replacement Schedules: Facilitating Smooth Freight Flows5. Report DateNovember 20116. Performing Organization Code7. Author(s)Suzanna Long, Ruwen Qin, Abhijit Gosavi, C.H. Wu, Tom Ryan, and Casey Noll8. Performing Organization Report No.25-1121-0001-44210. Work Unit No.9. Performing Organization Name and AddressMid-America Transportation Center2200 Vine St.PO Box 68583-0851Lincoln, NE 68583-085111. Contract or Grant No.12. Sponsoring Agency Name and AddressResearch and Innovative Technology Administration1200 New Jersey Ave. SEWashington, D.C. 2059013. Type of Report and Period CoveredFinal Report14. Sponsoring Agency CodeMATC TRB RiP No. 2403515. Supplementary Notes16. AbstractThis research details a field study of LED traffic signals in Missouri and develops a replacement schedule based on key findings.Rates of degradation were statistically analyzed using Analysis of Variance (ANOVA). Results of this research will provide amethodology for engineering managers in state departments of transportation and local communities in identifying best practicesand replacement standards for LED traffic signal technology. These findings will facilitate smooth freight flows through the useof more efficient technologies.17. Key WordsLight-emitting diode (LED), traffic signal, sustainability,replacement schedules, life expectancy19. Security Classification (of this report)Unclassified18. Distribution StatementNo restrictions20. Security Classification (of this page)Unclassifiedii21. No. of Pages8422. Price
Table of ContentsDisclaimerExecutive SummaryAbstractChapter 1 Introduction1.1 Sustainable Advantages of LEDs1.2 ITE Standards1.3 Problems Associated with LEDs: 2007 ITE Survey1.4 Current Replacement and Monitoring PracticesChapter 2 ObjectivesChapter 3 Project Management ApproachChapter 4 Data Collection and Analysis4.1 Field Testing4.2 Data Collection ConstraintsChapter 5 Development of Models for Measuring Useful Life of LED Lights5.1 Descriptive Statistics5.2 Identification of Factors that Impact Degradation Patterns5.3 Potential Degradation Patterns6.2 Data Screening Constraints6.4 Findings6.5 Summary of Replacement Schedule ConstraintsChapter 7 Conclusions7.1 Replacement7.2 GeneralChapter 8 Recommendations and Implementation PlanChapter 9 Principle Investigator and Project MembersReferencesAppendix AAppendix BAppendix CAppendix DAppendix 53545758697275
List of FiguresFigure 1.1 Sustainable benefit of LEDsFigure 1.2 ITE minimum luminous intensities (cd)Figure 1.2 Current replacement approachesFigure 3.1 An overview of the task performed in the projectFigure 4.1 Field data collection processFigure 4.2 Inverse square law for converting readings from illuminance (lux) toluminanceFigure 4.3 Equation for calculating the rate of degradationFigure 5.1 Distribution of LED traffic signals by manufacturers(further split by indicator type)Figure 5.2 Distribution of LED traffic signals by indicator type(further split by manufacturers)Figure 5.3 Distribution of LED traffic signals over agesFigure 5.4 Luminous intensity vs. age for all LEDsFigure 5.5 Average luminous intensity vs. ageFigure 5.6 Average luminous intensity vs. age (split by indicator)Figure 5.7 Luminous intensity vs. age (circular green)Figure 5.8 Luminous intensity vs. age (circular red)Figure 5.9 Luminous intensity vs. age (circular yellow)Figure 5.10 Luminous intensity vs. age (green arrow)Figure 5.11 Luminous intensity vs. age (yellow arrow)Figure 5.12 Average luminous intensity vs. age (split by indictor)Figure 5.13 Luminous intensity vs. age (Dialight)Figure 5.14 Luminous intensity vs. age (GE)Figure 5.15 Luminous intensity vs. age (LTEK)Figure 5.16 Average luminous intensity vs. age for Dialight(split by indicator)Figure 5.17 Average luminous intensity vs. age for GE(split by indicator)Figure 5.18 Average luminous intensity vs. Age for LTEK(split by indicator)Figure 5.19 Average luminous intensity vs. age for circular green(split by manufacturer)Figure 5.20 Average luminous intensity vs. age for circular red(split by manufacturer)Figure 5.21 Average luminous intensity vs. age for circular yellow(split by manufacturer)Figure 5.22 Average luminous intensity vs. age for green arrow(split by manufacturer)Figure 5.23 Average luminous intensity vs. age for yellow arrow(split by 3132323334353637383940
List of TablesTable 4.1 A sample data collection table for luminous intensity of agiven type of LEDTable 5.1 Distribution of LED traffic signals over manufacturers and indicatorsTable 5.2 Distribution of LED indicators over manufacturers, indicators,and agesTable 6.1 Regression equationsTable 6.2 Age of recommended replacement for all LEDsignal head typesTable 6.3 Replacement schedule for GETable 6.4 Replacement schedule for Dialightv16202444454545
List of AbbreviationsAnalysis of Variance (ANOVA)Approved Products List (APL)Federal Highway Administration (FHWA)Institute of Transportation Engineers (ITE)Life Cycle Cost Analysis (LCCA)Light Emitting Diode (LED)Local Technical Assistance Program (LTAP)Luminous Intensity (LI)Manual on Uniform Traffic Control Devices (MUTCD)Mid-America Transportation Center (MATC)Missouri Department of Transportation (MoDOT)Nebraska Transportation Center (NTC)New York State Department of Transportation (NYSDOT)New York State Energy Research and Development Authority (NYSERDA)Transportation Management System (TMS)Vehicle Traffic Control Signal Heads – Light Emitting Diode Circular SignalSupplement (VTCSH-LED)vi
DisclaimerThe opinions, findings, and conclusions expressed in this publication are those of theprincipal investigators. They are not necessarily those of the University of Nebraska LincolnMid-America Transportation Center, the Missouri Department of Transportation, the U.S.Department of Transportation or the Federal Highway Administration. This report does notconstitute a standard or regulation.vii
AbstractThis research details a field study of LED traffic signals in Missouri and develops areplacement schedule based on key findings. Rates of degradation were statistically analyzedusing Analysis of Variance (ANOVA). Results of this research will provide a methodology forengineering managers in state departments of transportation and local communities in identifyingbest practices and replacement standards for LED traffic signal technology. These findings willfacilitate smooth freight flows through the use of more efficient technologies.viii
Executive SummaryThe goals of this study are to provide a repeatable methodology that can be used by theMissouri Department of Transportation (MoDOT) and other DOTs to evaluate the lifeexpectancy of LEDs based on the realities of traffic flow, intersection geometrics in Missouri,and the basic science of LED components, and to provide guidelines for cost-effectivereplacement plans based on these findings. This study uses a combination of field testing andstatistical analysis. Specifically, the project includes an evaluation of the impact of manufacturer,indicator type, color, and directional view variables on the degradation of LED traffic signals. Acomprehensive LED replacement plan is developed based on the collected data.Previous studies have measured intensity readings for individual signal heads only bycolor, rather than by color, age, and manufacturer. In addition, these studies took readings eitherin a laboratory setting or at the signal head. The results from previous studies also failed todetermine detailed replacement guidelines that include recommendations based on signal headintensity and ITE threshold compliance from the driver’s perspective; differences by color,indicator type, and manufacturer; and economic cost-benefit analysis of replacement ofindividual signal sections versus entire heads. Typically these studies recommended genericreplacement schedules based largely on manufacturer warranty, typically five years plus one.Our findings support the economic value of LED traffic signals over traditionalincandescent bulbs and suggest that LED lighting should be evaluated for other applications,including roadway luminaires, parking area lighting, and facilities lighting.Our findings do not recommend any one manufacturer over another. Cross-sectionalresults suggest that useful life of LED traffic signals meets or exceeds useful life warrantyexpectations for most indicator types and manufacturers. Pending longitudinal evaluation, weix
recommend an implementation strategy that replaces circular green and green arrow indicators atapproximately eight years of age. Preliminary results suggest that circular red indicators hoverbelow the Institute of Transportation Engineers (ITE) threshold for a lengthy period following arapid drop-off after installation. Based on limitedly observed degradation patterns, we suggestthat circular red signal indicators should be evaluated when circular green and green arrowindicators are replaced. If the luminous intensity continues to hover near the ITE threshold, wesuggest replacement at the ten year mark. If the intensity reading is significantly below the ITEthreshold, circular red signal indicators should be replaced at the same time as circular green andgreen arrow signal indicators. Our concerns over the intensity of circular yellow indicatorsprevent us from making any recommendation; however, our findings support a replacement planof six years for yellow arrow indicators.Two separate clusters emergent from the collected data (see figures 5.4 and 5.5, mainreport) raise questions as to why a second group of older LED signals has unusually highluminous intensity values. A shift in manufacturing design may be one possible explanation. Ourresults suggest that the older design degrades more slowly. This should be confirmed throughadditional longitudinal laboratory and field analyses.Additionally, our study results strongly indicate the need for additional laboratory andfield study of circular yellow LEDs. The 2005 ITE Vehicle Traffic Control Signal HeadsSupplement guidelines specify that circular yellow actually maintain the highest luminousintensity at a red to yellow to green ratio of (1: 2.5: 1.3). This was not observed during our studyin either the laboratory or in the field. See Appendix B.1 for more detail.Lastly, there is evidence that circular red Dialights degrade to the ITE minimumthresholds rather rapidly. As seen from table B.1, main report, a new circular red Dialightx
provided for laboratory study was only slightly above the ITE threshold. Furthermore, figure5.20, main report shows that the average light intensity value for all age groups of circular redDialights were also below the ITE minimum thresholds. This product should be subjected tofurther laboratory and field analysis. No standard intersection management database currentlyexists at MoDOT or most other state DOTs based on the literature. Determining dates ofmanufacture, purchase and installation, all of which are important pieces of information, wasoften time- and labor-intensive duties required by MoDOT personnel on top of regularresponsibilities. We strongly recommend the creation of a comprehensive intersection databaseto promote greater ease of tracking and replacement of LED traffic signals.xi
Chapter 1 IntroductionOver the last two decades light-emitting diodes (LEDs) have replaced incandescent bulbsin traffic signals because of their energy savings and much longer service life (Urbanik 2008).Departments of transportation (DOTs) have gained sufficient experience with converting trafficsignal indication, however, much of the initial phasing out of incandescent bulbs is complete andmany of the first installments of LEDs now need replacement. The standard practices ofmaintaining and replacing incandescent lamps cannot be simply transferred and applied to LEDsignals. Engineering managers have to deal with the differences in long term performancebetween the two technologies and develop new practices that reflect these differences. There isstill much uncertainty related to the monitoring, maintenance and replacement of LEDs over thecourse of their useful life (Urbanik 2008). DOTs have a need for sustainable replacementstrategies, but lack a comprehensive understanding of LEDs from an economic, performance andsafety perspective.The problem is severe enough that in 2006 the Institute of Transportation Engineers(ITE) International Board of Direction decided that the lack of knowledge revolving aroundmaintenance and replacement of LEDs warranted the creation of a special task force to addressthe issue (Behura 2007). To ensure that LEDs aren’t left in the field with light output below therecommended values, DOTs are still searching for a reliable method to monitor the light outputof LEDs which degrade over time. Determining when an LED signal has reached the end of itsuseful life is not as clear-cut as it was in the past with incandescent bulbs and new evaluationmethods must be created. Whereas incandescent bulbs simply burned out instantly upon failure,LED light output slowly degrades over their five to ten year life cycle. By definition, they reachtheir end of life when they output an insufficient amount of light as detected by a driver. The1
ITE provides standards on minimum light output and light distribution and measures thisminimum threshold in candelas (cd). Agencies use the ITE specifications as standards; howeverthey still experience difficulty effectively monitoring the vast amount of LED signals under theircontrol.With the absence of national standards regarding maintenance for LEDs, transportationagencies are on their own in evaluating the useful life of the LEDs in their traffic signals anddetermining when they need replacement. This is a costly process that can have large effects ontheir budgets (Bullough 2009). Many agencies already have scarce funding for citywidereplacement or maintenance programs (Behura 2007) and the recent economic downturn onlyworsens the budget situation.The large differences between the two signal light technologies, the money concerns andthe safety risk clearly show a need for a sustainable, systematic replacement schedule. Withcurrent practices, LEDs are often left in use beyond their end of life. When this happens they arefunctioning, but emit light output levels lower than established standards. Engineering managersneed a reliable method of monitoring light output levels to better predict failed light outputlevels.In the 1990’s LEDs showed the ability to provide huge energy savings for agenciesbecause they consumed a lot less power (watts). As a result, agencies began replacing indicatorscontaining older bulb technology (Urbanik 2008). Early LEDs cost several hundred dollarsversus only a few dollars for an incandescent bulb, but their longer expected life and provenenergy saving capabilities suggested that they could still yield lower total life cycle costs.Agencies began evaluation programs where intersections were outfitted with LEDs and studied.Early life cycle analyses showed that, despite the huge upfront equipment costs of LEDs, their2
benefits still led to lower life cycle costs. MoDOT conducted their own Life Cycle CostAnalysis (LCCA) when they first experimented with installing LED signals at a state intersectionand had similar findings. They experienced a 75% energy reduction and 90% maintenance costreduction which led to a lower total life cycle cost, despite the high costs of LEDs in 1999.MoDOT noted that the life cycle costs of LEDs would continue to decrease as LED prices arereduced (Careaga and Allen 2000). Over the last decade, prices have indeed decreasedsignificantly making LEDs an even clearer choice.Further speeding the transition was the Energy Policy Act of 2005. Title I, Subtitle C,Section 135 mandates that any traffic signal module or pedestrian module manufactured afterJanuary 1, 2006 meet the ENERGY STAR energy-efficiency specifications (U.S. Congress,2005). The U.S. Environmental Protection Agency’s ENERGY STAR program sets caps on themaximum amount of wattage a module can consume (ENERGY STAR 2003). This combinationof legislation effectively mandated the use of LEDs in all new installations.1.1 Sustainable Advantages of LEDsToday, LEDs are clearly the superior choice. They use less energy, have longer lifeexpectancies, require less maintenance and have an overall cheaper life-cycle cost. From anenergy conservation perspective, LEDs consume far less power. The national average for energysavings is about 85%. Life expectancies are a little less clear because there is a differencebetween rated life and actual life. Manufacturers rate the average life of LED at 100,000 hours,however this is for a single LED under laboratory conditions, whereas traffic signals containseveral hundred LEDs in a system and operate outdoors in harsher environments (Hong andNarendran 2004). These two differences are why the actual life of a LED is actually lower thanits rated life. Despite this reduction when compared to the mere 8,000 hours that incandescent3
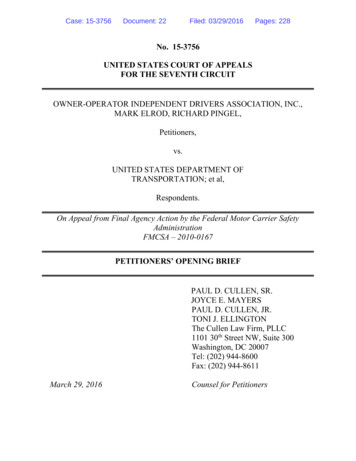
bulbs are rated at (Urbanik 2008), the advantage in useful life is still clear. In practice, LEDs lastanywhere from five to 10 years, however in the past, MoDOT replaced incandescent bulbstypically every 1 to 1.5 years (Careaga and Allen 2000). The benefit of such a longer lifeexpectancy is that maintenance crews have to visit intersections less frequently to replace theindicators. Each time a bulb has to be replaced, a two-man maintenance crew must travel to theintersection, set up temporary traffic control and get on a lift to physically change the bulb. Thelabor cost from frequent visits notably increases the overall lifecycle costs while simultaneouslyendangering workers, wasting time and fuel for both maintenance workers and the travelingpublic (additional discussion of operations and maintenance cost-benefit analysis can be found inappendix E).85% energyreduction5-10 year lifeexpectancyLessmaintenanceCheaper lifecycle costFigure 1.1 Sustainable benefit of LEDs1.2 ITE StandardsThe ITE sets minimum standards for LED modules manufacturers (Behura 2005). Thesestandards were updated for circular LEDs when the Vehicle Traffic Control Signal Heads – LightEmitting Diode Circular Signal Supplement (VTCSH-LED) was published by the ITE in 2005(Institute of Transportation Engineers 2005). This supplement has been adopted into the FederalHighway Administration’s (FHWA) Manual on Uniform Traffic Control Devices (MUTCD). In2007, the ITE published an additional supplement for arrow indicators (Institute of4
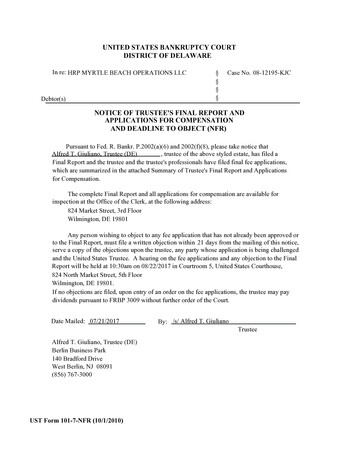
Transportation Engineers 2007), and a third supplement in 2009 for pedestrian countdownsignals.The VTCSH-LED sets standards in several areas. The subjects of light intensity andwarranty are of particular interest for the present research. The VTCSH-LED supplementrewrote the rules on luminous intensity that formerly applied to incandescent bulbs dating backto 1933 (Behura 2005). The supplement reinforces the need for new LED monitoring andreplacement practices. It requires that 8” (200mm) and 12” (300mm) modules meet theminimum luminous intensities shown in figure 1.2 (Institute of Transportation Engineers 2005).These minimum values uphold a new ratio of red, yellow and green (R:Y:G) to 1 : 2.5 : 1.3. Thevalues most commonly seen in the literature and on LED signal manufacturers’ websites arethose for a vertical angle of -2.5 degrees and a horizontal angle of zero degrees. This is likely dueto most measurements being taken in a lab, directly in front of the LED. All LEDs included inour study were 12” modules, and measurements were taken in the field from a driver’sperspective; therefore, the most commonly used minimum thresholds were not utilized. Theaverage angle for all readings taken during this study was 10 degrees below the vertical; thus, thevalues shown in figure 1.2 were chosen for analysis.5
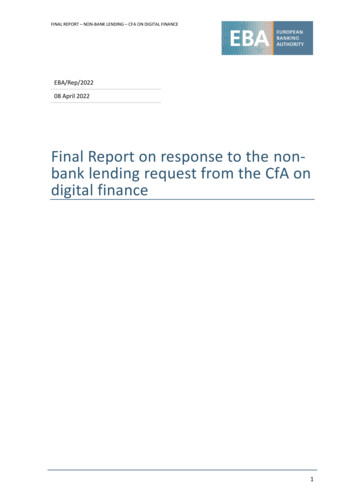
Vertical Angle:HorizontalAngle:Signal Size:Circular RedCircular YellowCircular GreenYellow ArrowGreen Arrow-2.5 degrees0 -10degrees0 degrees12"(300mm)1974912577941Figure 1.2 ITE Minimum luminous intensities (cd)The new ITE supplement sets standards requiring manufacturers to warrant their modulesfor at least five years, meaning manufacturers must repair or replace any indicators for whichminimum luminous output levels fall below the ITE threshold (Institute of TransportationEngineers 2005).1.3 Problems Associated with LEDs: 2007 ITE SurveyAfter the ITE International Board of Direction created a task force to address the issue ofLED maintenance and replacement, the ITE developed a (2007) survey directed toward groupsinvolved with the manufacture, sales, use, and maintenance of LEDs (Behura 2007). In total, 76traffic agencies and six traffic signal vendors/manufacturers responded to the survey, revealingthe following: 60% have no monitoring/replacement procedure Half use the ITE specification and half use no specification for minimum light output. Replacement approach 35 % : no replacement approach 35 %: complaint drive 24 %: routine, scheduled replacement6
3 %: replace on vendor product life cycle 3 %: based on in-service test results Of those that use a scheduled replacement approach: 38% - five years 10% - six years 52% - Greater than six years 73% use a five-year warranty period (Behura 2007)As Behura (2007) points out, the ITE survey illustrates several key problems, whichmotivate the current research. As a whole, current practices of LED monitoring and replacementare inadequate. Figure 1.3 shows that 70% of those surveyed either have no replacement plan orwait until they receive a complaint before replacing an LED indicator. Guidelines formonitoring and replacement would be beneficial; however, agencies lack the funding and/orresources to address these issues in order to ensure high levels of visibility. Although 82% ofagencies indicated that they use ITE LED specifications, it is obvious that these standards serveno purpose if 60% lack a monitoring program to check light output levels.Replacement ApproachNo Replacement Program3% 3%35%24%Complaint DrivenRoutine, scheduled replacementreplace on vendor product life cycle35%based on in-service test resultsFigure 1.3 Current replacement approaches7
1.4 Current Replacement and Monitoring PracticesAn agency currently has two options for choosing a replacement strategy: either replaceindividual LEDs as they fall below the minimum threshold one at a time, or, segment the signalsinto groups, either by intersection or signal indication, and replace entire groups at a time.These basic strategies imply that an agency either executes the replacement at a pre-definedinterval (usually based on vendor warranty), or only after they receive a complaint. Withoutguidelines based on the realities of long-term LED performance, agencies that practice scheduledreplacement often use the manufacturer’s warranty as the interval rate. Doing so keeps liabilityin the hands of the manufacturer, but is not cost-efficient. Behura (2007) points out that, whilewarranties range from four to seven years with an average of five, LEDs may last two years ormore beyond this estimate, as manufacturers err on the side of caution to avoid costlyreplacements and potential risk.Replacement periods based on a manufacturer’s warranty are a safe bet, but a trulysustainable solution for DOTs would be to seek to extend the use of an LED past the warrantyperiod whenever possible. The only way to safely accomplish this objective is through statisticalunderstanding of LED life based on actual degradation rates and performance.To date, several studies and analyses have attempted to determine best practices for replacingLEDs. Bullough (2009) compared the life cycle costs of spot replacement versus groupreplacement plans, finding in most scenarios that group replacement has a greater cost benefit;however, these results relied heavily on an estimation of useful life and expected failure rates.Although LEDs degrade gradually over time, a limited amount of spot replacements willinevitably be needed even when a group replacement plan has been adopted. Bullough (2009)recommends testing LEDs in the laboratory after the decision has been made to replace them,8
then setting aside a small percentage of the LEDs that have the greatest remaining useful life.These partially used but not dead LEDs could be used as a stockpile for spot replacing otherLEDs that fail before the scheduled replacement period. This simple addition to any replacementstrategy would help reduce LED signal purchases.In brief, the basis of any monitoring program involves inspecting LED modules either inthe field, or in the lab. While Behura (2007) notes that laboratory measurement can provide themost accurate readings, common sense dictates that large quantities of LEDs cannot be activelymonitored using this method. A lab measurement requires removal of the LED module from theroad, whereas field testing inspects active LEDs on the road. Maintaining a database thatcontains all relevant information on each module, such as intersection, pole location, headnumber, color, type, manufacturer, date of installation, and warranty, is recommended foragencies due to the fact that they monitor large quantities of LEDs (Behura 2007).The New York State Department of Transportation (NYSDOT) performed fieldmeasurements with a portable luminance meter on an intersection recently converted to LEDs,finding this method to be a successful means of spot checking signal performance for ITEcompliance (New York State Energy Research and Development Authority [NYSERDA] 2001).These field readings were taken at different angles from the vertical angle. And since, for safetyreasons, they were taken from sidewalks and traffic islands, they do not portray an accurateestimation from the driver’s point of view, because they are not at a horizontal angle or zerodegrees. Additionally, no known attempts have been made to use field testing as a means ofinterpolating the rate of LED degradation.Although monitoring and replacement strategies currently do exist, there is still nowidespread method that incorporates actual degradation rates. A monitoring program that seeks9
to understand this degradation rate could provide accurate estimations of useful life that wouldaid in developing sustainable LED replacement strategies.10
Chapter 2 ObjectivesThis study provides a repeatable methodology for use by the Missouri Department ofTransportation (MoDOT) and other DOTs for the evaluation of LED life expectancy based onthe realities of traffic flow, intersection geometrics in Missouri, and the basic science of LEDcomponents. We further provide guidelines for cost-effective replacement plans based on ourfindings. The study utilizes a combination of field testing and statistical analysis.Specifically, the project includes an evaluation of the impact of manufacturer, indicator type,color, and directional view variables on the degradation of LED traffic signals. Subsequently,we develop a comprehensive LED replacement plan based on our collected data.The final report provides a comprehensive literature review, and is organized around thefollowing tasks: 1) collecting and analyzing data for measuring the light emission capability ofcircular and arrow indicators, 2) development of models for measuring the useful life of LEDlights, 3) development of an LED replacement plan, 4) plans for dissemination through the LocalTechnical Assistance Program (LTAP).11
Chapter 3 Project Management ApproachOur study included a detailed work schedule, complete with external review processes,and includes the following deliverables: 1) a review of the literature; in particular, we providedetails of the models required for data collection and analysis, along with references to literatur
1. Report No. 25-1121-0001-442 2. Government Accession No. 3. Recipient's Catalog No. 4. Title and Subtitle 5. Report Date LED Traffic Signal Replacement Schedules: Facilitating Smooth Freight Flows November 2011 6. Performing Organization Code 7. Author(s) Suzanna Long, Ruwen Qin, Abhijit Gosavi, C.H. Wu, Tom Ryan, and Casey Noll 8.