Transcription
“GATHERER ONE” DATA-LOGGERUSER’S MANUAL(Software Version 1. 5. 3)M.C. Miller Co., Inc11640 U.S. Highway 1, Sebastian, FL 32958Telephone:772 794 9448;Website:U.S.A.www.mcmiller.com
MANUAL CONTENTSPageSECTION I:INTRODUCTION 5SECTION II: OPERATIONAL ITEMSII. 1II. 2II. 3II. 4Battery-life and How to Check Battery Status . 7How the GPS Receiver Unit is Switched ON and How itsInternal Battery Gets Charged . 8How to Reboot (Reset) the G1 Data-logger . . 9How to Run the Independent GPS Program . 10SECTION III: USING THE G1 DATA-LOGGER TOPERFORM PIPELINE SURVEYSIII. 1 How to Set Up the G1 for CIS Applications 17III. 2 How to Connect the G1 with the other Test Equipmentfor CIS Applications 54III. 3 How to Set Up the G1 for DCVG Survey Applications 57III. 4 How to Connect the G1 with the other Test Equipmentfor DCVG Survey Applications 79III. 5 How to Set Up the G1 for Combined DCVG/CISSurvey Applications . 82III. 6 How to Connect the G1 with the other Test Equipmentfor Combined DCVG/CIS Applications 86III. 7 How to Set Up the G1 for Surface Potential SurveyApplications 90III. 8 How to Make Changes to your Pipeline Survey Set UpSelections . 108III. 9 How to Use the G1 as a “Stand-Alone” Voltmeter/Waveform Analyzer (Pipeline Survey Program) . . 109/continued2
SECTION IV: USING THE G1 DATA-LOGGER TOPERFORM “SCRIPTED” SITE SURVEYSIV. 1 Introduction . 119IV. 2 How to “Load” the G1 with a “Scripted” Route fromProActive . 120IV. 3 How to Use the G1 to Collect Data on a “Scripted”Route 123IV. 4 How to Download Data from a Completed Route from theG1 to ProActive . 138IV. 5 How to Use the G1 as a “Stand-Alone” Voltmeter/Waveform Analyzer (Site Survey Program) . . 140SECTION V: USING THE G1 IN STATIONARYDATA-LOGGER APPLICATIONSV. 1 Introduction . 146V. 2 How to Set Up the G1 for Stationary Data-LoggerApplications . 148V. 3 How to Use the G1 as a “Stand-Alone” Voltmeter (StationaryData-Logger Program) . 165V. 4 How to Download Stationary Data-Logger Data from the G1To ProActive . 171Appendix 1: How to Configure Trimble “GPS Pathfinder”[XR, XRS, Power and Pocket] Receiversfor Use with the G1 Data-Loggera) Introduction . 179b) How to Install the “GPS Pathfinder Controller” Software Programonto your PC . 182c) How to Install the “GPS Pathfinder Controller” Software Programonto your G1 . 182d) How to Configure “GPS Pathfinder” Receivers to Output NMEAData Suitable for Use by the G1 . 1843
e) How to Connect a Configured “GPS Pathfinder” Receiverto the G1 . 191Appendix 2: How to Configure Trimble “GPS Pathfinder”[ProXT and ProXH] Receivers for Use withthe G1 Data-LoggerSection 1: How to Configure the GPS receiver for use with the G1 . 192Section 2: How to test the GPS receiver/G1 Connection . 197Section 3: How to Setup the G1 for a Pipeline Survey Applicationwith an integrated Pro Series Receiver . 1994
SECTION IINTRODUCTIONThe “Gatherer One (G1)” data-logger, manufactured by MCM, is acombination of a high-input-impedance digital voltmeter and a handheldPersonal Computer (PC). The operating system of the PC is either Microsoft“Pocket PC”, for the Q100, or CE.NET 4.2, for the Q200, and MCM hasdesigned proprietary application programs in order that the G1 data-loggercan be employed to run “Scripted” Site Surveys and also Pipeline Surveys(such as CIS, DCVG and Surface Potential Surveys). In addition, the G1can collect “time-stamped” data in a Stationary Data-Logger (SDL) mode.Your G1 data-logger will arrive from MCM with the Microsoft operatingsystem and our application programs pre-installed. The application programswill remain installed (in RAM) unless the main battery pack, and its backup,are allowed to fully-discharge. However, your survey and SDL data willalways be safe, regardless of battery status, as these data are stored on a nonvolatile CompactFlash card. Also, a copy of the application programs ismaintained on the CompactFlash card and these programs are automaticallyre-installed whenever a “hard reset” is performed (see Section II.3).The G1 data-logger is designed to work hand-in-hand with ProActive, whichis MCM’s (Pipeline Integrity) Data Management Software Package.In the case of Site Surveys, “Scripted” Routes are downloaded onto the G1data-logger from ProActive, having been created in ProActive, and, in turn,completed site surveys are transferred back into ProActive for proactivemanagement of the collected data. The software application programrequired to run “Scripted” Site Surveys is termed the G1SS (G1 Site Survey)Program and, in Section IV, we describe in detail how to use this programon the G1 data-logger to perform Scripted Site Surveys.On the other hand, Pipeline Surveys, such as CIS and DCVG Surveys are setup on the G1 data-logger itself and completed surveys are uploaded from theG1 to ProActive, where the survey data can be managed inside of ProActiveitself. The particular application program required to run Pipeline Surveyson the G1 data-logger is called the G1PLS (G1 Pipe Line Survey) Program5
and we describe the use of this program in detail in Section III.Finally, the G1 data-logger can be used to collect time-stamped data in astationary mode. The application program required to operate the G1 in thestationary mode is called the G1SDL (G1 Stationary Data-Logger) Programand we describe the use of this program in detail in Section V.One of the attractive features of the G1 data-logger, with regard toperforming both Pipeline Surveys and “Scripted” Site Surveys, as well asbeing operated in the Stationary Data-Logger mode, is the G1’s built-in(internal) GPS receiver. Having a GPS receiver built into the unit meansthat critical location data can be logged during surveys and accurate timestamping of SDL data can be achieved without the need to carry an externalGPS receiver along with its associated power supply and antenna.The G1 data-logger’s internal GPS receiver is a Garmin 15L receiver unitthat is WAAS-enabled. A WAAS-enabled receiver can give you positionaccuracy of around 1 meter (95% of the time) and you do not have topurchase additional receiving equipment or pay service fees to utilizeWAAS (Wide Area Augmentation System). WAAS corrects for GPS signalerrors caused by ionospheric disturbances, timing, and satellite orbit errors.This system, which was developed by the FAA and the DOT, consists ofapproximately 25 ground reference stations positioned across the UnitedStates (hence the “Wide Area” designation) that monitor GPS satellite data.Two master stations, located on either coast, collect data from the referencestations and create a GPS correction message. This correction accounts forGPS satellite orbit and clock drift as well as signal delays caused by theatmosphere and ionosphere. The correction message is broadcast throughone of two geostationary satellites positioned over the equator and is pickedup by the WAAS receiver.Currently, WAAS satellite coverage is only available in North America,although other governments are developing compatible systems around theworld. Also, it should be noted that, for some users in the United States, theposition of the two broadcast satellites over the equator makes it difficult toreceive the correction message signal when trees or mountains obstruct theview of the horizon. In these cases, in the absence of a WAAS correctionmessage, the G1’s internal GPS unit will process standard (uncorrected)GPS data, with an associated loss of accuracy. Please see Appendix 1 forinformation on using non-WAAS external GPS receivers in conjunction withthe G1.6
SECTION IIOPERATIONAL ITEMSII. 1 Battery-life and How to Check Battery StatusThe G1 data-logger is equipped with a (Lithium Ion) rechargeable mainbattery pack as well as a backup battery (also rechargeable). Since typicalbattery life of the main battery pack is around 24 hours with the unitrunning, it is recommended that the battery be recharged overnight (eachnight) when the data-logger is being used on a daily basis. You might alsowish to carry a second battery pack for switch-out. It is also recommendedthat the data-logger be put on charger when not in use, so that the unit isalways ready to go when needed. When the battery is fully-charged, thecharger will automatically stop supplying power to the battery, so it is safeto keep the charger on. It is also recommended that the unit be placed oncharger when data are being downloaded to a PC, following the performanceof survey measurements. Charging is accomplished using the AC Adaptersupplied with the data-logger (a DC vehicle charger unit is also available).The charger unit can be connected to either of the two COM Ports on thebottom side of the data-logger, although the right-hand side port isrecommended. When the battery is charging, the green LED on the top-leftside of the keypad will blink ON and OFF and when the battery is fullycharged, the LED will remain ON. The main battery pack will fullydischarge (from a fully-charged state) in about a 3 week period, with the unitswitched off.The status of the G1 data-logger’s battery power, at any given time, can bechecked to make sure that the battery has sufficient charge to conduct asurvey or to run an SDL application.The procedure used to check battery status is provided below.How to check the battery statusQ100 Units: Tap on the “Start” button on the “Home” screen (“Today” screen). Tap on “Settings” on the main menu Tap on the “System” tab at the bottom of the screen7
Tap on the “Handheld Settings” icon View battery statusQ200 Units: Tap on the “Start” button (bottom left-hand corner of desktop) Tap on “Settings” on the main menu Tap on “Control Panel” Double-tap on the “Power” icon View battery statusBattery Status Indications:If the main battery status is shown as High, your battery should not needcharging in the next few hours. If the status is shown as Low, you shouldconsider charging the battery within the next few hours or so. However, ifthe status is shown as Critical, you should switch-out or re-charge thebattery immediately.When you switch-out the main battery pack, you will not lose the OperatingSystem’s registry or the application programs (assuming that the back-upbattery is charged). In addition, you will not lose your survey or SDL datawhich are stored on a non-volatile CompactFlash memory card.II. 2How the GPS Receiver Unit is Switched ON and How itsInternal Battery Gets ChargedThe GPS receiver unit is powered by an internal (re-chargeable) battery andthe receiver unit will only generate position data if its internal battery ischarged.The internal battery receives its charging current from the G1’s main batterywhenever the receiver unit is switched ON.However, the GPS receiver unit is only switched ON (automatically) whenGPS data are required for an application, such as during a pipeline survey orwhen position data are required at a site during a site survey. The GPSreceiver is only switched ON when data are required in order to minimizethe power consumption rate of the G1’s main battery.8
In order to allow charging of the GPS receiver’s internal battery outside of asurvey application, the receiver unit is switched ON, automatically,whenever the G1 unit is placed on charger (see Section II. 1). Consequently,when the main battery of the G1 unit is being charged, the GPS receiver’sinternal battery also gets charged.When the GPS receiver unit is switched ON, either because the G1’s mainbattery is being charged, or in response to a survey application demand, theGPS receiver power ON icon, which is the letter G with a lightning bolt, willappear in the blue band at the top of then screen.In order to avoid a significant time delay in acquiring GPS data in responseto a survey application demand, the receiver’s internal battery should befully-charged prior to embarking on a survey. The best way to accomplishthis is to fully-charge the G1’s main battery prior to embarking on a survey.II. 3 How to Reboot (Reset) the G1Should the G1 data-logger lock up (freeze up), or fail to operate, the unit canbe rebooted (or reset) in one of two ways:Soft RESETTo perform a Soft RESET, press and hold down (simultaneously) both thePower button (Red key on keyboard) and the Orange button for about 5seconds. The screen will go blank and your data-logger will perform a softRESET. When you use Soft RESET, you do not lose the OperatingSystem’s registry, the G1’s application software programs or yoursurvey (or SDL) data. As mentioned above, your survey or SDL data areactually stored on a non-volatile CompactFlash memory card.Hard RESETTo perform a Hard RESET, press and hold down (simultaneously) thefollowing 3 keys for about 5 seconds:The Power button (Red key on keyboard), the Orange button and theWhite button.Note: A Hard RESET should be used as an emergency procedure only.9
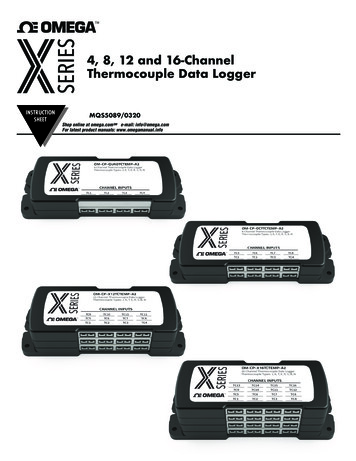
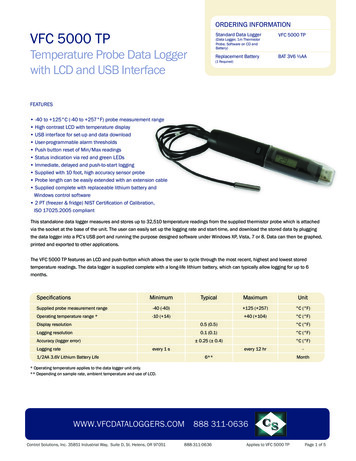
When you perform a Hard RESET, you will lose the Operating System’sregistry and the G1’s application programs. Your survey (or SDL) data,however, will be safe, as these data are stored on a non-volatileCompactFlash card.After performing a hard reset, or in the event that all battery power isallowed to fully discharge, the application programs can be automatically reinstalled from a copy of the programs saved on the CompactFlash card.Following on-screen instructions, you will have to recalibrate the touchscreen and re-enter your personal settings which will have been lost (withthe lost registry). In addition, you will receive a “G1 Install” prompt to “Setthe date and time”. The program copying process (from CompactFlash cardto RAM) will be launched after you have set the time and date on your G1 inresponse to this prompt. When the copying process is complete, the “MCMGPS Power Control” screen will appear. Simply exit this screen (makingsure to leave the selection as “Power on when charging”) to return to the G1desktop. The application programs will have been re-installedautomatically.II. 4 How to Run the Independent GPS ProgramThere is a GPS program on the G1 that can be run independently of thesurvey application programs. You can use the program to view GPSposition data on the G1 screen at a given location, and you can also log(save) the GPS position data. Logged data will be stored in a text file onyour G1 and you can copy the file to your PC using ActiveSync.Q100 Units:To access the GPS program on Q100 units, tap on the “Start” button on the“Home” screen, which will pull up the menu shown below, and then tap onthe “G1GPS” button.10
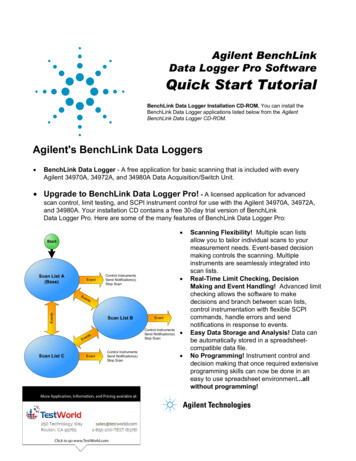
Q200 Units:To access the GPS program on Q200 units, double tap on the “G1GPS” iconon the desktop shown below. Alternatively, you can tap on the “Start”button, tap on “Programs” and then tap on G1GPS.In either case (Q100 or Q200 units), the screen shown below will appear.11
Next, tap on the “Settings” button, which will pull up the screen shownbelow.By tapping on the pull-down list arrow button in the GPS field, you canselect the type of GPS receiver you are using. You can select either the“MCM Internal” receiver or an external “NMEA” compatible receiver, such12
as a Trimble Pathfinder unit or a Garmin unit. If you select to use the MCMInternal receiver, COM 4 will automatically be selected. If you select“NMEA”, you can select the COM Port by tapping on the drop-down listarrow button in the COM field. You can select COM 1 or COM 4. COM 1is the left-hand (26-way) terminal on the data-logger and COM 4 is the righthand terminal. COM 4 is recommended, which frees up COM 1 forActiveSync.“Select” Button:The storage location (folder) for a GPS data file is the “My Documents”folder which exists on both the CompactFlash memory card and on the mainmemory. You can add a sub-folder, which you can name, by tapping on the“Select” button and adding a new folder. Your GPS position data file wouldthen be stored in this sub-folder inside of the “My Documents” folder.By tapping on the “Save” button on the Settings screen, you will be returnedto the GPS data screen shown below.The data parameters are self-explanatory with the exception of the PDOPand EPE parameters. These acronyms stand for, Position Dilution ofPrecision and Estimated Position Error (available with Garmin receiversonly). These data provide position accuracy information.13
Filename:You can set up a file to store the logged GPS data by tapping on the “New”survey button on the above screen. This will pull up the screen shownbelow.You are being asked here to enter a name for the file in which the GPS datawill be stored.By tapping on the OK button, the screen shown below will appear (for thecase of an example file by the name of “MCM Sites”.14
Description:You can provide a description of the location for which you are planning tolog position data by tapping in the field labeled, “Desc:” and entering adescription. The above screen shows “Test Station 1” as an examplelocation description.You would then be in a position to log GPS position data by tapping on the“Log” button on the above screen.Alternatively, you could open a previously saved file by tapping on the“Open” survey button, as opposed to tapping on the “New” survey button.In this case, you could elect to open a file that you had previously saved byselecting a file name from the drop-down list on the screen shown below.15
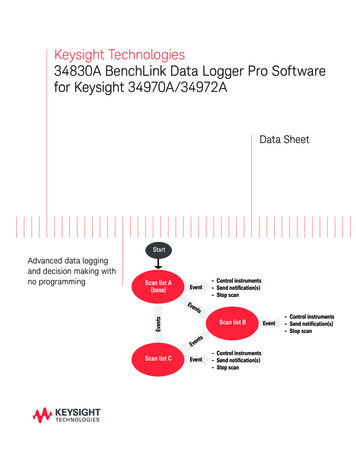
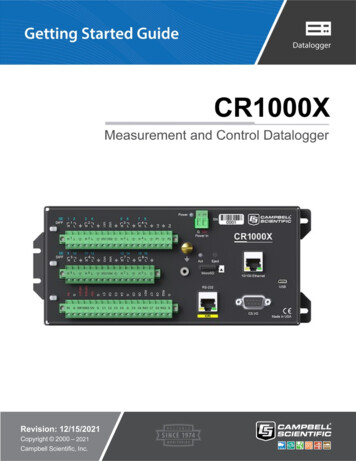
By selecting a previously-saved file, you could, for example, continue to addGPS position data to an existing file that you had set up previously.How to view saved data:If you set up a file, as described above, and you logged GPS position data, atone location or multiple locations, you can view the saved data by accessingthe file on the G1 using ActiveSync.To do so, you would connect the G1 to your PC using the COM 1 Port (lefthand terminal), switch on the G1 and make sure that you had an ActiveSyncconnection. Next, you would double click on the following icons on yourPC: My Computer, Mobile Device, My Pocket PC and My Documents.Next, you would locate the text file (your filename.txt) and copy the text fileto a folder on your PC, such as your “My Documents” folder. You can thenopen the file to display the saved GPS position data.For instance, the window shown below illustrates an example in which GPSposition data were logged at two locations (“Test Station 1” and “TestStation 2”) and the data saved in a file named “MCM Sites”.16
From left to right, the data displayed are: date, time of position fix, latitude,longitude, altitude, GPS status (standard or differentially-corrected), numberof satellites in use, the PDOP, the EPE and, finally, the description of thelocation (provided by you).SECTION IIIUSING THE G1 DATA-LOGGER TO PERFORMPIPELINE SURVEYSIII. 1How to Set Up the G1 for CIS ApplicationsThe following section outlines the steps required to setup the G1 toparticipate in CIS measurement applications. The setup process establishesthe conditions of the particular survey about to be performed and identifiesthe section of pipeline that is about to be examined by the CIS application.The setup process also establishes a file in which the voltage recordings(survey data) will be stored. At the completion of the survey, CIS data canthen be retrieved by a PC that is in communication with the G1, by accessingthe file in which the survey data are stored. The process of transferring CISdata to a PC following completion of a survey is discussed in our CISTraining Manual –G1 Version.17
Step 1:Switch on the G1 by pressing the power button (red key on keyboard).Assuming that the battery pack is charged (see Section II), the screen willlight up and will display the “home” screen (“Today” screen), in the case ofthe Q100 units, and the desktop screen, in the case of the Q200 units.The startup screens for the Q100 and the Q200 units are illustrated below:Q100 Units:Q200 Units:18
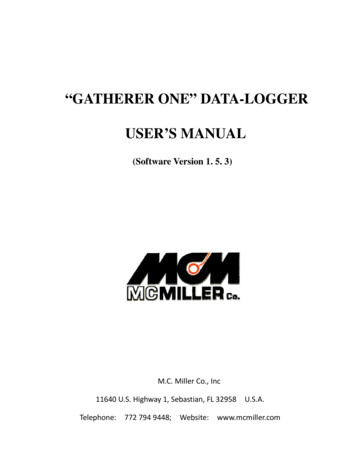
Step 2:In the case of the Q100 units, tap on the “Start” button on the “Home”screen. This will pull up the main menu.Step 3:In the case of the Q100 units, tap on the G1 PLS button on the main menu.In the case of the Q200 units, double-tap on the G1PLS icon on the desktopor tap on the start icon (bottom left-hand corner of desktop), tap on the“Programs” button and tap on the G1PLS button.In either case (Q100 or Q200 units), the survey screen shown below will bedisplayed.Note: In the case of the Q200 units, the menu items are arrayed along thetop of the screen.19
Step 4:Tap on the “Survey” button located on the menu bar. The screen shownbelow will appear.Under “Survey” there are several options. If this is a new survey (not acontinuation of a previous survey) tap on “New Survey”. The screen shownbelow will appear.20
Step 6:Enter a “filename” for the Survey.Note: This is an important step as the filename is used to identify the surveyand, also, recorded data (voltages) will be stored in this named file for futureretrieval. It is highly recommended that a protocol be established forselecting Survey filenames. Critical information should be included in thefilename, such as pipeline company’s name, city or state in which thepipeline is located, pipeline number and section of pipeline number undersurvey. The protocol developed should be applied consistently for eachsurvey.For example, let’s assume that pipeline company XYZ has a pipeline locatedin Texas and that the pipeline is identified as pipeline 12 and a survey isbeing performed on section 085 of this pipeline. A good filename for thissurvey would be:XYZ TX 12 085 CISWhen this data file is later accessed, with this filename we know the name ofthe pipeline owner, we know the state in which the pipeline is located, weknow the pipeline number, we know the section number of the pipeline thatwas surveyed and we know that it was a CIS.21
Note: You will not be permitted to use invalid characters, such asslashes( / or \ ), as part of a filename. You will be alerted if you try touse any invalid characters.Step 7:Tap once on the OK button. The screen shown below will appear.Step 8:Select “Survey Type”.For CIS measurements there are 2 options for “type of survey”: Trigger CISand Continuous CIS. Other survey types are available, as can be seen bytapping on the pull-down list arrow button in the “Survey Type” field asshown below.22
DCVG and combined DCVG/CIS surveys are available for selection (aswell as Surface Potential), however, for CIS-Only surveys, eitherContinuous CIS or Trigger CIS should be selected by tapping once on theselection.In Trigger CIS mode, voltage recordings are “triggered” by the operatorpressing on the push-button switch located on top of a reference electrodecane while making electrical contact with the soil above the pipe with thecopper/copper sulphate half-cell end of the cane. Consequently, in thissurvey mode, the operator is in control of the timing of when voltagerecordings are made as a CIS is conducted.Note: The “Trigger CIS” mode should also be selected when using thetrigger cable (part # SIN024) for automatic triggering of readings inconjunction with the wire chainer/counter unit(http://www.mcmiller.com/pdfs/Chainer Counter Original.pdf ) or whenusing the Digital Trigger Cable for automatic triggering of readings(http://www.mcmiller.com/pdfs/Chainer Counter New.pdf ).23
In contrast, with the Continuous CIS mode, the timing of when voltagerecordings will be made is preset. For instance, if you select 1 secondintervals, voltage recordings will be made every second. Consequently, theoperator must synchronize his cane repositioning pace to match the presetvoltage recording timing.Step 9:Select the function (operating mode) of the cane buttons associated with thetwo reference electrodes (canes) to be used in the CIS. Selections are madeby tapping choices in the D.C. P. and Survey fields shown in the abovescreen.The function of the cane buttons during regular survey measurements isdetermined by the selection made in the “survey” field, while the selectionmade in the “D.C.P.” box determines the function of the cane buttons whenmeasurements are made at specially-identified locations (devices).Cane Button Functions – During Regular Survey (Between “Devices”)The functionality available for the cane buttons depends on the survey modeselected in Step 8 [Trigger mode or Continuous (timer) mode].If the Trigger CIS mode is selected (and the “Use Automatic Triggering”box is not checked), the screen will appear as shown below.24
For the above screen, the pull-down-list arrow button in the Survey field wastapped to reveal the 4 choices for the push buttons on the pair of canes to beused in the Trigger CIS (the left cane, held in the left hand with the leftthumb operating the left cane button and the right cane, held in the righthand with the right thumb operating the right cane button).Manual Triggering of Readings:The left and right cane buttons can both be selected to read voltages(read read) meaning that as the operator walks down the pipelinealternately contacting the soil with the left and right canes, a voltagerecording will be made when either cane is triggered. Alternatively, one ofthe canes can be selected to read voltages while the other is selected toregister the location of a survey flag (survey flags are typically located every100 feet down the length of a pipeline). This would be the (flag read) or(read flag) choice. In this case, the push button on the cane selected toregister flags would only be pressed at each survey flag location. Finally,the (flag flag) choice can be selected and, in this case, both canes wouldonly be used to register survey flags. Pressing the push-button on the “read”designated cane or pressing the cane button on the “flag” designated canehas the same affect as tapping the read button (and saving the reading) or theflag button, respectively.Automatic Triggering of Readings:When the “Use Automatic Triggering” box is checked, the screen will be asshown below:25
In the above case, the flagging option is disabled and the “Read Read”option is automatically selected.If Continuous CIS mode is selected, the screen will be as shown below.26
The 4 choices for the set of two canes in the Continuous CIS mode arerevealed in the Survey field by tapping on the pull-down-list arrow button.The 4 choices are shown in the screen above. In this case, one of the canebuttons can be selected to effect a pause in the continuous (automatic everyso many seconds as prescribed) voltage recordings while the other canebutton is selected to register survey flag locations [(flag pause) or (pauseflag)]. Alternatively, both cane buttons can be selected to register flags or toaffect pauses. The pause cane would also act as the start or restart cane.Cane Button Functions – At “Device” Locations“Devices” are defined as specially-identifiable entities that exist along thelength of the pipeline. Examples of “Devices” include, rectifiers, teststations, valves, etc.For both CIS modes (Trigger and Continuous), a cane button functionselection (selection will apply to both left and right canes) has to be madewith regard to Data Collection Points (see D.C.P. field in above screen). AData Collection Point is a “Device” location point.In this case there are 2 choices: “None” and “Save”. Your selection is madeby tapping on the radial button of your choice.If “None” is selected: Pressing a cane button switch will do nothing. In thiscase, you would have to tap the “save” button on the screen, havingpreviously tapped the “device” button, if you wished to read and record thevoltage data at the “Device” location.If “Save” is selected: Pressing a cane button switch has the same effect astapping the save button on the “Device Readings” screen.For the most part, selecting the “Save” choice will be preferable, sincevoltage recordings at special data collection points (such as rectifiers, teststations, valves, etc.) are important and should be saved as part of the overallCIS and a convenient way to do this is to use the push-button switch on oneof the canes, having tapped on the “Device” button on the screen when a“Device” is encountered.Step 10a:Make “Survey Walking Direction” selection27
The “Survey Walking Direction” box is shown in the screen above. Thereare only 2 selection choices: Increasing and Decreasing.This selection establishes the walking direction during the survey. If thesurvey is going to entail walking from a low-numbered test station to ahigher-numbered test station, for example, select “Increasing” by tappingonce on the circle beside “Increasing”. Select “Decreasing” if the oppositeis true.Step 10b:Make selection of “Metric” units if required.By checking off the box labeled “Metric”, the reading interval (distancebetween voltage recordings) and the flag internal (flag spacing) will bedisplayed on the Setup 3 of 5 screen in meters, as opposed to feet.Step 10c:Check-off “DCVG Sidedrains in CIS Survey” if you plan to log DCVGsidedrain readings at previously located anomalies during the course of aCIS.By doing so, a special “Device” selection , named “Mark DCVG” will bemade available in the “Device” list, which has a sidedrain prompt associatedwith it, as indicated in the screens shown below.28
The “Mark DCVG” device will not appear in the Device list if this box is notchecked, which would be the case if you were conducting a regular CIS.Step 10d:Check-off “Use Automatic Triggering” if you plan to use the original trigger29
cable (SIN024) or the new Digital Trigger Cable for automatic triggering ofreadings.Step 11:Make “Rectifier Mode” sele
The G1 data-logger is designed to work hand-in-hand with ProActive, which is MCM's (Pipeline Integrity) Data Management Software Package. In the case of Site Surveys, "Scripted" Routes are downloaded onto the G1 data-logger from ProActive, having been created in ProActive, and, in turn,