Transcription
Universal Data LoggerOperation and Maintenance Manual
Universal Data Logger
Release HistoryVersion 1.0, February 2022Any questions related to this Operation and Maintenance manual should be directed to:BPC Instruments ABScheelevägen 22SE-223 63 LundSwedenTel:Fax:E-mail:Web: 46 (0)46 163950 46 (0)46 163959info@bpcinstruments.com or is document contains proprietary information that is protected by copyright.All rights are reserved. No part of this publication may be reproduced in any form whatsoever or translated into anylanguage without the prior, written permission of BPC Instruments AB.Copyright 2022 BPC Instruments ABProduced in Sweden
TABLE OF CONTENTS1 PREFACE . 12 GENERAL INFORMATION . 23 DELIVERY CHECKS . 33.1 Box Content . 34 PRE-COMMISSIONING . 45 QUALITY RULES AND RECOMMENDATIONS . 46 SAFETY CONSIDERATIONS . 57 EQUIPMENT DESCRIPTION (DESIGN/FUNCTION) . 57.1 Hardware . 57.2 Universal Data Logger Software . 68 OPERATION . 78.1 Before Start up . 78.2 Start up . 128.3 End of Operation . 129 MAINTENANCE . 1210 UNIVERSAL DATA LOGGER SOFTWARE . 1310.1 Installation of the Universal Data Logger Software (Windows 8) . 1310.2 Universal Data Logger Software User Guide . 25
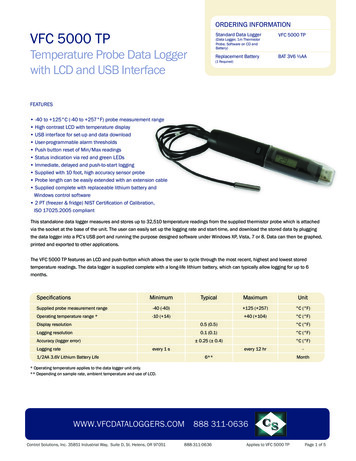
1PREFACEBPC Instruments AB (BPC) is a privately held company and market leader in the area ofadvanced control technologies for the commercial biogas industry, providing technologies andservices that support the efficient design and operation of biogas plants & processes. Thecompany was founded in 2006, bringing to market more than 15 years of industry leadingresearch in the area of instrumentation, control and automation of anaerobic digestion processes.At the end of 2009, BPC launched the Automatic Methane Potential Test System I (AMPTS I), arevolutionary product in the area of on-site lab equipment for methane potential analysis. Thenumber of users of AMPTS I grew quickly and today there are users in more than 40 countries,located in the Americas, EMEA, and Asia Pacific regions. In April 2011 an updated version ofthe AMPTS was made commercially available and at the end of 2012 the BioReactor Simulator(BRS) was introduced to the market. As of January 2013, a new instrument (µFlow) formeasuring ultra-low gas flows with high precision has been offered to the market.The Universal Data Logger is a PC-based automatic data logger system developed by BioprocessControl containing both hardware and software. This data logger system features a plug-and-playsignal connection and an easy-to-use software program. It supports automatic data acquisition forup to 8 standard analogue input signal channels (4-20 mA). As a default, all 8 channels aredesigned for supporting passive analogue signals. However, one or multiple channels can becustomised for supporting active analogue signals as well. Users can define the types of processsignals, e.g. “Gas Flow”, “pH”, “Temperature”, “Methane Content” and customer self-definedsignal ”Custom”. Users can also define the scale for each channel. This provides a greatflexibility for setting up an automatic data acquisition system for a wide range of on-line sensorswith little effort. Other features include real-time signal and historical trend display, as well asreport generation with four different time intervals, e.g., 5 minutes, 15 minutes, hour and day.1
2GENERAL INFORMATIONAnaerobic biodegradation processes are gaining in interest among industry and localgovernments, due to their ability to produce energy and reduce sludge yields.Process parameters such as gas flow rate, pH, methane or carbon dioxide concentration in theraw biogas represent key indicators for evaluating the anaerobic digestion process performance.For laboratory and small pilot-scale experiments, there is an increasing demand forimplementing on-line real time sensors and automatic data acquisition for studying the dynamicbehaviour of anaerobic digestion and other biological fermentation processes. Often dataacquisition systems for laboratory and small pilot-scale experiment studies are designed andconstructed in-house for each individual case, which leads to long development time, high costand unreliable systems due to lack of sufficient test and validation.The Universal Data Logger is a PC-based automatic data logger system developed by BioprocessControl containing both hardware and software. This data logger system features a plug-and-playsignal connection and easy-to-use software program. It provides a great flexibility for setting upan automatic data acquisition system for a wide range of on-line sensors with no time and littleeffort.2
3DELIVERY CHECKSAt delivery, unpack and check that the contents match with what is listed below in the Section“Box Content”.If the packaging or the equipment is broken or damaged at delivery, please:a) Document and take photos of the parts and packaging.b) Inform the transport company at the time of delivery.c) Make sure that the transport company documents the incident.d) Inform the seller of the incident.3.1 Box ContentSee also Chapter 7 (Equipment Description) for pictures of included parts.1 Universal Data Logger1 Ethernet cable1 power adapter (input 100-240 V 50/60 Hz, output 24 V DC / 0.5 A or higher)1 USB memory with the Universal Data Logger Software1 manual3
4PRE-COMMISSIONINGThe following items are not included in the delivered Universal Data Logger, however theywill/may be required to operate it: 5Additional wall socket adapters (plugs/contacts). The ones supplied are according toEuropean, US or UK standards, depending on original purchase order.QUALITY RULES AND RECOMMENDATIONS The product guarantee provided corresponds to the guarantee stipulated on the confirmedproduct order form and shipping documentation.Only the parts delivered with the product can be used with the system in order toguarantee the quality and performance of the product.BPC reserves the right to correct any possible text and image errors as well as changes totechnical data in this manual.Always handle the Universal Data Logger with care, as it may be sensitive to shock.Warning: Make sure to connect devices with active analogue output signals to a channelthat has been designated for active analogue signals. Similarly, make sure that deviceswith passive analogue output signals are connected to a channel designated to passiveanalogue signals. Connecting them in any other way may cause damage to electroniccomponents in the Universal Data Logger, which will not be covered by the productguarantee.BEFORE GETTING STARTED Read this manual before installing and using the equipment.Keep the instruction manual for future reference and make sure it is easily available forpeople who regularly use the Universal Data Logger.For any questions regarding use of the µFlow Gas Flow Meter with the Universal DataLogger, please refer to the µFlow Gas Flow Meter Operation and Maintenance manual.4
6SAFETY CONSIDERATIONS 7Always be cautious when handling electrical devices close to water and other liquids.Warning: Make sure to connect devices with active analogue output signals to a channelthat has been designated for active analogue signals. Similarly, make sure that deviceswith passive analogue output signals are connected to a channel designated to passiveanalogue signals. Connecting them in any other way may cause damage to electroniccomponents in the Universal Data Logger.EQUIPMENT DESCRIPTION (DESIGN/FUNCTION)7.1 HardwareThe PC-based Universal Data Logger consists of a hardware module controlled by an easy-touse software program. The hardware module has 8 plug & play terminal connectors thatprovide connections for 8 analogue input channels. Each channel has an AI plug & playterminal to which you can connect a current signal. The module has a common terminal,COM, which is internally connected to the isolated ground reference of the module.As a default, all 8 channels are designed for supporting passive analogue signals, which areused with the Flow Gas Flow Meter and standard temperature probes. However, one ormultiple channels can be customised for supporting active analogue signals, i.e. sensorsthat require their own power source. Such sensor devices may include pH measuring systems,oxidation-reduction potential (ORP) systems, gas composition sensors for CH4 and CO2, etc.The main characteristics of the hardware module are presented below: 8 analogue current input channelsStandard 4 to 20 mA input rangesEach channel can individually be set to a parameter from a selection of five.(Gas Flow, pH, Temperature, Methane Content or Custom.)Adjustable scale setting for each channel in the software interface16-bit resolution, 200 kS/s aggregate sampling rateIndoor application only5
7.2Universal Data Logger SoftwareThe Universal Data Logger Software is needed in order for the Universal Data Loggerhardware to work with a PC. It is delivered on a USB memory together with the UniversalData Logger hardware. Please notice that the Universal Data Logger Software is deliveredwith a license control and can only work together with the Universal Data Logger hardwaredelivered at the same time.6
8OPERATION8.1 Before Start upFIRST TIME CONNECTING AND SETTING UP THE NETWORKImportant! Make sure the computer is not connected to a wireless network. If possible,temporarily completely disable the wireless capability.a) Connect the shielded Ethernet cable to the Universal Data Logger.b) Connect the shielded Ethernet cable to a computer.Important! Make sure that the network cable is connected prior to connecting the power.c) Connect the power supply (24 V DC 0.5 A or higher) to the Universal Data Loggerhardware, and then to a standard 100-240 V 50/60 Hz power socket.W INDOWS 8a) Select “Network and Sharing Center” by one of the two options below:1. Open the Windows Start Menu and select “Control Panel”. Then choose“Network and Sharing Center”.7
2. Click the search icon in the Windows 8 tile view and search for “Network andSharing Center”b) On the left side of the “Network and Sharing Center” window, select “Change adaptersettings”.c) Right click on the appropriate network adapter and select “Properties”. Usually this isnamed “Local Area Connection”, possibly followed by a number. It is important that theadapter corresponding to the connected Ethernet cable is selected.8
d) Select “Internet Protocol Version 4 (TCP/IPv4)” and click on the button marked“Properties”.e) Select “Obtain an IP address automatically” and “Obtain DNS server addressautomatically”:f) Select “OK”.g) Click “Close” in the remaining window.9
INSTALLATION OF THEa)UNIVERSAL DATA L OGGER HARDWAREConnect the Universal Data Logger to the computer using the Ethernet cable. The picturebelow shows the back of the Universal Data Logger where the Ethernet port is located.b) It is very important that the blue (or grey for same versions) end of the analogue outputcable is used when inserting the cable into the port on the Universal Data Logger. Pleasenote: Always check if the measuring device use active or passive analogue signalprocessing, and select a channel that is designed accordingly.The picture below show the cable ports on the front of the Universal Data Logger.10
c)Insert the other end of the analogue output cable to the measuring instrument that will beused.d) If more reactors will be used in the experiment, repeat step b) and c) for each reactor andcorresponding measuring device.e)When all reactors and measuring devices have been connected, plug the power adapter intothe power input at the back of the Universal Data Logger. Then connect it to a wall socket.f)Enter the names and settings of the reactors in the Universal Data Logger Software. (SeeSoftware user guide in chapter 10.2.)11
8.2 Start upAt this stage, it is assumed that the Universal Data Logger, as well as the measuring devices(e.g., μFlow), are already installed and connected to the Universal Data Logger as described insection 8.1.Make sure that the measuring devices are working properly, and then refer to chapter 10.2 to setup the experiment in the software interface.8.3 End of Operationa) Generate a report in the Load Data page. Download and open the report to make sure thatit has been generated properly and that no errors occurred while downloading the file.b) Stop the logging by pressing the “Stop” button in the Graph page. (See Chapter 10.2.)The experiment can no longer be continued after the “Stop” button has been pressed.c) Disconnect the power adapter from the wall socket.d) Disconnect the signal cables from the channel connectors and from the measuringdevices.e) For instructions on how to end operation of the µFlow Gas Flow meters, please refer tothe µFlow Gas Flow Meter Operation and Maintenance Manual.9MAINTENANCEAlways handle the Universal Data Logger gently, as data acquisition is sensitive to physicalshock.12
10 UNIVERSAL DATA LOGGER SOFTWARE10.1 Installation of the Universal Data Logger Software (Windows 8)The Universal Data Logger Software installation is divided into two steps. The files neededfor the first part is collected in a folder called “BpcUniversalLogger Additional Installers”,which also includes required installations of Adobe reader and Open Office. The second partis collected in the “UniversalDataLogger Installer”.1. Start the installation by inserting the USB drive with the Universal Data Logger Softwarefiles. Open the disk drive in Windows Explorer and open the folder called“BpcUniversalLogger Additional Installers”.13
2. Next, open the “Volume” folder.3. Select the setup.exe file and open it.14
4. When the setup.exe file is opened, installation will be initialised, and a green bar willshow the progress.15
5. Select a destination directory for the “BpcUniversalLogger” program files, and for theNational Instruments products files that are part of the software.16
6. Start the installation by clicking “Next”.17
7. A window will show the installation progress.18
8. A message will follow when the installation is completed. Click “Next” to finalise.9. When the installation has been confirmed as successful, restart the computer.19
10. Start the second part of the installation by opening the folder called “UniversalDataLoggerInstaller”.11. Next, open the “Volume” folder.20
12. Select the setup.exe file.13. The installation is started, and a green status bar shows the progress.21
14. Select a file directory for the files.15. Start the installation by clicking “Next”.22
16. The green status bars show the progress.17. Click Finish to complete the installation.23
18. When the software installation has finished, connect the Universal Data Logger to acomputer using the Ethernet cable. Then connect the Universal Data Logger to a poweroutlet, and the drivers will be installed on the computer. This will complete theinstallation.19. The Universal Data Logger Software can be uninstalled in the Windows Control Panel.The National Instruments files needs to be uninstalled separately.24
10.2 Universal Data Logger Software User GuideThe software interface is organised in a number of pages, all reachable from the start pagenamed “Home”. The pages are laid out in the same order that an experiment is set up,executed, monitored and finally documented. Below is an overview of the pages available,and their main functions:HomeThis page is shown when the software is started. The different pages can be accessed throughthe five tabs at the top. Under the tabs, links will lead the user to information such as the usermanual, the technical specification and product information sheets.SettingsIn the Settings page, the user prepares an experiment by applying settings for each reactor/line(represented by channels in the Universal Data Logger system). In the Channel Setup page,each channel can be set to measure different properties, such as Gas Flow, pH, Temperatureand Methane Content. In the Scale Setup page, an output range and unit can be set for eachproperty.GraphThe Graph page is where an experiment is started and stopped. The graph provides a visualrepresentation of the gas flow rates vs. time. It is possible to scroll and zoom in the graph, andalso to export pictures of it. Each channel and property can be selected to show up or behidden in the graph view.Load DataThe Load Data page allows the user to load data from a specific time interval, and to generatea report of it. The report contains experiment data for each reactor/line.SystemThis page contains general information related to the software version, Universal Data Loggerhardware and contact details.25
D ETAILED GUIDE FOR EACH PAGEIn each page it is possible to find additional menus by right clicking in different areas. Not allthe functions shown in these menus are activated in this application, and only the ones that areuseful for experiments with the µFlow Gas Flow Meter are explained here.H OME26
S ETTINGSWhen the Settings page is entered, a warning will pop up to inform that any change of settingsin this page will affect the existing saved data. Therefore, it is recommended that a report isgenerated and saved before changing any settings in this page.The Settings page is used to set up an experiment. There are two buttons to select between the“Channel Setup” and the “Scale Setup” views.27
S ETTINGS – C HANNEL S ETUP1. Enter the name of the first reactor/line in the field to the top left. (The top row showchannel 1 to 4 from left to right, and the lower row similarly show channel 5 to 8. Achannel name is limited to 10 characters.)28
2. Set the “Use” attribute to “In use” for the channels that will be used during theexperiment.29
3. Select a “Scale Type” value for each channel that will be used in the experiment.Important: If the Universal Data Logger has been customised to have one or severalchannels for active analogue signal processing, or if probes with active analogue signalprocessing will be used, please refer to chapter 7.1 about Hardware description.Save the above settings by pressing the “Apply” button.Repeat this procedure for all the channels that will be used in the experiment, and press“Apply” after each channel has been set.The value of the current flow rate for each channel is also displayed. The value is a meanvalue over the last minute.30
S ETTINGS – S CALE S ETUPIn this view, “Output Range” is the only attribute that can be selected. (The “Input Range”and “Output Unit” can be changed, but will not control these parameters.)31
GRAPHThis section shows the Graphs page.Start loggingTo start data logging, the user has to press the green button labelled “Start logging”. Thebutton will turn grey and it will change its name to “Stop logging”.Under the “Start /Stop logging” button, there are checkboxes for each of the 8 channels. Theycan be used to select which channels that should show up in the graph. Check the boxes forthe channels that should show up in the graph, or uncheck them boxes to hide the channelsfrom the graph. (Use the grey scrolling bar to find Channel 7 and 8.)The graph shows the current flow rates for the selected channels. The values in the graph areupdated every 15 min after starting the logging and are normalised to 1.0 atm and 0 C.Stop loggingTo stop data logging, press the button “Stop logging”. The button will become green againand the system will stop recording any data. Stopping the data logging will not deleteanything; it will only stop recording data until the “Start logging” button is pressed. Alllogged data will be stored in the database files.32
Scrolling and zooming in the graph plotThe bar with 3 buttons shown below enables different zooming and scrolling tools for the plotarea. If it is not already showing up, it can be reached through a menu showing up by rightclicking in the graph plot. Choose “Visible Items” “Graph palette” to find it.The button with the hand icon can be used to move the graph in any direction. A left mouseclick that is held down while moving the mouse will move the graph according to the mousemovement. A right mouse click that is held down will start scrolling the graph when thecursor reaches any edge of the graph, to reveal more of the graph in that direction.The button with a magnifying glass with a plus sign opens up 6 alternatives to zooming in/outand changing the scales of the graph.1. The top left icon allows the user to resize the graph window to a smaller subset of thevisible display by first clicking on the icon and then by clicking at a suitable point in thegraph and then, while still holding down the mouse button, creating a square shape. Thegraph window will then zoom in to display the data contained within the square shape.2. The top middle icon allows the user to resize the graph window in a similar way to thefirst option but with a focus on the x-axis. The y-axis will automatically adjust to anappropriate value.3. The top right icon allows the user to resize the graph window in a similar way to the firstoption but with a focus on the y-axis. The x-axis will automatically adjust to anappropriate value.4. The bottom left icon allows the user to resize the graph window to display all availabledata. This action is performed by clicking once on the icon.5. The bottom middle icon allows the user to zoom in on the graph by first clicking on theicon and then clicking in the graph window.6. The bottom right icon allows the user to zoom out on the graph by first clicking on theicon and then by clicking in the graph window.33
Right clicking in the graph area (selected commands)Clear graph will just clear the curves in the graph view, but all data that has been recordedwill be kept. The graph can be reloaded by pressing the “Load Data” button in the “LoadData” window. It may take a little longer for the data to show up in the Graph window, than itdoes in the “Load Data” window.AutoScale XAutomatically scales the x-axis to contain all data.AutoScale YAutomatically scales the y-axis to contain all data.ExportA picture of the current view of the graph can be exported as a picture, excel file, or added tothe clipboard. (To export the experiment data, see the Load Data page guide.)Clicking on the icon associated with a specific graph (selected commands)Additional software features can be reached by left or right clicking the icon associated with aspecific graph. Selected functions will be described below.Plot VisibleThis option toggles the visibility of the selected plot and is equivalent to the user checking thebox located to the left of the specific line’s name.34
ColourThis setting allows the user to define a different colour for the particular line.ExportA picture of the current view of the graph can be exported as a picture, excel file, or added tothe clipboard. (To export the experiment data, see the Load Data page guide.)35
L OAD D ATAIn the “Load Data” page it is possible to generate a report.Load DataTo start loading the data, choose the period of interest (i.e., start and stop times) and then topress the button “Load Data”. The data for the selected time period will show up in the graph.Generate ReportBy pressing the button “Generate report”, a pop-up window will be displayed with thefollowing message: “The data load in the graph is at an interval of 15 minutes. Choose atwhich interval you would like to save your report: 15 minutes, hour, or daily”.36
After selecting the unit for the time (e.g., quarter of an hour, hour or day) and pressing “OK”,the data will be saved into a *.csv (comma-separated values) file. The file can be opened andviewed through a spreadsheet program such as Microsoft Excel, Open Office Calc or GoogleDocs.The flow rate for the selected flow cells is presented in Nml/h in the generated report.Right clicking in the graph area (selected commands)Clear Graph will just clear the curves in the graph view, but all data that has been recordedwill be kept. The graph can be reloaded by pressing the “Load Data” button in the “LoadData” window. It may take a little longer for the data to show up in the Graph window, than itdoes in the “Load Data” window.AutoScale XAutomatically scales the x-axis to contain all data.AutoScale YAutomatically scales the y-axis to contain all data.ExportA picture of the current view of the graph can be exported as a picture, excel file, or added tothe clipboard. (To export the experiment data, see the Load Data page guide.)37
S YSTEMThis section shows the System page. The page contains general information about thesoftware, Universal Data Logger hardware (i.e., serial number, IP address) and contact detailsfor troubleshooting and support.‘38
The Universal Data Logger is a PC-based automatic data logger system developed by Bioprocess Control containing both hardware and software. This data logger system features a plug-and-play signal connection and an easy-to-use software program. It supports automatic data acquisition for up to 8 standard analogue input signal channels (4-20 mA).