Transcription
Rep. 58&2142Reprinted, with permission, from Report 580 of the InternationalCommittee (C.C.I.R.), pp. 142-150, 1986.CHARACTERlZARONOF FREQUENCYRadio ConsultativeAND PHASE NOISE(Study Programme 3B/7)(1974-1978-1986)1.1ntroductioaTechniques to characterize and to measure the frequency and phase instabilities in frequency generatorsand received radio signals are of fundamental importance to users of frequency and time standards.In 1964 a subcommittee on frequency stability was formed, within the Institute of Electrical and ElectronicEngineers (IEEE) Standards Committee 14 and later (in 1966) in the Technical Committee on Frequency andTime within the Society of Instrumentation and Measurement (SIM), to prepare an IEEE standard on frequencystability. In 1969, this subcommittee completed a document proposing definitions for measures on frequency andphase stabilities. These recommended measures of stabilities in frequency generators have gained generalacceptance among frequency and time users throughout the world. Some of the major manufacturers now specifystability characteristics of their standards in terms of these recommended measures.Models of the instabilities may include both stationary and non-stationary random processes as well assystematic processes. Concerning the apparently random processes, considerable progress has been made[IEEE-NASA, 1964; IEEE, 19721 in characterizing these processes with reasonable statistical models. In contrast,the presence of systematic changes of frequencies such as drifts should not bg modelled statistically, but should bedescribed in some reasonable analytic way as measured with respect to an adequate reference standard, e.g., linearregression to determine a model for linear frequency drift. The separation between systematic and random partshowever is not always easy or obvious. The systematic effects generally become predominant in the long term, andthus it is extremely important to specify them in order to give a full characterization of a signal’s stability. ThisReport presents some methods of characterizing the random processes and some important types of systematicprocesses.Since then, additional significant work has been accomplished. For example, Baugh [1971] illustrated theproperties of the Hadamard variance - a time-domain method of estimating discrete frequency modulationsidebands - particularly appropriate for Fourier frequencies less than about 10 Hz; a mathematical analysis ofthis technique has been made by Sauvage and Rutman (19731; Rutman [1972] has suggested some alternativetime-domain measures while still giving general support to the subcommittee’s recommendations; De Prins cf al.(19691 and De Prins and Comelissen. [1971] have proposed alternatives for the measure of frequency stability inthe frequency domain with specific emphasis on sample averages of discrete spectra. A National Bureau ofStandards Monograph ,devotes Chapter 8 to the “Statistics of time and frequency data analysis” [Blair, 19743. Thischapter contains some measurement methods, and applications of both frquencydomainand time-domainmeasures of frequency/phaseinstabilities. It also describes methods of conversion among various time-domainmeasures of frequency stability, as well as conversion relationships from frequency-domainmeasures to timedomain measures and vice versa. The effect of a finite number of measurements on the accuracy with which thetwo-sample varianceis determinedhas been specified [Lesage and Audoin,1973, 1974 and 1976;Yoshimura, 1978). Box-Jenkins-typemodels have been applied for the interpretationof frequency stabilitymeasurements [Barnes, 1976; Percival, 19761 and reviewed by Winkler 11976).Lindsey and Chie [1976] have generalized the r.m.s. fractional frequency deviation and the two-samplevariance in the sense of providing a larger class of time-domain oscillator stability measures. They have developedmeasures which characterize the random time-domain phase stability and the frequency stability of an oscillator’ssignal by the use of Kolmogorovstructure functions. These measures are connected to the frequency-domainstability measure S,,(fi via the Mellin transform. In this theory, polynominal type drifts are included and sometheoretical convergence problems due to power-law type spectra are alleviated. They also show the closerelationship of these measures to the r.m.s. fractional deviation [Cutler and Searle, 1966) and to the two-samplevariance [Allan, 19661. And finally, they show that other members from the set of stability measures developed areimportant in specifying performance and writing system specifications for applications such as radar, communications, and tracking system engineering work.Other forms of limited sample variances have been discussed [Baugh, 1971; Lesage and Audoin, 1975;Boileau and Picinbono. 19761 and a review of the classical and new approaches has been published[Rutman, 1978).* See AppendixNote# 23TN-162
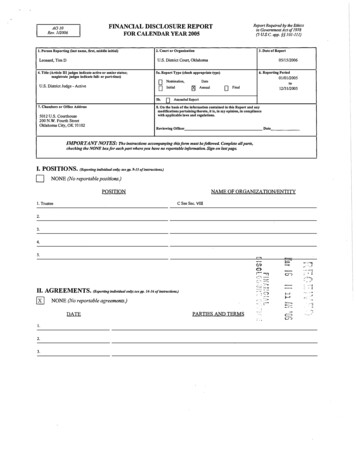
Rep. 580-2143Frequency and phase instabilities may be characterized by random processes that can be representedstatistically in either the Fourier frequency domain or in the time domain [Blackman and Tukey, 19591. Theinstantaneous, normalized frequency departure y(r) from the nominal frequency vs is related to the instantaneousphase fluctuation p(r) about the nominal phase 21 0 I by:1y(r) - znvWOdrox(r)-do- g(1)g0where2.x(r)is the phase variation expressed in units of time.Fourier frqoencydomaiuIn the Fourier frequency domain, frequency stability may be defined.frequency ranges from 0 to w) spectral densities such as:W3of y(r). & Aof cp(0, WIof &r), &tflby several one-sided (the Fourierof x(r), etc.These spectral densities are related by the equations:(4)Power-law spectral densities are often employed as reasonable models of the random rtuctuations inprecision oscillators. In practice, it. has been recognized that these random fluctuations are the sum of fiveindependent noise processes and he&e: 2for 0 / -C fAz h,f’a -2(90for/ fhwhere &‘s are constants, a’s are integers, and fh is the high frequency cut-off of a low pass filter. Equations (2),(3) and (4) are correct and consistent for stationary noises including phase noise. High frequency divergence iseliminated by the restrictions on f in equation (5). The identificationand characterization of the five noiseprocesses are given in Table I, and shown in Fig. 1. In practice, only two or three noise processes are sufficient todescribe the random frequency fluctuations in a specific oscillator; the others may be neglected.3.TimedomaiuRandom frequency instability in the time-domain may be defined by several sample variances. Therecommended measure is the two-sample standard deviation which is the sottare root of the two-sample zerodead-time variance av2(r) [van Neumann cr al., 1941; Allan, 1966; Barnes l r ai, 19711 defined as:u)?(t) ( Jj ,-&I2where4 ;I ‘k t. I ‘ky(r)(6) dr xk tz -5andrk , r (adjacent samples) denotes an infinite time average. The xk and xk t are time residual measurements made at r& andr& 1 I r& T, k 0, 1, 2, . . ., and 11 is the fixed sampling rate which gives zero dead time between frequencymeasurements. By “residual” it is understood that the known systematic effects have been removed.TN-163
144Rep. SO-2If the initial sampling rate is specified as l/x0, then it has been shown [Howe cr al, 19811 that in geneAone may obtain a more efficient estimate of u,.(r) using what is called “overlapping estimates”. This estimate isobtained by computing equation (7).N-lm10; CT) *2(N(7)-where N is the number of original time departure measurements spaced by Q,, (N I M 1, where M is thenumber of original frequency measurements of sample time, 0) and r mre. The corresponding confidenceintervals [Howe et al., 19811, discussed in Q 6, are smaller than those obtained by using equation (12). and theestimate is still unbiased.If dead time exists between the frequency departure measurements and this is ignored in computingequation (a), it has been shown that the resulting stability values (which are no longer the Allan variances), will bebiased (except for the white frequency noise) as the frequency measurements are regrouped to estimate the stabilityfor mro (m 1). This bias has been studied and some tables for its correction published [Barnes, 1969;Lesage, 1983).A plot of au(r) versus r for a frequency standard typically shows a behaviour consisting of elements asshown in Fig. 1. The first part, with cry(r) - T-“ (white frequency noise) and/or a,(r) - T-I (white or flickerphase noise) reflects the fundamental noise properties of the standard. In the case where a,.(r) - r-i, it is notpractical to decide whether the oscillator is perturbed by white phase noise or by flicker phase noise. Alternativetechniques are suggested below. This is a limitation of the usefulness of U,(T) when one wishes to study the natureof the existing noise sources in the oscillator. A frequency-domain analysis is typically more adequate for Fourierfrequencies greater than about 1 Hz. This T-I and/or T- I’* law continues with increasing averaging time until theso-called flicker “floor” is reached, where Usis independent of the averaging time T. This behaviour is found inalmost all frequency standards; it depends on the particular frequency standard and is not fully understood in itsphysical basis. Examples of probable causes for the flicker “floor” arc power supply voltage fluctuations, magneticfield fluctuations, changes in components of the standard, and microwave power changes. Finally the curve showsa deterioration of the stability with increasing averaging time. This occurs typically at times ranging from hours todays, depending on the particular kind of standard.A “modified Allan variance”, MOD U:(T), has been -developed [Allan and Barnes, 19811 which has theproperty of yielding different dependences on T for white phase noise and flicker phase noise. ‘The dependencesfor MOD U,.(T) are T- '* and T-' respectively. The relationships between cry(r) and MOD U,(T) are also explainedin [Allan and Barnes, 1981; IEEE 1983. Lesage and Ayi, 19841. MOD U,(T) is estimated using the followingequation:MOD1a; (T) 2 m*(N-3m 1)‘-: Ij-,[ “5’(Xi zm -2Xi n Xi)]where N is the original number of time measurements spaced by TO, and T mro the sample timeProperties and confidence of the estimate are discussed in Lesage and Ayi 119841. Jones and XyonBarnes er al. [1982] have developed maximum likelihood methods of estimating U,,(T) for the specificwhite frequency noise and random walk frequency noise, which has been shown to be a goodobservation times longer than a few seconds for caesium beam standards.4.(8)i-jof choice.(19831 andmodels ofmodel forConversion between frequeocy aod time domainsIn general, if the spectral density of the normalized frequency fluctuationsvariance can be computed [Barnes et al., 1971; Rutman, 1972):fhU,‘(T) 2’ (‘Isin4nT/S,(j)is known, the two-sampledJ(9)(ltT/)2TN-164
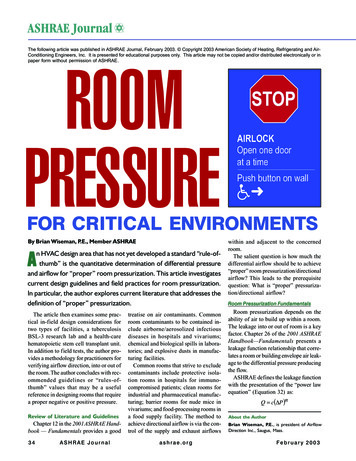
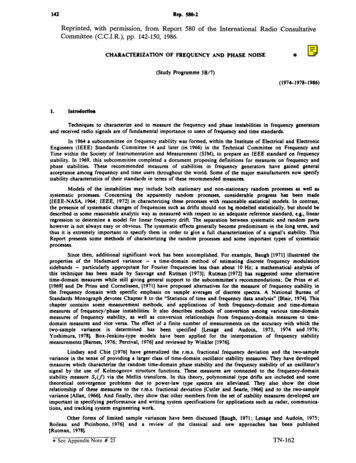
Rep. 580-214sliiikiiiiiiiiii1111iiiijI I I I I11.1l111lIIIFourier frequency1 - Slope chamcten’sticsII-II-SamplingtimeFIGUREIof the five independent noise pmcesses(log scale)Specifically, for the power law model given by equation (5). the time-domainpower law as derived by Cutler from equations (5) and (9).U,‘(T) -h-2w-6r h-,2log.2 h, h,1.038 3 10&(2xh(2x)2 T2Note. - The factor 1.038 in the fourth term of equation (10) is differentpublications.measure also follows theT) &L(2n)Z T2(10)from the value given in most previousTN-165
146Rep. 580-2The values of h, are characteristics of oscillator frequency noise. One may note for integer values (as oftenseems to be the case) that )r - -a - I, for - 3 5 a S 1, and u - 2 for a Z 1 where cr: (T) - r@.These conversions have been verified experimentally [Brandenberger et al., 19711 and by computation[Chi, 19771. Table II gives the coefficients of the translation among the frequency stability measures from timedomain to frequency domain and from frequency domain to time domain.The slope characteristics of the five independentdomains in Fig. 1 (log log scale).5.Measurementnoise processes are plotted in the frequencyand timetechniquesThe spectral density of phase fluctuations S,(fi may be approximately measured using a phase-lockedloop and a low frequency wave analyzer [Meyer, 1970; Walls et al., 19761. A double-balanced mixer is used as thephase detector in a lightly coupled phase lock loop. The measuring system uses available state-of-the-art electroniccomponents; also a very high quality oscillator is used as the reference. For very low Fourier frequencies (wellbelow 1 Hz), digital techniques have been used [Atkinson er al., 1963; De Prins ef al., 1969; Babitch andOliverio, 19741. New methods of measuring time (phase) and frequency stabilities have been introduced withpicosecond time precision [Allan and Daams, 19751, and of measuring the Fourier frequencies of phase noise with30 dB more sensitivity than the previous state of the art [Walls er al., 19761.Several measurement systems using frequency counters have been used to determine time-domain stabilitywith or without measurement dead time [Allan. 1974; Allan and Daams, 19751. A system without any counter has’ also been developed [Rutman, 1974; Rutman and Sauvage, 19741. Frequency measurements without dead time canbe made by sampling time intervals instead of measuring frequency directly. Problems encountered when deadtime exists between adjacent frequency measurements have also been discussed and solutions recommended[Blair, 1974; Allan and Daams, 1975; Ricci and Peregrine, 19761. Discrete spectra have been measured byGroslambert ef al. [1974].6.Confidencelimitsof time domainmeasurementsA method of data acquisition is to measure time variations xi at intervals 10. Then u,(r) can be estimatedfor any r nro (n is any positive integer) since one may use those 3 values for which i is equal to nk. Anestimate for a,(r) can be made from a data set with M measurements of Jrj as follows:(11)or equivalent%(7)sI.&y;:2 1/2(xj 2-2xj lThus, one can ascertain the dependence of or(r) as a functionFor a given data set, M of course decreases as n increases. 9)1(12)of T from a single data set in a very simple way.To estimate the confidence interval or error bar for a Gaussian type of noise of a particularobtained from a finite number of samples [Lesage and Audoin, 19731 have shown that:Confidence IntervalI, u,(r). & . M-“2for M 10(13)where:M: total number of data points used in the estimate,a:as defined in the previous section,K2 ICI 0.99,ICY 0.87.K-I-K-2 0.75.value cry(r)0.77,TN-166
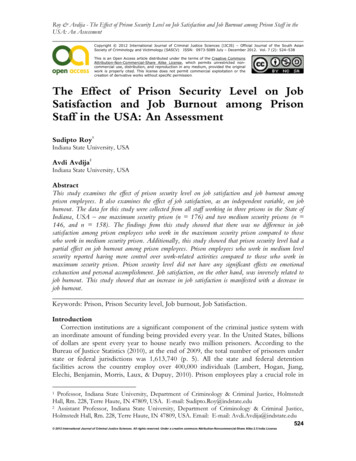
Rep. HO-2As an example of the GaussianUy(T - 1 second) - 10-12, one may write:& pI u,(r) * I& ’ M-“’modelwith- u,(r)147M - 100, a - - 1 (flicker* (0.77) * (100)-“2frequency- U,(l) * (0.077),noise)and(14)which gives:fJ,o- 1 second) -(1 f 0.08) x lo-”(19A modified estimation procedure including dead-time between pairs of measurements has also beendeveloped [Yoshimura, 19781, showing the influence of frequency fluctuations auto-correlation.7.ConclusionThe statistical methods for describing frequency and phase instability and the corresponding power lawspectral density model described are sufficient for describing oscillator instability on the short term. Equation (9)shows that the spectral density can be unambiguously transformed into the time-domain measure. The converse isnot true in all cases but is true for the power law spectra often used to model precision oscillators.Non-randomvariations are not covered by the model described. These can be either periodic ormonotonic. Periodic variations are to be analyzed by means of known methods of harmonic analysis. Monotonicvariations are described by linear or higher order drift terms.TABLEI -7hrfinctionalcharacteristics offive independent noise processesfor frcquenqv instability of oscillatorslime-domaineDescription of noise processFlicker phase1White phase2-10-2-I-2-1m-167
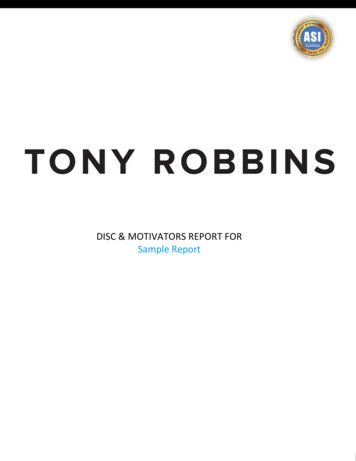
Rep. 580-2148TABLEII -frequencyDescriptionRandomTranslation o/fequencystability measures from spectral densities indomain to variance in time domain and vice versa ( or 2r1&r I)of noise processwalk frequencyFlicker frequencyWhite frequencyFlicker phaseWhite phaseD 1.038 3 IO& (2njhT)4nsB-2lO&2c-l/2REFERENCESALLA-N.ALLAN,D. W. [February, 1966) Statistica of atomic frequency standards. Rot. IEEE, Vol. 54, 221-230.D. W. [December, 19743 The measurement of frequency and frequency stability of precision oscillators. Proc. 6thAnnual Precise Time and Time Interval (PTTI) Planning Meeting NASA/DOD(US Naval Research Laboratory,Washington, DC), 109-142.ALLAN, D. W. and BARNES, J. A. [May, 19811 A modified “Allan Variance” with increased oscillator characterization ability.Proc. 35th Annual Symposiumon Frequency Control. Philadelphia,PA, USA (US Army Electronics Command,Ft. Monmouth,NJ 07703). 470-476 (Electronic Industries Association, Washington, DC 20006. USA).ALLAN,D. W. and DAAMS,H. [May,Symposium on Frequency Control,19751 Picosecond404-41 I.ATKINSON,W. K., FEY, L. and NEWMAN,J. [February,quartz oscillators. Rot. IEEE, Vol. 51, 2, 379.time differencemeasurementsystem. Proc. of the 29th Annual1969 Spectrum analysis of extremelylow-frequencyvariationsofBABITCH,D. and OLIVERIO,J. 11974) Phase noise of various oscillators at very low Fourier frequencies. Rot. of the 28thAnnual Symposium on Frequency Control, 150-159.BARNES, J. A. [January, I%91 Tables of bias functions, Bi and Br, for variances based on finite samples of process&withpower law spectral densities. Tech. Note No. 375, National Bureau of Standards, Washington, DC. USA.BARNES, J. A. [August, 19761 Models for the interpretation of frequency stability measurements. NBS Technical Note 683.BARNES,J. A., CHI, A. R., CUTLER,L. S., HEALEY,D. J., LEESON,D. B. McGUNIGAL.T. E. MULLEN,J. A.,SMITH, W. L., SYDNOR.R., VESSOT. R. F. and WINKLER,G. M. R. [May, 19711 Characterizationof frequencystability. IEEE Trans. Instr. Meas., Vol. IM-20, 105-120.BARNES,J. A., JONES, R. H., TRYON.P. V. and ALLAN. D. W. [December, 19821 Noise models for atomic clocks. Rot.14th Annual Recise Time and Time Interval (PITI)Applicationsand Planning Meeting, Washington, DC, USA,295307.BAUGH, R. A. [1971] Frequency modulationanalysis with the Hadamard variance. Rot. 25th Annual Symposium on FrequencyControl, 222-225.BLACKMAN,R. B. and TUKEY,J. M. (1959) The measurementof power spectra. (Dover Publication,Inc., New York, N.Y.).TN-168
Rep. 580-2BLAIR.B. E. (Ed.) [May, 19741 Time and frequency:Printing OflIce, Washington, DC. 20402).BOILEAU,hm.E. and PICINBONO,B. [March,Meas, Vol. 25, 1. 66-75.149theory and fundamentals.19761 StatisticalNBSMonographstudy of phase fluctuationsNo. 140. (US Governmentand oscillatorstability.IEEETrans.BRANDENBERGER,H., HADORN,F., HALFORD,D. and SHOAF, J. H. 11971) High quality quartz crystal oscillators:frequency-domainand time-domainstability. ROC. 25th Annual Symposium on Frequency Control, 226-230.CHI,A. R. [December,measurements.MD, USA.CUTLER,19771 The mechanics of translation of frequency stability measures between frequency and time-domainRot. 9th Annual Precise Time and Time Interval (PTTI) Applicationsand Planning Meeting, Greenbelt,L. S. and SEARLE, C. L. [February, 19661 Some aspects of the theory and measurementfrequency standards. Rot. IEEE, Vol. 54, 136- 154.DE PRINS,J. and CORNELISSEN,DE PRINS. J., DESCORNET,oscillator phase stability.GROSLAMBERT,IEEEHOWE,G. [October,of frequency fluctuations19711 Analyse spectrale discrete. Eurocon (Lausanne,inSwitzerland).G., GORSKI,M. and TAMINE.J. [December, 19691 Frequency-domainTrans. Insrr. und Meus., Vol. IM-18, 251-261.interpretationofIEEEJ., OLIVIER,M. and UEBERSFELD,4, 518-521.J. [December,19741 Spectral and short-termstabilitymeasurements.Meas., Vol. IM-23Trans. Insrr.D.A., ALLAN,D. W. and BARNES,J. A. [May, 19811 Properties of signal sources and measurement.Proc.35th AnnualSymposiumon Frequency Control,Philadelphia,PA, USA (US Army ElectronicsCommand,Ft. Monmouth,NJ 07703). 669-717 (Electronics Industries Association, Washington, DC 20006, USA).IEEE [May,19721 Special issue on time and frequency. hoc. IEEE, Vol. 60, 5.IEEE [1983] Frequency Sfability:IEEE-NASAJONES,R. H. and TRYON,LESAGE,Fundamentalsand Measuremenr,[I9643 Proceedings of Symposiumon short-termP. V. [January-February,P. [1983] Characterization77-80. Ed. V. F. Kroupa.frequency stability.19831 Estimatingof frequency stability:1, 204-207.IEEEPress Books.NASA PublicationSP 80.time from atomic clocks. NBS Res., Vol. 88, 1, 17-24.Bias due to the juxtapositionof time intervalmeasurements.IEEETrans. Insrr. Meas. Vol. IM-32,LESAGE,P. and AUDOIN.measurements. IEEEF. [June, 19733 Characterizationof frequency stability:Meas. Vol. IM-22. 1, 103.uncertaintydue to the finitenumber ofTrans. Insrr.LESAGE,P. and AUDOIN,C. [March, 19741 Correction to: Characterizationof frequencynumber of measurements. IEEE Trans. Insrr. Meas., Vol. IM-23, 1, 103.LESAGE.P. and AUDOIN,F. [May, 19751 A time domain method for measurement of the spectral density of frequencyfluctuations at low Fourier frequencies. Proc. of the 29th Annual Symposium on Frequency Control, 394403.LESAGE,P. and AUDOIN,C. [September, 19761 Correction to: Characterizationfinite number of measurements. IEEE Trans. /mfr. hfeus., Vol. IM-25, 3.LESAGE,P. and AYI, T. [December, 19841 Characterizationof frequency stability:properties of its estimate. /EEE Trans. Insrr. Meos., Vol. IM-33, 4. 332-336.LINDSEY,W.C.Rot.MEYER,IEEE,and CHIE,C. M. [Dece.mber.Vol. 64. 1662-1666.D. G. [November,Trans. Instr.of oscillator19701 A test set for the accurate measurements215-227.of frequencyuncertaintystability:basedof phase noise on high-qualitydue to theAllan variance anduponmodel of long-termatomic clock behavior.structurefunctions.signal sources. IEEEProc. of the 30th AnnualD. W. and PEREGRINO,L. [June, 19761 Phase noise measurement using a high resolutionprocessing. Proc. of the 30th Annual Symposium on Frequency Control.RUTMAN,uncertaintyanalysis of modifiedinstabilitydue to finiteMeus., Vol. IM-19.PERCIVAL,D. B. [June, 19761 A heuristicFrequency Control.RICCI,1976) Theorystability:J. [February,1972) Commenton characterizationof frequency stability.IEEETrans. Insrr.Symposiumoncounter with on-linedataMeos., Vol. Ihl-21,2. 85.RUTMAN.J. [March, 19741 Characterizationof frequency stability: a transfer function approachmeasurements via liltering of phase noise. IEEE Truns. Insfr. Meos., Vol. IM-23, 1, 40-48.and its applicationRUTMAN,J. [September, 19781 Characterizationof phase and frequency instabilitiesyears of progress. Proc. IEEE, Vol. 66, 9, 1048-1075.in precisionRUTMAN,J. and SAUVAGE, G. [December, 19741 Measurement of frequency stabilityfiltering of phase noise. IEEE Trans. Insfr. Meas. Vol. IM-23, 4. 515. 518.in the time and frequency domainsfrequency sources: fifteenSAUVAGE. G. and RUTMAN,J. [July-August, 19731 Analyse spectrale du bruit de frequence des oscillateursHadamard. Ann. des TtGcom., Vol. 28, 7-8, 304-314.VON NEUMANN,J., KENT, R. H., BELLINSON,Math. Sfor., 12. 153-162.H. R. and HART,toviapar la variance deB. I. 119411 The mean square successive difference. Ann.WALLS,F. L., STEIN,S. R., GRAY, J. E. and GLAZE, D. J. [June, 19761 Design considerationsin state-of-the-artprocessing and phase noise measurement systems. Proc. of the 39th Annual Symposium on Frequency Control.WINKLER,G. M. R. [December, 19761 A brief review of frequency stability measures. Proc. 8th Annual Precise Time and TimeInterval (PITI) Applications and Planning Meeting (US Naval Research Laboratory, Washington,DC), 489-528.YOSHIMURA,K. [March,fluctuations. IEEE19781 CharacterizationTruns. Insrr.of frequency stability:1, 1-7.Uncertaintydue to the autocorrelationsignalof the frequencyMeas., IM-27TN-169
150Rep. 580-2,738-2BIBLIOGRAPHYALLAN.D. W. d 01. 119731 Performmce.modelling,Symposium on Frequency Control, 334346.FISCHER.hi. C. [December,19761 Frequency stability measurementprocedures. ‘Rot.8th Annual Precise Time and Timelntervrl (PlTI) Applicationsand Planning Meeting (US Naval Research Laboratory,Washington, DC), 575618.HALFORD.D. [March,l/I/I.MANDELBROT,I&hr.l%S] A general mechanicalIEEE (Corns.).B. [April,and simulationmodel for l/l.of somecresiumspear81 densitybeam clocks.Rot.noise with special reference27th Annualto flickernoiseVol. 56. 3, 251-258.1967) Some noises withl//spectrum.a bridge betweendirect currentand whitenoise. IEEETmru.771eory Vol. IT-13, 2, 289.298.RUTMAN,J. and UEBERSFELD,233-235.VANIER.J. and TETU. M. (19781 Time domain measurement of frequency stability: 8 tutorial approach. Proc. 10th AnnualPrecise Time and Time Interval (PTTI) Applicationsand Plrnnins Meeting, Washington,DC, USA, 247-291.VESSOT,R. 11976) FrquencyJ. [February,and Time Standards.19721 A model for flickerChap. 5.4 Methodsfrequencyof Experimentalnoise of oscillators.Physics,of oscillatorRot.IEEE, Vol. 60.2,Academic Press, 198-227.VESSOT,R. MUELLER,L. and VANIER,J. [February,19661 The specificationmade in the frequency domain. J oc. IEEE, Vol. 54. 2, W-207.charsaetisticsWINKLER.G. M. R. HALL, R. G. and PERCIVAL,D. B. [October, 19701 The US Naval Observatorythe performanceof a sample of atomic clocks. MerroJogiu, Vol. 6, 4. 126-134.from measurementsclock time reference andTN-170
142 Rep. 58&2 Reprinted, with permission, from Report 580 of the International Radio Consultative Committee (C.C.I.R.), pp. 142-150, 1986. CHARACTERlZARON OF FREQUENCY AND PHASE NOISE . Time within the Society of Instrumentation and Measurement (SIM), to prepare an IEEE standard on freque