Transcription
Maritime Economics & xSPECIAL ISSUE: MARITIME AND PORT GOVERNANCEAlternative approaches to measuring concentration in linershippingOlaf Merk1 · Antonella Teodoro2Accepted: 12 February 2022 The Author(s), under exclusive licence to Springer Nature Limited 2022AbstractShipping has always had a special relationship with competition law and economics.Even if special competition law regimes for the shipping industry continue to exist,most countries nowadays accept the notion that shipping markets should be morecompetitive. Competition authorities monitor this in a more or less regular fashion,with various market concentration indexes. The liner shipping industry is peculiar inits widespread cooperation schemes between carriers, in the form of vessel sharingagreements, also known as consortia. Carriers engage in cooperation with all of theirmajor competitors in a system of consortia that is highly interlinked. This bringsconsiderable risks of abuse of market power. Yet, the system of inter-linked consortia has never been systematically mapped, nor do competition authorities appearto monitor them. This article addresses this gap, by proposing alternative indicators, in addition to the traditional industry concentration indexes such as the Herfindahl–Hirschman Index (HHI), that take the reality of consortia into account. Here,five possible alternative indicators are considered: the market share of consortia andindependent operators; the share of consortia exceeding market share thresholds; theindustry market concentration of consortia; a modified HHI that takes consortia intoaccount; and interlinkages between consortia. We analyse the current state of concentration of liner shipping on the basis of these indicators using a new and uniquedatabase that contains deployed ship capacity of container carriers on all of theirliner services. Based on this dataset we provide an overview of differences in industry concentration across world regions and developments over time. Traditional indicators show an increase in industry concentration. For example, over the trade corridors to and from Northern Europe, the HHI scores in 2006 ranged from 604 to 2463,and from 1164 to 4882 in 2021. The alternative criteria show additional industryconcentration. We show that in 2021, 704 out of more than 1500 agreements amongcarrier consortia had a combined market share of at least 30%, and 102 of them hada combined market share of at least 50%. We also observe that in 2021, the carriers active in alliances operated 85% of the consortia capacity. Although carriersthat are in the same alliance operate most of these consortia, it is also noteworthythat carriers that are not in the same alliance operate a considerable part (24%) ofExtended author information available on the last page of the articleVol.:(0123456789)
O. Merk, A. Teodorothe consortia. Our calculations of modified Herfindahl–Hirschman Index (MHHI)indexes that take consortia into account show that industry concentration is higherwhen consortia are taken into account: for example on the trade corridor NorthernEurope-North America East Coast, the MHHI has reached the threshold of 2500points, despite an HHI score of around 1500. In the conclusion of the article, weput forward ways in which these alternative indicators could be used by competitionauthorities.Keywords Container shipping · Alliances · Consortia · Vessel sharing agreements ·Liner shipping concentration · Market power1 IntroductionThe relationship between shipping and competition has always been peculiar. Forlong periods in history, liner shipping consisted of local or regional monopolies,facilitated by navigation laws that protected national shipping companies ratherthan promote competition. Even when navigation laws became gradually less protectionist, liner shipping has since 1875 been characterised by cartels, called shipping conferences, that managed to survive for a long time despite strong resistancefrom shippers and governments (Marx 1953; Ortiz Blanco 2007). Protection of theEuropean oligopoly in liner shipping has been considered to be one of the constituent elements of the post-WW II Atlantic policy consensus on shipping (Cafruny1987). Liner shipping conferences started to lose relevance in the 1990s, also thanksto changes in regulatory regimes in the US and the EU, following an OECD reportthat was critical of liner conferences (OECD 2002). However, conferences continueto be allowed in several countries, including transhipment hubs such as Singapore.Many countries continue to grant a special status to liner shipping in their competition laws, by exempting it from parts of regular competition law and grantingit privileges that other sectors do not have. Countries with such shipping-specificblock exemptions include Hong Kong, Australia, New Zealand and Chile. The EUhas a consortia block exemption regulation in place to facilitate cooperation betweenliner shipping companies via consortia. Such regulation allows joint negotiationwith service providers, such as terminal operators and towage companies, and jointcapacity management by consortia. These privileges have come under increasedscrutiny since container carriers managed to improve the prices for their services(ocean freight rates) and their profitability in 2020, at least in part thanks to theirability to withdraw ship capacity when demand for container transport slumped inthe first half of 2020.Despite the shipping-specific privileges, most countries nowadays accept thepremise that shipping markets should be competitive. Competition authorities monitor this in a more or less regular fashion, with the regular market concentrationindexes that form the standard tools of competition authorities throughout the world.This article argues that these standard tools ignore a specificity of the liner shipping industry, namely the widespread cooperation between carriers, in the form of
Alternative approaches to measuring concentration in liner vessel sharing agreements (also called consortia) and alliances that can be considered bundles of such agreements, both of which have become more important overtime (ITF 2018, 2019). Consortia and alliances are used by carriers to increase theutilisation rate of their vessels: sharing vessels makes it possible for carriers to offera (shared) service network that they would not be able to offer on their own. At thesame time, the emergence of consortia and alliances has reduced choice for shippersand increased the buying power of carriers, and thus the oligopsony risks vis-à-visports and port service providers. So consortia could entail, as it does, considerablerisks of abuse of market power that conventional market concentration indexes couldmiss. We propose alternative approaches to measuring concentration in liner shipping that take account of the reality of shipping consortia and alliances. Such alternative measurement approaches could help competion authorities to identify andmitigate abuses of market power in liner shipping.2 Existing approaches and their limitationsOne of the most frequently used indicators to estimate industry concentration is themarket share of the largest companies operating in the market, in particular the fourfirm concentration ratio ( CR4), i.e., the cumulative market share of the four companies with the largest market share. Another indicator frequently used in competitionassessments is the Herfindahl–Hirschman Index (HHI), calculated by squaring themarket share of each competing firm in an industry and then summing the resultingnumbers. Sometimes the calculation is made on a more limited set of firms, e.g. thelargest 50 companies, if it is challenging to obtain data for all the companies, andalso because the squared market share of the smallest firms would hardly changethe value of the index. Scores can range from 0 to 10,000 points, but can also beexpressed as fractions ranging from 0 to 1.0: an index of 0.5 is equivalent to 5000points. A market with an HHI higher than 2500 points is considered to be highlyconcentrated under the US merger guidelines (US Department of Justice and FTC,2010), whereas EU merger guidelines indicate that the European Commission isunlikely to identify horizontal competition concerns in a merger with a post-mergerHHI between 1000 and 2000 and a delta (change in HHI) below 250, or a mergerwith a post-merger HHI above 2000 and a delta below 150 (EC, 2004).Various academic studies have applied the C R4 and HHI-indicators to liner shipping. All of them define market shares in terms of capacity shares, which is differentfrom the application in many other industries where market shares are defined in termsof revenues. This difference can be explained by the lack of data on revenues for carriers per trade route. A fairly common approach is to apply the CR4 and HHI to the globalcontainer shipping market (see e.g., Goulielmos 2017; Luo et al. 2014; Sys 2009). Thesame indicators are also applied in various studies that deal with specific liner shippingmarkets, for example on the main East–West trades (Hirata, 2017) and the Korean linershipping industry (Ha & Seo, 2013). Specialised maritime consultants sometimes alsomade similar assessments. However, there are no studies that assess the development ofthese market concentration indexes for all different trade routes comprehensively over
O. Merk, A. Teodorotime. This study will fill that gap, in addition to proposing five new alternative indicators for assessing market concentration.Competition authorities have applied competition assessments of the liner shippingmarket using analysis of market shares. In the EU’s assessments of mergers in linershipping, the combined market shares of the alliances and consortia of the mergingcompanies are taken into account (see for example EC 2016a, 2016b, 2017a, 2017b),but not the HHI scores. The analysis is specific to the companies that merge and onlytakes place at the moment of the merger decision; there is no regular, comprehensiveassessment on the competitive effects of consortia.The existence of consortia is generally not taken into account in these analyses. Anillustration of this neglect is the content of the document that is meant to justify theextension until 2024 of the EU Consortia Block Exemption Regulation (EC, 2019): itadmits to lacking data on consortia that cover EU trades and the market shares of theseconsortia, despite the fact that the regulation contains a market share threshold of 30%above which the regulation no longer applies. The system of inter-linked consortia hasnever been systematically mapped, nor do competition authorities appear to monitor it.This likely leads to underestimation of market concentration in liner shipping, similarto underestimations of market concentration in the presence of “common ownership”.Common ownership refers to situations in which one or more owners of a companyalso own shares in one or more competing companies in the same industry (OECD,2017). The basic insight is that concentration could be underestimated if firms are supposed to behave fully independently, despite their underlying ownership. Commonownership can be limited to a single partial ownership interest, in a single acquiredform by a single acquiring firm. However, the economic framework of common ownership has also been extended to the case of joint ventures, that is, entities that are ownedby and compete with a number of competing firms. Joint ventures may be horizontal, vertical or both. A horizontal joint venture is a jointly owned entity whose parentscompete with the venture and each other. A vertical joint venture is a jointly ownedentity whose parents supply input to the venture, or produce outputs using an inputproduced by the venture. Joint ventures also can involve both vertical and horizontalelements. For example, a joint venture may be jointly owned by firms that are verticallyintegrated and compete with the venture and each other in at least one of the markets(O’Brien and Salop 2015).Consortia could be considered as vehicles for what has been referred to in the competition literature as “common ownership”, applied to container shipping. Consortiacould be considered joint ventures of two or more container carriers that pool ships toprovide a jointly operated shipping service. On some trade corridors, carriers provideall their capacity via consortia, on other corridors consortia compete with services provided by carriers individually, and—more rarely—on some other corridors all servicesare offered by carriers individually.
Alternative approaches to measuring concentration in liner 3 Alternative indicatorsNew approaches to measuring competition in liner shipping should take the realityof consortia into account, because the emergence of consortia is not simply a development that takes place in parallel with industry consolidation, but has arguably itsown dynamics and could—in combination with consolidation—have more profoundimpacts than traditional indicators, or other metrics such as the reduction of thenumber of shipping companies (see Hoffmann and Hoffmann, 2021) could capture.This approach intends to capture industry concentration on the shipping-side.The definition of the relevant market is the maritime trade corridor between twosets of ports, as constituted by actual liner shipping services. Container carriers arealso active in other markets, such as container terminals and logistics services, butthese fall outside the scope of this article. Here, five possible alternative indicatorsare proposed, covering: the market share of consortia and independent operators;the share of consortia exceeding market share thresholds; the industry concentrationof consortia; a modified HHI that takes consortia into account; and interlinkagesbetween consortia. These are explained briefly below.3.1 Market share of consortia and independent operatorsAn elementary but essential indicator is the share of liner shipping capacity provided by consortia in the different trade corridors. Considering lack of data on revenues per trade route by carriers, market shares are based not on revenues but onshipping capacity. Whereas market shares of alliances are regularly reported by specialized maritime consultants, this is not the case for shares of consortia. A closelyrelated indicator concerns the market share of independent operators on the different trade corridors. Independent operators on a trade corridor are here defined ascontainership operators that do not partake in consortia (or an alliance) on that tradecorridor. They might operate in consortia on other trade corridors and on the lattercorridors are not considered as independent operators.3.2 Share of consortia exceeding combined market share thresholdsThe idea behind this indicator is to assess how many of the consortia operating ona trade route exceed a certain defined market share. Such an indicator would beclosely linked to policies in certain jurisdictions. For example, the EU ConsortiaBlock Exemption Regulation defines a 30% threshold for consortia: if the marketshare of consortia exceeds this threshold the CBER no longer applies to this consortium. We define consortia market share here in the same way as in CBER, namelyas the total market share of consortium members, that means “the total volumes ofgoods carried by the member in the relevant market shall be taken into account irrespective of whether those volumes are carried within the consortium in question,within another consortium to which the member is a party, or outside any consortium, independently by the member on its own, or on third party vessels” (EC 2009).
O. Merk, A. TeodoroIn this way, the assessment takes account of the interlinkages between carriers andconsortia. The consequence of this is that the sum of the combined market shares ona trade route can be more than 100%. In this article, we assess the share of consortiaexceeding combined market share thresholds of 30% and 50%. We are able to monitor the number of consortia that exceed the threshold and also the shipping capacitythat this represents.3.3 Consortia market concentration indexIn order to assess the industry concentration of consortia (including alliances), wedeveloped a Consortia Market Concentration Index (CMCI), both at the level oftrade corridors and at the global level. This Index is closely related to the first twoalternative indicators described above and it is based on four components:1. Percentage of deployed capacity operated by consortia: the ratio between thecapacity deployed by consortia (and their members), and the total capacitydeployed by all shipping lines.2. Percentage of number of services operated by consortia (or their members): theratio between the number of services operated by consortia (and their members)and the total number of services on offer.3. Percentage of shipping lines operating as part of a consortium: the ratio betweenthe number of shipping lines operating as part of a consortium and the total number of active shipping lines on a trade corridor.4. Highest combined consortia market share: the highest combined market share ofany consortium operating on the trade corridor, using the definition of combinedmarket share provide above.The CMCI is the average of the four components multiplied by 100. The CMCIcan, therefore, have values between 0 and 100, with 0 representing a market whereno consortia operate, and 100 representing a market in which all the services areoperated by one or more consortia and where the largest combined consortia marketshare equals 100%. From the CMCI at the trade corridor level, we have then derivedthe CMCI Global, which aims to describe the level of consortia industry concentration at the global level for any given year in the time-series. The MCI Global hasbeen calculated as the weighted average of the MCI at the trade corridor, weightedby the capacity deployed, so that industry concentration on busy trade routes havehigher weights than trade routes with only limited traffic (deployed capacity). Wehave also developed a CMCI Deepsea indicator (for intercontinental container transport) and a CMCI Shortsea (for intracontinental container transport).3.4 Modified HHI to take account of common ownershipIn order to measure market concentration in the presence of common ownership, themodified Herfindahl–Hirschman Index (MHHI) was developed by Bresnahan andSalop (1986) and generalized by O’Brien and Salop (2015). It adapts the typical
Alternative approaches to measuring concentration in liner measure of market concentration (HHI) to take into account ownership links amongcompeting firms.The MHHI consists of two elements: the standard HHI and an “MHHI delta”.The MHHI delta depends on the amount of control or influence that an investor hasin a firm and its competitors, as well as the corresponding financial interests of thefirm and its competitor firms. All else equal, a higher degree of control or influenceby common investors would translate into a stronger link between firms and therefore a higher MHHI, implying higher concentration in an industry. In a situationwith no common or cross ownership ties, the MHHI delta would be zero, and theMHHI would be equivalent to the standard HHI. O’Brien and Salop (2015) identify different cases of corporate control and develop a formula for each situation tocalculate the MHHI delta. At the one extreme is the case of no control at all (silentfinancial interests); at the other extreme is total control via mergers. In between arevarious scenarios of partial control. In these scenarios, the decision makers of theacquired (or partially acquired) firm take into account the fact that certain of itsshareholders hold financial interests in competing firms in addition to the interests inthe acquired firm. Partial controls scenarios that are considered are:– Fiduciary obligation in which control by the acquiring firm is constrained bylegal rules that create an obligation to serve the interests of minority shareholders;– Coasian joint control, in which the managers of the acquiring firm try to maximize the joint profits of both the acquired firm and the acquiring firm. In thisway, they make the same decisions that they would if they were actually merged.– One-way control, which refers to a scenario in which the acquiring firm hasenough power over the acquired firm to force it to maximize joint profits and notsecretly cheat.– Proportional control, a scenario in which managers of the acquiring firm take theshareholders’ interests into account in proportion to their financial interests in theacquired firm, rather than trying to maximize joint profits.Consortia are made up of at least two carriers, which means that no carrier has fullcontrol over the consortium in which they participate. There are no silent financialinterests in consortia. This means that consortia generally fall within the partial control scenarios. Considering that all major carriers deploy the majority of their shipcapacity in consortia, one could argue that carriers’ control of consortia resemblesCoasian joint control and to some extent resembles an actual merger. At the sametime, consortia are also the expression of a compromise between different visionsof the participating carriers, in relation with the capacity that they contribute to theconsortium. For this reason, we assume that the condition of proportional controlapplies to consortia. The MHHI delta related to proportional control is provided inO’Brien and Salop (2015) and is as follows:Δ (𝛽 𝛽 ((1 𝛽)2 𝛽 2 )) s1 s2
O. Merk, A. TeodoroIn this formula, the delta is caused by a partial ownership transaction in whichfirm 1 obtains a financial interest in firm 2 that entitles it to a fraction β of the profitsof firm 2, and the two firms have pre-acquisition market shares of s1 and s2, respectively. The fraction β stands for the fraction of the profits of the acquired firm thatthe acquiring firm is entitled to. In the context of consortia, β stands for the fractionof the capacity that the carrier contributes to the consortium, which generally represents the fraction of the profits of the consortium that the carrier is entitled to. In thecase of joint ventures, in line with O’Brien and Salop (2015), there will be a similar component of the MHHI delta for each partial ownership interest, and these areaggregated to an overall delta. More details on how the MHHI has been calculatedin the context of the liner consortia is provided in Annex 1.3.5 Interlinkages between carriersThis indicator seeks to describe patterns related under which carriers cooperate inconsortia. There is considerable literature on shipping alliances that conceals thefact that carriers also cooperate in consortia, with carriers that are not necessarilypart of the same alliance. By mapping the interlinkages between carriers via theirconsortia, it is possible to establish if cooperation in consortia takes place mostly bycarriers in the same alliance.4 Description of databaseThe main source of this study is the MDS Transmodal Consortia & Alliances Database, a sub-product of a larger database, the MDST Containership Databank. Thisdatabase is built and maintained by the maritime consultancy MDS Transmodal andit contains detailed information on the world’s container fleet; i.e., of some 9,000container vessels. In more detail, for every container vessel in service, the databasehas over 35 fields of information including operator, service, route, TEU, servicefrequency, and port rotation. Next to service deployment, the database providesphysical attributes and details of the container vessels. It also includes informationabout vessels on order and vessels removed from the commissioned fleet. Servicedeployment of individual vessels in the fleet changes frequently, therefore, the database is updated on a continuous basis. The database, in its current format, has beenproduced since 2006. The MDST Containership Databank is also used by UNCTADto produce (in collaboration with MDST) the Liner Shipping Connectivity Index(LSCI) and by the World Bank to produce the Logistics Performance Index (LPI).For any given trade corridor, the MDST Consortia & Alliances Database hasallowed us to identify the services offered by the shipping lines operating in consortia, in alliances or as independent carriers and then to estimate their combinedmarket shares. The MDST Consortia & Alliances Database has been developed following the steps described below:
Alternative approaches to measuring concentration in liner – Starting from the MDST Containership Databank that contains the port-toport service data per ship (with their IMO number), we have grouped the portpairs into trade corridors (e.g., a service calling, among others, at the port ofShanghai and at the port of Rotterdam, has been allocated to the East ChinaSea-North Europe trade corridor). In order to ensure a sufficient level of detailin our analysis, we have split the world into 20 maritime regions, with thecombinations amongst them being defined as ‘trade corridors’ (the completelist of trade corridors and countries/country areas included in them is shownin Annex 2). For 2021, we identified 171 unique trade corridors, of which 154are served by at least one consortium.– For each vessel deployed on any given service, the MDST ContainershipDatabank indicates the name(s) of the shipping line(s) that operate them. Thisinformation has allowed us to identify the services operated by more than oneshipping line, and to assume an agreement in place amongst them. A list ofvessel sharing agreements signed by the shipping lines is not publicly available. We believe, however, that shipping lines operating different vesselsdeployed on the same service can be de-facto considered as part of a VesselSharing Agreement (VSA). In the 154 trade corridors where at least one consortium is active, we identify 1500 joint services amongst the shipping lines.– For each trade corridor, we have also identified the shipping lines operating inalliances.– From the previous steps, we have been able to identify ‘who is doing what,where’. Based on this, we have then estimated the different concentrationindexes described below.In our analysis we have focused on the second quarter of each year, as it can beconsidered the quarter that is generally the least affected by seasonality. However,the databases we used to produce the MCI cover all the quarters of 2006–2021,which allowed us to extend the calculations to the other quarters as well.5 Main findingsThis section assesses if the use of the alternative indicators would bring addedvalue in terms of a deeper understanding of industry concentration in liner shipping. As such, it provides a brief overview of the global values of the mainindicators and their development over time (2006–2021). Within the space constraints of this article, it is not possible to provide a comprehensive and comparative overview across regions. We instead focus on the case of Northern Europeto illustrate the potential use of the alternative indicators. Rather than provideresults for all the 20 trade corridors to and from Northern Europe, we focus ona selection of main trade corridors: the intra-North Europe corridor, the NorthEurope-Mediterranean corridor, North Europe-North America East Coast, NorthEurope-South China Sea and North Europe-South America East Coast.
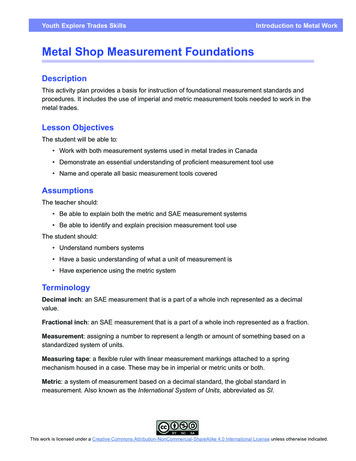
O. Merk, A. Teodoro400035003000North Europe Mediterranean25002000North Europe North America EastCoastNorth Europe North Europe1500North Europe South America EastCoast1000North Europe South China Sea5000Fig. 1 HHI scores on selected North Europe trade corridors5.1 Traditional industry concentration indicatorsThe industry concentration ratios of liner shipping at the global level have oftenbeen described as fairly moderate. However, it is misleading to look at the globallevel; one should instead focus on the level of trade corridors (Haralambides, 2019).When focusing on industry concentration at the level of trade corridors, a more pronounced picture arises. On 53 out of 154 trade corridors in which we identify atleast one consortium, the HHI in 2021 exceeded 2500 points, the threshold abovewhich a market is considered highly concentrated. This is the case for 7 of the 20trade corridors to and from Northern Europe. The market concentration on thesetrade routes, to and from Northern Europe, has clearly become more intense: the2021 HHI scores on 18 out of 20 trade corridors to and from Northern Europe areconsiderably higher in 2021 than in 2006, including the trade corridors selected forour analysis (Fig. 1). The range between the lowest and highest score in 2006 was604 to 2463 points; this was 1164 and 4882 in 2021 (not taking into account theNorth-Europe-East Africa trade corridor that can be considered an outlier).5.2 Capacity deployed by consortia and independent operatorsThe number of consortia has increased substantially over 2006–2021, together withthe capacity they operate. In 2006, around 31% of the global containership capacitywas operated in consortia; this was 49% in 2021. Over the same period, the shareof capacity operated by shipping lines that are members of alliances increased from22% in 2014 to 42% in 2021. This implies that in addition to mergers and acquisitions, further market consolidation has been occurring in the liner shipping industrythrough the formation of consortia amongst the biggest shipping lines.
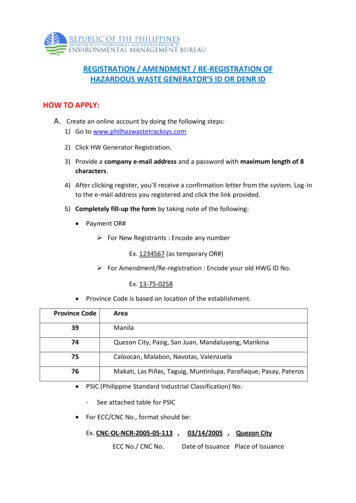
Alternative approaches to measuring concentration in liner 80%70%60%Mediterranean North Europe50%North America East Coast NorthEurope40%North Europe North Europe30%South America East Coast NorthEurope20%South China Sea North Europe10%0%Fig. 2 Capacity share of independent operators on selected North European trade corridorsA different way of looking a
ping conferences, that managed to survive for a long time despite strong resistance from shippers and governments (Marx 1953; Ortiz Blanco 2007). Protection of the European oligopoly in liner shipping has been considered to be one of the constit-uent elements of the post-WW II Atlantic policy consensus on shipping (Cafruny 1987).