Transcription
Miner Deposita (2011) 46:509–539DOI 10.1007/s00126-010-0300-0ARTICLEThe gold content of volcanogenic massive sulfide depositsPatrick Mercier-Langevin & Mark D. Hannington &Benoît Dubé & Valérie BécuReceived: 11 May 2010 / Accepted: 14 June 2010 / Published online: 15 July 2010# Her Majesty the Queen in Right of Canada 2010Abstract Volcanogenic massive sulfide deposits containvariable amounts of gold, both in terms of average gradeand total gold content, with some VMS deposits hostingworld-class gold mines with more than 100 t Au. Previousstudies have identified gold-rich VMS as having an averagegold grade, expressed in g/t, exceeding the total abundanceof base metals, expressed in wt.%. However, statisticallymeaningful criteria for the identification of truly anomalousdeposits have not been established. This paper presents amore extensive analysis of gold grades and tonnages of 513VMS deposits worldwide, revealing a number of importantfeatures in the distribution of the data. A large proportion ofdeposits are characterized by a relatively low gold grade( 2 g/t), with a gradual decrease in frequency towardsmaximum gold grades, defining a log-normal distribution.In the analysis presented in this paper, the geometric meanand geometric standard deviation appear to be the simplestmetric for identifying subclasses of VMS deposits based ongold grade, especially when comparing deposits withinindividual belts and districts. The geometric mean goldgrade of 513 VMS deposits worldwide is 0.76 g/t; thegeometric standard deviation is 2.70 g/t Au. In thisanalysis, deposits with more than 3.46 g/t Au (geometricEditorial handling: B. LehmannGeological Survey of Canada contribution 20090023P. Mercier-Langevin (*) : B. Dubé : V. BécuGeological Survey of Canada,490 rue de la Couronne,Quebec City, QC G1K 9A9, Canadae-mail: pmercier@nrcan.gc.caM. D. HanningtonUniversity of Ottawa,140 Louis Pasteur,Ottawa, ON K1N 6N5, Canadamean plus one geometric standard deviation) are consideredauriferous. The geometric mean gold content is 4.7 t Au,with a geometric standard deviation of 26.3 t Au. Depositscontaining 31 t Au or more (geometric mean plus onegeometric standard deviation) are also considered to beanomalous in terms of gold content, irrespective of the goldgrade. Deposits with more than 3.46 g/t Au and 31 t Au areconsidered gold-rich VMS. A large proportion of the totalgold hosted in VMS worldwide is found in a relativelysmall number of such deposits. The identification of thesetruly anomalous systems helps shed light on the geologicalparameters that control unusual enrichment of gold inVMS. At the district scale, the gold-rich deposits occupy astratigraphic position and volcanic setting that commonlydiffers from other deposits of the district possibly due to astep change in the geodynamic and magmatic evolution oflocal volcanic complexes. The gold-rich VMS are commonly associated with transitional to calc-alkaline intermediate to felsic volcanic rocks, which may reflect aparticularly fertile geodynamic setting and/or timing (e.g.,early arc rifting or rifting front). At the deposit scale,uncommon alteration assemblages (e.g., advanced argillic,aluminous, strongly siliceous, or potassium feldspar alteration) and trace element signatures may be recognized (e.g.,Au–Ag–As–Sb Bi–Hg–Te), suggesting a direct magmaticinput in some systems.Keywords Gold . Volcanogenic massive sulfides . Goldrich VMS . World-class . Base metalsIntroductionGold-rich volcanogenic massive sulfide (VMS) deposits areimportant exploration targets as their gold content contrib-
510ute significantly to their total value and their polymetallicnature makes them less vulnerable to metal price fluctuations. Some deposits are mined primarily for their goldcontent (e.g., Poulsen and Hannington 1996; Dubé et al.2007a). However, there is little consensus in the literatureabout what constitutes a “gold-rich” VMS, in terms of goldgrade or total contained gold. More rigorous criteria areneeded to identify such deposits so that research can befocused on examples that best represent the geologicalattributes associated with gold enrichment. This could helpbetter define key exploration criteria and target areas.The main geological characteristics, mechanisms of goldconcentration, and genetic models for gold-rich VMSdeposits have been reviewed for both ancient and modernsettings (e.g., Hannington et al. 1986; Huston and Large1989; Large et al. 1989; Hannington and Scott 1989a, b;Large 1992a, b; Poulsen and Hannington 1996; Sillitoe etal. 1996; Hannington et al. 1999; Huston 2000; Dubé et al.2007a). It is clear from these and other reviews (e.g.,Franklin et al. 1981, 2005; Franklin 1993; Barrie andHannington 1999; Galley et al. 2007a) that VMS depositscontain highly variable amounts of gold, both in terms ofaverage grade and tonnage, with many VMS deposits beingsignificant gold producers, especially in the last fewdecades. For example, approximately 13% of the goldmined in Canada up to 2003 came from VMS deposits(Lydon 2007) and gold represented about a fifth of the totalvalue of VMS reserves and resources in Canada from 1994to 2005 (Lydon 2007). Similarly, approximately 80% of thegold produced in Sweden from 1999 to 2006 came fromVMS (statistics compiled from the Metals EconomicsGroup, the Bureau de Recherches Géologiques et Minières,and the Geological Survey of Sweden), whereas 15% ofthe gold produced in Tasmania for the same period camefrom VMS (ABARE, Australian Minerals Statistics).Moreover, the relative value of gold in a median gradeVMS deposit (i.e., 0.9 g/t Au, 1.3% Cu and 3.3% Zn) in1950 was about 10% of the total value of the deposit,whereas it was about 23% in 2008, illustrating theincreasing economic importance of the gold content of adeposit. For example, the gold at Horne, Quebec (54 Mtgrading 6.1 g/t Au and 2.2% Cu) was worth about 14% ofthe total value of the deposit based on 1950 gold andcopper prices, whereas it would represent about 57% of thetotal value of the deposit at average prices for 2008.Various classification schemes for VMS deposits basedon their compositions have been used to interpret geodynamic settings and other aspects of ore genesis (e.g.,Hutchinson 1973; Solomon 1976; Franklin et al. 1981).Similar attempts have been made to interpret the geneticaspects specific to “gold-rich” VMS based on Cu–Auversus Zn–Au associations (e.g., Huston and Large 1989;Huston 2000) and the style of mineralization or the oreMiner Deposita (2011) 46:509–539mineralogy (e.g., Poulsen and Hannington 1996; Sillitoe etal. 1996; Hannington et al. 1999; Dubé et al. 2007a).However, it remains unclear how much gold constitutes atruly anomalous enrichment that must reflect special oreforming conditions.When comparing the metal endowment of deposits, it isnecessary to consider both the grade and the size of thedeposit, as well as the metal ratios. In previous studies,gold-rich VMS have been identified as having average goldgrades expressed in ppm or g/t that exceed the combinedcontent of base metals expressed in wt.% (Au g/t or ppm Cu Zn Pb wt.%; Poulsen and Hannington 1996;Poulsen et al. 2000; Dubé et al. 2007a). However, thisapproach misclassifies some “gold-rich” polymetallicdeposits that are accompanied by high grades of basemetals. Conversely, some VMS deposits with a relativelylow gold grade nevertheless produced significant amountsof gold due to their large size. Deposits in which gold canbe mined economically on its own without any contributionfrom base metals could be, although not objectively,considered gold-rich. However, a more rigorous analysisof gold grades and tonnages is presented here. This analysisconsiders the frequency distribution of gold grades in 513deposits worldwide, as well as the absolute gold contents ofthe deposits and the gold-to-base metals ratio. This analysishas identified a group of deposits with truly anomalousgold contents which highlight a number of geologicalattributes that should be targeted in exploration for goldrich VMS.Gold in VMS depositsThe data used in this study are from a global compilation ofVMS deposits in Franklin et al. (2005). Some modificationswere made to the dataset; in particular information ondeposits with a very high average gold grade and depositswith a large total gold tonnage was updated. Deposits forwhich there are no known gold values and those that arecharacterized by a very high gold grade resulting fromsupergene enrichment were excluded, resulting in a datasetcomprising 513 deposits.Singer (1995) and Franklin et al. (2005) discuss anumber of the limitations of such deposit grade and tonnagecompilations. For example, the compiled numbers includeproduction data as well as estimates of reserves andresources. Production numbers differ from reserves andresources, as metal recovery, particularly for gold, is nevercomplete. A mining operation may be optimized for basemetal production at the expense of precious metals recoveryresulting in a bias towards lower reported average goldgrades for deposits that have been or are presentlyproducing base metals as their main commodities. This is
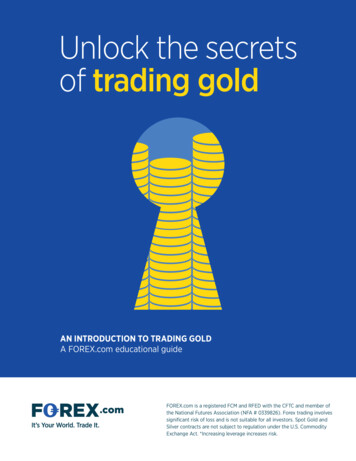
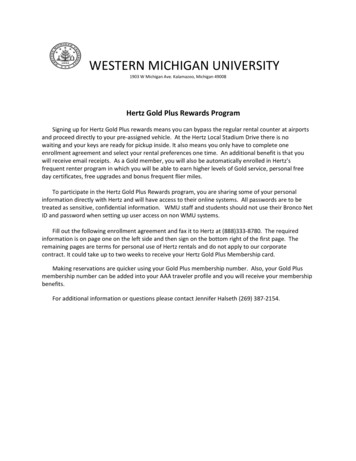
Miner Deposita (2011) 46:509–539a common situation in VMS deposits as the recovery ratesfor gold, copper, and zinc are 67%, 86%, and 83%,respectively (based on Canadian deposits mined up to2005: Lydon 2007). The opposite situation also exists, withsome VMS deposits mined and optimized for goldproduction. For example, gold, copper, and zinc recoveryrates are approximately 76%, 93%, and 86% at the FlinFlon concentrator (HudBay Minerals Inc. Annual Report2008), whereas they are approximately 91%, 86%, and 87%at the LaRonde concentrator (Agnico-Eagle Mines Ltd.Annual Report 2008). Thus, the head grades, which are thebest measure of metal contents in the deposits, can differsignificantly from reported grades based on past production. Comparing past or current producers with deposits forwhich only resources or reserves are known or estimatedalso may affect the grade distribution, without significantlyaffecting overall trends, as noted in previous studies ofbase–metal ratios in VMS deposits (Sangster 1977, 1980;Franklin et al. 1981). The mining method also can have amajor impact on reported grades and tonnages, as an openpit operation will typically mine large tonnages at lowergrades, illustrating the importance of considering the totalgold content and gold-to-base metal ratios when comparingdeposits. Moreover, gold may not be recovered in somedeposits, despite large total contained amounts due to therefractory nature of the ore (e.g., Brunswick No. 12 in theBathurst Mining Camp; McClenaghan et al. 2009). Manydeposits that are not considered gold-rich are howevercharacterized by relatively small but richer lenses or zonesthat do not affect significantly the average grade of thedeposit (e.g., Rambler-Ming in Newfoundland, Canada;Santaguida and Hannington 1996; Hyde 2008; Iron Blowlens, Mount Lyell, Tasmania: Corbett 2001).Many VMS deposits are characterized by disseminatedand/or semi-massive sulfide zones that can be moreeconomically important than massive sulfide zones. Thisis the case for a number of deposits with minor massivesulfide zones but high gold grades in stockwork zones (e.g.,Iron Dyke, Oregon: Bussey and LeAnderson 1994; Juhas etal. 1980). In other deposits, the mined gold does not occurin the massive sulfide lenses but around it as stockworks,disseminations, or in barite lenses and exhalites (e.g., KaliKuning and Lerokis on Wetar Island, Indonesia: Sewell andWheatley 1994b; Sillitoe et al. 1996; Hannington et al.1999; Huston 2000; Scotney et al. 2005). In some cases,gold has been remobilized into veins or veinlets peripheralto or within the VMS deposit during deformation andmetamorphism (Mobrun, Quebec: Larocque et al. 1993;Bousquet 2, Quebec: Tourigny et al. 1993; EasternAustralian VMS deposits: Huston et al. 1992; Boliden,Sweden: Wagner et al. 2007; Myra Falls, British Columbia:Sinclair et al. 2000a, b) or late-stage hydrothermalremobilization (e.g., Chisel Lake deposit, Manitoba: Galley511et al. 1993; Ansil deposit, Quebec: Galley et al. 1995). Thiscommonly results in significant coarsening of gold,upgrading of the deposits, and improvements in goldrecovery.In many cases, a deposit’s genesis and the origin of thegold enrichments remain controversial (e.g., MountMorgan, Queensland: Cornelius 1969; Taube 1986, 1990;Arnold and Sillitoe 1989; Ulrich et al. 2002). For example,some deposits are thought to have formed in (shallow)submarine volcanic-dominated environments and havedistinctive epithermal characteristics (e.g., Sillitoe et al.1996; Hannington and Herzig 2000), suggesting a hybridVMS-epithermal classification (e.g., Mount Lyell, Tasmania: Large 2000; Corbett 2001; Huston and Kamprad 2001;Large et al. 2001; Eskay Creek, British Columbia: Roth etal. 1999; Johnson River, Alaska: Steefel 1987; Iron Dyke,Oregon: Bussey and LeAnderson 1994), or even asintermediates between VMS and porphyry (e.g., Balta Tauand Baimak-type deposits of the South Urals; Prokin andBuslaev 1999).The average gold grades of VMS deposits tend to clusterat low values, with 78% of the data below 2 g/t (Fig. 1).As is typical of the grade distribution in many ore deposittypes (e.g., Sangster 1977; Parker 1991; Singer 1995;Franklin et al. 2005), gold grades in VMS depositsworldwide show a highly skewed frequency distribution(Fig. 1) that is log-normal (i.e., with a large number ofdeposits having very low gold grades and a small numberof deposits having very high gold grades; Fig. 2). Thearithmetic mean gold grade for VMS deposits is 1.50 g/t(Fig. 2), whereas the median grade is much lower (0.86 g/t).The large difference between the mean and the medianreflects the skewness of the data, and the arithmetic mean ismore effective at characterizing normally distributed data.Other measures of central tendency, such as the geometricmean, are less sensitive to extreme values (e.g., Borradaile2003) and may be more useful in characterizing thedistribution of gold grades in VMS deposits. The geometricmean is very helpful when dealing with such skeweddistributions. The geometric mean gold grade for VMSdeposits is 0.76 g/t Au (Fig. 2), which better reflects thelarge number of low-grade deposits. The standard deviationon the geometric mean is 2.70 g/t. These calculated valuesare in agreement with the values estimated graphically onthe cumulative probability frequency plot for average goldgrades in VMS deposits shown in Fig. 2. However, thecumulative probability frequency diagram shows thatthe distribution is not homogeneous, which may be due tothe presence of more than one population (see below).Figure 1 shows that there is no relationship between thetotal base metals content or Zn or Cu grades of a depositand its gold grade. However, many base metal-rich depositshave relatively low gold values, and vice versa, mainly
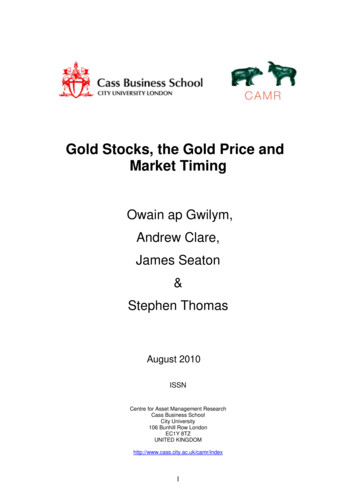
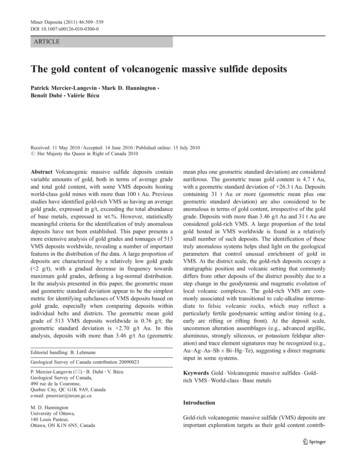
512Miner Deposita (2011) 46:509–53945A1040Bn 51340C35n 502n 507Total Base Metals (Cu Zn Pb wt.%)3530Zn (wt.%)Cu (wt.%)3052520151025500205101520 4045Gold grade (ppm or g/t)50005101520 4045Gold grade (ppm or g/t)5015105005101520404550Gold grade (ppm or g/t)Fig. 1 a Total base metals content (Cu Zn Pb in wt.%) versusgold grade for VMS deposits worldwide. b Cu (wt.%) and c Zn (wt.%) versus gold grades for VMS deposits worldwide. These plots showthat there are no direct correlations between the average gold grade ofthe VMS deposits and the average concentration in base metals. Datamodified from Franklin et al. (2005)reflecting mining economics (i.e., a gold-rich deposit maybe economic despite low base metal grades). Similarly, thetotal gold content, which is also characterized by a highlyskewed frequency distribution that is log-normal (Fig. 3), isnot only a function of grade. The arithmetic mean goldtonnage for VMS deposits is 17.7 t of Au. However, thecumulative frequency distribution shown in Fig. 3 suggeststhat the median value (50% of cumulated data), which is agood estimate of the geometric mean (Lepeltier 1969), is 4.7 t Au with a geometric standard deviation of 26.3 t.Eighteen VMS deposits in the dataset were among thetop 10% of gold deposits worldwide in terms of containedgold in 1995 (Fig. 4a). Each of these deposits containedmore than 100 t of gold and is among the world-class golddeposits according to the definition of Singer (1995) (i.e., 100 t Au). Five of these deposits, with more than 250 t ofAu (see Appendix), are among the top 5% of gold depositsworldwide (Fig. 4a). Although there are many supergiantVMS deposits (Franklin et al. 2005; Galley et al. 2007a),none contains enough gold to be considered a giant golddeposit according to the definitions of Sillitoe (2000) andSinger (1995) (i.e., 600 t Au for a giant gold deposit and 1,000 t Au for a “supergiant” deposit). The cumulativefrequency plot of the gold content of VMS deposits(Fig. 4b) shows that the top 10% of deposits contain morethan 45 t of gold each and account for about 64% of thetotal amount of gold contained in VMS deposits worldwide.The top 5% of the deposits each contained more than 83 tof gold, accounting for about 47% of all the gold hosted inVMS deposits (Fig. 4b).When individual districts or mining camps are considered, the distribution of gold grades is generally lognormal, but one or more deposits almost always haveanomalous grades that are distinct from the rest of thedeposits in the camp (see also Hannington et al. 1999). Insome cases (e.g., Abitibi Greenstone Belt and Flin Flon–Snow Lake Camps in Canada) the gold grade distribution isbimodal. This appears to indicate that a particular processor set of geological conditions responsible for goldenrichment in some deposits did not operate in others.Examples of gold grade distribution in a number of VMSbearing belts and districts are shown in Fig. 5. Most belts ordistricts contain at least one discordant or distinctly goldrich deposit and some districts contain a number of suchdeposits (e.g., Noranda and Doyon-Bousquet-LaRondeMining Camps in the Blake River Group of the AbitibiGreenstone Belt, Quebec: Dubé et al. 2007a; MercierLangevin et al. 2007b; Mount Read Volcanics, Tasmania:Huston 2000). There are no clear relationships between thesize and the grade of the deposits as shown on Fig. 6,
Miner Deposita (2011) 46:509–53918051314099.99120160Cumulative probability 99.999.59998959080502010520.50.10.001-1.8 -1.2 -0.600.6 1.2 1.8Gold grade (ppm or g/t, Log scale)0.010.1110Gold grade (ppm or g/t, Log scale)40n 51320Arithmeticmean: 1.50 g/tAumedian: 0.86 g/tAustd. dev.: 2.60 g/tAu100Geometricmean: 0.76 g/tAustd. dev.: 2.70 g/tAu00123456789 1015Gold grade (ppm or g/t)20404550Fig. 2 Frequency histogram of average gold grade in VMS depositsworldwide. The distribution is strongly skewed (log-normal after logtransformation of the data; inset, left). A probability plot of the data(inset, right), indicates a non-homogeneous distribution that reflectsmultiple populations. Deposits with a reported average gold grade of 0were omitted from the dataset to allow for calculation of thelogarithm. Std. dev. standard deviation. Data modified from Franklinet al. (2005)except perhaps for the Abitibi Greenstone Belt and theSkellefte District where the richest deposits are among thelargest VMS deposits of the district.The VMS deposits of the Abitibi Greenstone Belt (n 56; Fig. 5), which are clustered in a number of districts ofvarious sizes, have a mean gold grade of 1.43 g/t, with ageometric mean of 0.64 g/t. Of these deposits, 43 ( 77%)have gold grades that are lower than the arithmetic meanindicating the major influence of a few deposits. In contrast,for the Flin Flon and Snow Lake Camps, 15% of thedeposits have gold grades higher than 3 g/t (Figs. 5 and 6).The two most gold-rich deposits in the Bathurst MiningCamp, New Brunswick (Goodfellow and McCutcheon2003; McClenaghan et al. 2003, 2004) also stand out fromthe other deposits in the camp (Figs. 5 and 6), although theywould not be considered auriferous in comparison todeposits worldwide (e.g., Fig. 1). Nevertheless, theseatypical deposits in terms of gold grade indicate anunderlying process or condition of ore formation that isunique in the camp. Two of the largest (Horne andLaRonde Penna) and four of the richest (WestwoodWarrenmac, Bousquet 2-Dumagami, Quemont, Bousquet 1)gold-rich VMS deposits worldwide are located in the BlakeRiver Group of the Southern Abitibi Greenstone Belt.Moreover, the VMS deposits of the Blake River Grouprepresent approximately 48% of the total VMS tonnage ofthe Abitibi Greenstone Belt, but contain about 92% of thetotal VMS gold of the belt. Similarly, the VMS deposits ofthe Macuchi Belt in Ecuador are particularly rich in gold(Chiaradia and Fontboté 2001) and the Mount ReadVolcanics in Tasmania are “lacking” the typical dominanceof low-grade deposits (Figs. 5 and 6) with a median gradeof 2.38 g/t Au. This illustrates the provinciality of somegold-rich VMS deposits (Hannington et al. 1999; Huston2000; Dubé et al. 2007a) and strongly suggests a large-scalegeological control on the enrichment of gold (see below).Discriminating anomalous, auriferous, and gold-richVMS depositsPoulsen and Hannington (1996) defined gold-rich VMS ashaving an average gold content (expressed in ppm or in g/t)that exceeds the total base metals content (expressed in
514Miner Deposita (2011) 070Frequency220200Frequency180Cumulative probability (%)2404016020140120031 t50302010520.5-2.4 -1.8 -1.2 -0.6 0 0.6 1.2 1.8 2.4Gold tonnage (Log10)1004.7 t0.0010.010.1110100Gold tonnage (Log scale)100080n 51360Geometric (graphic)mean: 4.7 tAustd.dev.: 26.3 tAuArithmeticmean: 17.7 tAumedian: 4.00 tAustd. dev.: 40.4 ld tonnage (metric t)Fig. 3 Frequency histogram of total gold tonnage in VMS depositsworldwide. The distribution is strongly skewed (log-normal after logtransformation of the data; inset, left). The data are also plotted on aprobability diagram (inset, right), showing a relatively homogeneousdistribution, except for the very low values. Std. dev. standarddeviation. Data modified from Franklin et al. (2005)weight percent; Fig. 7). However, some ambiguity arises inthis classification for deposits that have both high goldgrades and high base metal grades (e.g., Lemoine, Quebec;Guha 1984; Guha et al. 1988; La Plata, Ecuador; Chiaradiaet al. 2008; Iron King, Arizona; Creasey 1952) or very lowgold and base metals contents (e.g., Mount Lyell, Tasmania;Corbett 2001; Seymour et al. 2007). The latter may berelated to the style of mineralization and/or the miningmethod (e.g., Mount Lyell, which is dominated bydisseminated sulfides and pyrite-rich ore, was mined byopen pit: Corbett 2001). The problem of classifying verylow grade deposits has been discussed by Poulsen et al.(2000) among others, who proposed that the classificationbe restricted to only those deposits that were or could bemined economically.Discordant or anomalous sample populations are characteristic of trace element abundance data (e.g., Limpert etal. 2001). In many cases, the discordance serves to identifyan important feature of practical geological importance,especially if it is caused by natural variability (Beckmanand Cook 1983). The standard deviation from the mean isthe most common metric to identify discordance in adataset (e.g., de Wijs 1951; Grubbs 1969) and has beenused in this analysis. Because gold grades and gold tonnageof VMS deposits worldwide define positively skeweddistributions (Figs. 2 and 3), the standard deviation hasbeen calculated on the geometric mean (geometric standarddeviation), which appears to be in closest agreement withthe observed distribution of gold grades in most VMScamps or districts. On a global scale, discordant oranomalous deposits are those having gold grades higherthan 3.46 g/t (geometric mean value plus one geometricstandard deviation calculated from the database of 513deposits). Forty-six VMS deposits have gold gradesexceeding this value (Fig. 8 and Appendix). Examinationof the gold grade distribution in different districts (Fig. 5)shows that the global geometric mean and geometricstandard deviation are a useful discriminator of auriferousdeposits in most cases. Deviations from a strictly lognormal distribution in the cumulative frequency plot(Fig. 2) are related to the superposition of differentpopulations (e.g., log-normal grade distribution in somedistricts, bimodal in others).The geometric mean plus one geometric standarddeviation of the total contained gold (i.e., 31 t Au) alsoidentifies deposits with anomalous gold endowment,
Miner Deposita (2011) 46:509–539Cumulative frequency of deposit size (%)100515Number of Gold DepositsWorldwide in 1995 (all types)80AVolcanogenic massivesulfide deposits18 deposits among thetop 10% of worldwideAu deposits in termsof size (t Au)60405 deposits among thetop 5% ( 250 t Au)2000.000110% of Deposits5% of Deposits100000.011001Tonnes of Gold per DepositCumulative Frequency of Deposit Sizeand Total Amount of Gold (%)100Amount of Au80Number ofvolcanogenicmassive sulfidedeposits worldwideB69.8% of Au64% of Au60total VMS tonnage. A majority of these 11 deposits alsohave a gold-to-base metals ratio that is greater than 1(Fig. 7, Table 1 and Appendix). The 46 deposits thatcontain more than 3.46 g/t represent about 9% of thedeposits worldwide for which gold grades are known(database of 513 deposits) and account for about 20% ofthe VMS gold but only 3.5% of the global VMS tonnage.These statistics highlight the fact that a large proportion ofthe total gold hosted in VMS worldwide is found in arelatively small number of deposits. Overall, 113 depositsmeet at least one of these criteria (see Appendix andFig. 9). Twenty-nine deposits meet at least two criteria.Only nine deposits meet all three criteria ( 31 t ofcontained Au, an average gold grade higher than3.46 g/t, and a gold-to-base metals ratio 1: Fig. 8, Table 1and Appendix); six of these are in the Blake River Groupof the Abitibi Greenstone Belt.Characteristics of anomalous, auriferous and gold-richVMS deposits47% of Au40Number of deposits .2012.7% of Deposits10% of Deposits5% of Deposits00.0010.010.1110 31 t 100Tonnes of Gold per Deposit1000Fig. 4 a Cumulative frequency plots of contained gold in goldbearing deposits of all types, worldwide (modified from Singer 1995).Eighteen gold-bearing VMS deposits are among the top 10% of golddeposits worldwide in terms of total contained gold, and five areamong the top 5%. b Plot of cumulative frequency of deposit size andtotal contained gold among VMS deposits worldwide for which goldgrades are known. Data modified from Franklin et al. (2005). The top5% and 10% of the deposits in terms of size contain 47% and 64% ofthe total gold in VMS deposits, respectively. Deposits with 31 t of Auor more represent less than 13% of the total number of deposits butcontain about 70% of the VMS gold. Thus, a large proportion of theVMS-hosted gold worldwide is contained in just a few deposits. Thesedeposits form a unique group that best illustrate the geologicalparameters that control the formation of gold-rich VMSirrespective of their gold grade (Fig. 8). Deposits with totalcontained gold of 31 t or more (n 63: Appendix) aretermed “anomalous VMS” and account for 69.8% of thetotal gold contained in VMS deposits worldwide (Fig. 4b).This indicates that approximately 70% of the VMS gold ishosted in about 13% of the VMS deposits. Eleven of thesedeposits have gold grades higher than 3.46 g/t (Fig. 8 andTable 1). These deposits, termed “gold-rich VMS,” accountfor 17.8% of the total gold contained in VMS depositsworldwide, even though they only represent 2.9% of theTable 1 summarizes the main characteristics (grades, age,interpreted geodynamic setting, lithostratigraphic association, host rocks, mineralization, and alteration styles) of 31deposits highlighted in this analysis, and Appendix lists allgold-rich, auriferous, and anomalous VMS deposits identified in our analysis. The distribution of these deposits isshown on Fig. 9. The data presented in Table 1 emphasizespecific geological attributes that distinguish them fromother less gold-rich deposits.The sizes and grades vary significantly, but at the campscale, the richest deposits are commonly either the largestor among the largest deposits of the district or the belt (e.g.,Horne, LaRonde Penna, Quemont and Bousquet 2Dumagami in the Abitibi Greenstone Belt; Boliden in theSkellefte District; Flin Flon in the Flin Flon and Snow LakeCamps; Caribou in the Bathurst Mining Camp; La Zarza inthe Iberian Pyrite Belt; Greens Creek in the JuneauAdmiralty District; Fig. 6 and Table 1). It is noteworthythat six of the 15 largest VMS deposits in the AbitibiGreenstone Belt, accounting for 42% of the total tonnage ofVMS in the Abitibi, are also the most gold-rich, accountingfor 88% of the VMS gold. Moreover, Horne (H-G and Zone5) and LaRonde Penna, two world-class gold-rich VMSdeposits, account for 35% of the total VMS tonnage of theentire Abitibi and for 60% of the total VMS gold of thebelt. In other districts, the most gold-rich deposits areamong the smallest (e.g., Delbridge and Deldona inNoranda: Boldy 1968; Gibson and Galley 2007; PetiknasNorth and Holmtjarn in Skellefte; Lomero-Poyatos in theIberian Pyrite Belt; Photo Lake in Flin Flon/Snow Lake;Balta Tau in the South Urals; Fig. 6 and Table 1). The gold-
516Miner Deposita (2011) 46:509–539843.462 3 4 5 6 7 8Gold grade (ppm or g/t)5Mount Read VolcanicsLyentou24 6 8 10 12 14 16 18 20Gold grade (ppm or g/t)10EBathurst Mining Campn 20Arithmetic:mean 0.58std. dev. 0.56Geometric:mean 0.40std. dev. an Pyrite Belt00 0.5 1 1.5 2 2.5 3 3.5 4 4.5 5Gold grade (ppm or g/t)10G10n
VMS deposit (i.e., 0.9 g/t Au, 1.3% Cu and 3.3% Zn) in 1950 was about 10% of the total value of the deposit, whereas it was about 23% in 2008, illustrating the increasing economic importance of the gold content of a deposit. For example, the gold at Horne, Quebec (54 Mt grading 6.1 g/t Au and 2.2% Cu) was worth about 14% of