Transcription
Gold Stocks, the Gold Price andMarket TimingOwain ap Gwilym,Andrew Clare,James Seaton&Stephen ThomasAugust 2010ISSNCentre for Asset Management ResearchCass Business SchoolCity University106 Bunhill Row LondonEC1Y 8TZUNITED KINGDOMhttp://www.cass.city.ac.uk/camr/index1
ABSTRACTWe investigate the relationship between gold prices and gold equity indexlevels and consider whether this offers any explanatory power for the futurereturns of gold stocks. It is observed that a simple, well-specified model canexplain movements in the stock prices of gold producing firms. Usingevidence from gold exchange-traded funds we also show that investors'market timing decisions have reduced their average returns from theseinstruments by over 1.5% annually between 2005-2009.2
The last decade has seen some very substantial volatility in the prices ofcommodities. Periods where oil traded over 100/barrel and gold traded at inexcess of 1000/oz are two of the most widely noted cases. For equityinvestors, it can be challenging to identify suitable stocks in which to invest inorder to benefit from the rising commodity prices. Gorton and Rouwenhorst(2006) note that in many cases it is difficult to match companies withcommodities since very few are a "pure play". For example, an oil companymay also produce natural gas whilst a silver miner can extract base metals atthe same time as the precious metal. McDonald and Solnick (1977) and Bloseand Shieh (1995) show that resource stocks are a leveraged play on theunderlying commodity although the precise amount of this effect is less welldefined (see Tufano, 1998). In contrast, Gorton and Rouwenhorst (2006)report that commodity stocks considerably underperformed a portfolio of"matching" commodity futures over a period of forty years. Furthermore thetwo groups have only weak positive correlation. The popularity of ‘Harvard’style diversified portfolio investing has also encouraged further study ofcommodities as an asset class, (e.g. see Swensen, 2009) while rategiesareincreasinglyincorporating commodity futures or ETFs as an additional, 'diversifying' asset(e.g. see Faber, 2009). Further, mean-variance optimised and liability tclassesincludingcommodities (see Bekkers et al, 2009).The aim of this paper is to investigate the commodity-commodity stockrelationship using evidence from the gold mining industry, which offers one of3
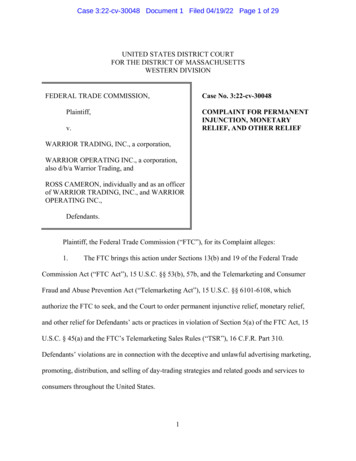
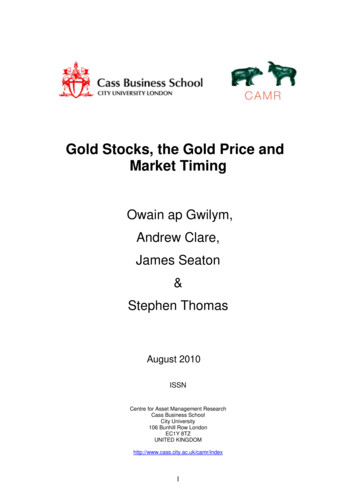
the purer plays currently available to investors, and to assess whether this canbe utilized to aid investment decisions. We find that a simple, well-specifiedmodel can be constructed to explain movements in gold indexes based onreal interest rates and the relation between the underlying gold price and anindex. Furthermore we observe that investors' market timing in trading goldexchange traded funds between 2005-09 has been detrimental to their returnscompared to the expected average.Gold Indexes vs the Gold Price as Investment MetricsThroughout this paper we refer to two widely followed North American goldindexes; namely the Philadelphia Gold and Silver Index (hereafter XAU) andthe NYSE Arca 1 Gold BUGS (Basket of Unhedged Gold Stocks) Index(hereafter HUI). The XAU index is a market-capitalization weighted indexwhilst the HUI is a modified equal dollar weighted index. 2 The XAU is one ofthe longer running gold indexes having been used since the introduction ofoptions trading on the index in December 1983. In turn the gold/XAU ratio hasbecome something of an investment tool for discerning when it may beappropriate to purchase gold equities. 3 Figure 1 demonstrates the behaviourof the gold/XAU ratio from 1983 to September 2009, along with thesubsequent 1-year change in the index. As there is no total return index forthe XAU, the right-hand y-axis reflects index point changes. It can be seen1Formerly American Stock Exchange (AMEX).Price data for the indexes is collected from Thomson ONE Banker. Physical gold prices are closingprices from COMEX. Data for individual stocks are collected from Thomson ONE Banker andindividual company reports.3For examples see Abelson (2006) and Sergeant (2007).24
that the ratio has tended to oscillate between 3.0 and 5.0 for much of the timeframe. A high value of the metric suggests that gold equities are relativelyundervalued compared to the physical metal whilst a relatively low ratioimplies the reverse. Table 1 reinforces this notion with values of gold/XAU inexcess of 4.5 having been associated with substantial index increaseswhereas ratios less than 3.5 have been associated with poor performance.However, using this metric in a practical investment approach may beproblematical, firstly due to the composition of the XAU index. Hamilton (2001)provides an explanation that at various times the XAU has not provided theproxy for exposure to gold price changes that might have been anticipated.For example, in 2001 the second largest component (15% of the index at thetime) was Phelps Dodge, a firm that was primarily a copper company with onlyrelatively small gold production. Also, a large portion of the XAU hashistorically been made up of companies that have hedged very significantamounts of their gold production for several years forward (Hamilton, 2001)and to this extent the exposure of the XAU to changes in gold prices hasprobably been dampened in the past. Jin and Jorion (2007) find no evidencethat hedging increases gold mining firms' values, consistent with evidencepresented by Jin and Jorion (2006) from the oil industry. Callahan (2002)reports that aggressive hedging does not maximise shareholder wealth.Indeed, there have been instances where gold producers have had such largehedge positions that a rise in the price of gold actually caused financialdifficulties. 4 Tufano (1998) clearly demonstrates that the returns of North4See “All Things to All Men”, Financial Times, December 2nd 1999.5
American gold producer stocks have a leveraged exposure to the gold priceafter controlling for reserves, production levels, hedging, etc 5 . Assuming thatthe gold/XAU ratio oscillates around a neutral level of 4.00 to 4.25 this impliesthat a 1% rise in the gold price equates to a 1% increase in stock prices. 6During 1990-94, Tufano (1998) actually found the gold beta to be around1.88. This further suggests the historical hedging activities of XAU constituentfirms have suppressed the gold price exposure. 7In contrast, the HUI index was created in June 1996 such that onlycompanies with no hedging in excess of 1½-years are considered forinclusion. As such, the profits of the constituent firms of this index should bemuch more closely correlated with the spot gold price. Figure 2 presents thephysical gold price, the level of the HUI index and the HUI/gold ratio. 8 Theleverage inherent in the unhedged gold stocks is clearly visible in the sharpdecline in HUI/gold relative to gold alone during 1996-2000 as the metal fellfrom around 400 to under 300, the subsequent rise as gold approached 700 in mid-2007 and the large drop accompanying the financial crisis of2008. As with the XAU, there is no accompanying total return index available,although since the end of 1999 NYSE Arca provides updates of thecomponents of the HUI along with the relative weights of each company. Wetherefore create a new series which estimates the total return for the index on5Faff and Hillier (2004) report that the factors affecting South African and Australian gold minersdiffer from those found by Tufano (1998) in North America.6See Hamilton (2001).7Evidence from BNP Paribas Fortis Hedging and Financial Gold Report (2009) suggests that hedginghas declined markedly in recent years in response to the rising gold price with hedge books havingfallen from 80 Moz in 2003 to 20 Moz in 2008.8As in Hamilton (2004), it is conventionally used with gold as the denominator. This contrasts with thegold/XAU ratio.6
a monthly basis using the dividends paid by the constituents. Since thedividends are generally relatively low or zero, we believe our data pre-1999 isa reasonable proxy for total HUI returns.Gold Stocks and Sensitivity to the Gold PriceIt has generally been accepted that commodity stocks offer a degree ofleverage to the price of the commodity that they produce. In an informalsurvey of gold company managers, Tufano (1998) found that they expected a1% increase in gold to lead to a 3% to 10% increase in their stock returns.This was considerably higher than the estimate of the gold beta of 1.88observed by Tufano over the period 1990-94. During these years the goldprice averaged around 360/oz and it was reported that a significant negativerelationship existed between the sensitivity of gold share returns and the goldprice, i.e. as the gold price rose so the gold beta declined. We estimate themarket model as employed by Tufano (1998) for the returns on the HUI indexusing Equation 1:R HUIt i HUIg R gt HUIm Rmt tEquation 1where R HUIt is the estimated return on the HUI index, R mt is the monthlyreturn on the S&P 500 and R gt is the monthly return on the gold price. 9 Thecoefficient β HUIg is the gold beta or an estimate of the sensitivity of the HUI’s9We ignore gold lease rates as Tufano (1998) finds that these make little difference to the overallreturn.7
returns to a 1% change in the price of gold after controlling for broad changesin the overall equity market. Gold betas can vary quite considerably over shortperiods and, as we are interested in longer-term trends, we use a longerperiod for calculating these than Tufano (1998). Figure 3 shows the results ofa monthly calculation of the gold beta using all of the data available eachmonth beginning in June 1996 and a 4-year rolling beta value, along with theprice of gold. It can be seen that the gold beta peaked around the end of2002, a little after the bottom in the physical market. Given that this is a rollingmulti-year value, this is consistent with prior evidence of the inverserelationship. From 2003, the gold beta has generally declined as the goldprice has ascended. The low point in 2007-08 was around 1.5, however, thishas subsequently risen as the extreme volatility surrounding the financialcrisis has fed into the gold beta. In general, we find evidence to supportTufano's (1998) observation that the gold beta is lower than perhapsexpected.Explaining Gold Index (HUI) ReturnsWe now consider the effectiveness of using the HUI/gold ratio along with anadditional variant to explain subsequent HUI returns. The two measures weemploy are the standard ratio and a ratio that includes a fixed leverage to thegold price. For the fixed leverage ratio we assume that the sensitivity to goldprices is maintained at 1.88 based on Tufano’s (1998) estimate (denoted asHUI/gold1.88) which effectively creates a ratio that, if correct, should oscillate8
around a fairly constant average value in the same way that gold/XAUappears to have historically behaved.Table 2 reports the results of regressions estimated during the period fromJune 1996 to September 2009 using subsequent annual returns as thedependent variable and the gold-HUI measures as the independent variables.The signs of the HUI-gold coefficients are as anticipated; HUI/gold andHUI/gold1.88 are both negative indicating that returns are lower when stocksare relatively expensive compared to the physical metal. Both terms are alsostatistically significant, although the adjusted-R2 values are not especiallyhigh.Real Interest Rates and GoldWe now consider whether the introduction of the real interest rate canimprove the explanatory power. Barsky and Summers (1988) observe that inthe US between 1973 (when the gold market became free of governmentoperations and “genuine” market price was reached) and 1984 (when theirstudy ended), there was a highly significant negative relationship between thereal interest rate and the price of gold. They argue that the willingness ofinvestors to hold gold varies according to the anticipated real returns for otherassets. Figure 4 displays how this relationship has developed in the yearsafter 1984 (with real rates calculated as the difference between 1-year T-Billsand CPI). It is noticeable how the large rises in the gold price in the periods of1975-1980 and 2001-2007 have both been accompanied by periods of9
negative real rates, whilst the 20-year decline from the 1980 peak coincidedwith a period of tight monetary policy. It is also of interest to observe how realrates have affected subsequent gold price movements. Table 3 reportsregressions (for the period December 1975 to September 2009) for the annualsubsequent change in gold prices explained by real interest rates. 10 For thewhole period it can be seen that a significant negative relationship existsbetween real rates and movements in the gold price. When sub-periods areused, the negative relationship still holds throughout although it loses itsstatistical significance during the period of 1975-1995.A potential problem of the approach using gold-HUI metrics to determineallocations to gold equities is that whilst the stocks might be relatively cheapcompared to the metal, if the metal itself is expensive and then declines inprice then intuitively it seems unlikely that the equities will be goodinvestments. To this extent it seems logical that the inclusion of a variable inthe model that has some ability to explain the change in the gold price itselfwould be a valuable addition. Table 4 presents the results when the realinterest rate is introduced as an additional explanatory variable in theequations used in Table 2 for estimating subsequent HUI returns. Firstly, it isnoticeable that the explanatory power of all the equations increasessubstantially and that real rates alone explain over 27% of the variation in HUIreturns. The coefficient has the anticipated negative sign consistent with thatobserved earlier in regressions explaining gold prices. Introducing the realrate does not affect the sign on the coefficients of the gold-HUI metrics.10The Newey-West (1987) correction is applied.10
Clearly these results have benefited from the relationship between real ratesand gold prices being strongest during the period under consideration (Table3 shows that the real rate-subsequent gold price relationship was strongestduring 1995-2009); however it still provides considerable support for realinterest rates being an important factor in explaining gold equity returns.Forecasting Gold Index (HUI) ReturnsThe regressions run so far are all within sample and thus are perhaps notthe most objective measure of the effectiveness of gold-HUI relationships fortactical asset allocation. To examine the strategic value of the metrics weconsider using a trading rule base on the regression models in Table 2 andcompare these with a buy-and-hold approach. For each of the regressionmethods, forecasts of annual HUI returns are generated beginning after 60months of observations being available. Both a recursive approach, using allavailable data, and a rolling approach, using the most recent 60-months ofdata, are tested. Each month's forecast is compared with the current returnavailable on cash, as defined by the 3-month T-Bill rate. If the forecast is inexcess of the cash yield then a long position is taken in the HUI index, if notthen a position in cash is taken instead. The buy-and-hold approach simplyinvolves holding a long HUI position throughout the whole sample period.Results are reported both excluding any penalties for switching assetclasses and also with a transaction cost of 0.5%, to reflect brokerage fees,dealing spreads and order slippage; on each occasion a move into or out of11
the HUI occurs after the initial allocation (this is accounted for when makingthe switching decision based on the regression forecasts). The inclusion oftransaction fees reflects that some methods will involve a greater degree oftrading and that this is not a costless exercise. It is accepted that the periodover which this strategy is tested is relatively short but this is an inevitableconsequence of the equally short existence of the HUI index. Nevertheless, itdoes serve as an illustrative demonstration of a trading approach to seek totake advantage of the relationship between the prices of gold stocks and themetal itself.Table 5 reports the results of the different trading approaches. Panel Adisplays the returns attributable to the two different gold-HUI variants, bothrecursive and rolling. In both cases the rolling forecast provides a higherreturn than the recursive. It is not clear, however, that one gold/HUI variable issuperior to the other. The slightly unexpected result of the HUI/GOLDrecursive forecast with transaction costs having a higher return than the samemodel without transactions costs is due to the friction of the costs actuallyavoiding, with the benefit of hindsight, an unsuccessful asset allocation switch.Panel B shows the results of using the regression equations that incorporatethe real rate to generate forecasts. Firstly, the performance of the tradingstrategies of the gold-HUI metrics combined with real interest rates isgenerally much improved compared to the results in Panel A (with theexception of the HUI/GOLD rolling forecast). We also note that the real ratealone provides fairly good forecasts. Finally, Panel C reports the results of a12
buy-and-hold approach. This is clearly the most successful of all the resultswith both the highest compound annual return and Sharpe ratio. Only onegold-HUI model came within 1% of the compound annual return of the buyand-hold method. It should be noted though that for much of the period ofstudy gold stocks were in a bull market and thus forecasting may be moreuseful in periods where prices demonstrate more variability.Gold Exchange-Traded Funds and Investor TimingThe last decade has witnessed a substantial increase in investor demandfor exchange-traded funds. As an example, the Financial Times 11 reports thatETF assets under management rose from less than 100bn in 1999 to over 1trn in 2009. One of the biggest successes has been the creation ofphysically-backed ETFs to track the price of gold. The SPDR Gold Trust(GLD) held 1.3bn (3.05Moz of gold) in assets at the end of 2004, whichincreased to 35.1bn (35.2Moz of gold) at the end of September 2009. Thisnow represents one of the largest ETFs globally. Over the same period, theUK-listed Gold Bullion Securities (GBS) ETF has increased from around 700m in assets to 4.2bn. One of the interesting aspects of theseinstruments is that they provide daily information on the number of shares inissue which fluctuates according to the creation and redemption of units. 12This can be used to estimate the cash inflow/outflows over a particular periodof time and thus to gauge investors' market timing abilities.1112ETF supplement in 1st February 2010 edition.For GLD data see www.spdrgoldshares.com and for GBS data see www.etfsecurities.com.13
Friesen and Sapp (2007) examine the timing ability of mutual fund investorsusing cash flow data at the individual fund level for the period 1991-2004.They observe that timing decisions reduce the average return by around 1.6%annually. We apply the methodology of Friesen and Sapp (2007) to the twogold ETFs described above to study investors' market timing ability with theseinstruments. This is achieved by comparing the geometric monthly averagereturn, rg, with the money-weighted average monthly return, rmw, over thesame period. The money-weighted average is defined as the rate of return atwhich the accumulated value of the initial total net asset value plus theaccumulated value of net cash flows equals the total net asset value at theend of the period in question.Equation 2where,Equation 3and NCF j,t denotes the monthly net cash flow for ETF j in month t, and TNA j,tis the total ETF capitalization for ETF j at the end of month t.Initially, we follow the method of Friesen and Sapp (2007) by using end ofmonth data and assuming that all cash flows are discretely invested at the endof each monthly period. We then take advantage of the daily data available tocalculate the money-weighted return assuming all net cash flows occurdiscretely at the end of each day. In both cases, the performance gap is14
calculated as the difference between the geometric return and the moneyweighted return, rg - rmw.Table 6 reports the arithmetic, geometric and money-weighted returns alongwith the performance gaps for both GLD and GBS for the period from January2005 to September 2009 inclusive. Considering the GLD ETF, it is observedthat the monthly arithmetic return is 1.59% and the geometric return is 1.44%per month over the whole period. The monthly average money-weightedreturn for the same duration is 1.31% creating a performance gap of 0.13%per month or approximately 1.6% per annum. This is very similar to theevidence presented by Friesen and Sapp (2007) for mutual funds. When themoney-weighted return is calculated using daily data, the average value isestimated as 1.29% and the performance gap is slightly larger at 0.15%.Looking at the individual years it is observed that in both 2005 and 2007investors' decisions created a greater return than the ETF, however, positiveperformance gaps, i.e. lower returns, existed in 2006, 2008 and 2009. Thelatter period was consistent with significant growth in the assets of GLD andhence greatly affected the overall result. Friesen and Sapp (2007) also notethat the performance gap for mutual funds increases with the size of the fund.The second panel of Table 6 reports the returns for the GBS ETF which istraded in the United Kingdom. 13 Performance gaps over the whole period areof a similar magnitude to that of GLD at 0.16% using the monthly data and0.17% using daily data. In terms of individual years, both 2005 and 2007 were13Slight differences in returns can be attributed to the different trading hours in the United States andUnited Kingdom.15
the best for investors' timing decisions and 2006, 2008 and 2009 were thepoorest. The consistency of the results across different ETFs adds greaterweight to the notion that investors' decisions in aggregate have beendetrimental to their returns.ConclusionWe have investigated the relationship between gold producing equities andphysical gold prices and found, consistent with the evidence of Tufano (1998),that the sensitivity of gold equities to the gold price is not constant. We notethat this sensitivity has declined quite considerably in recent years as the goldprice has advanced. We also compared the various metrics based on therelative value of gold stock indexes to the price of gold as predictors of futurereturns to gold equities but found that the explanatory power was generallyquite low. The introduction of real interest rates made a significant difference.This highlighted a negative relation with subsequent changes in theunderlying gold price as well as being significantly negatively related tosubsequent gold equity returns. It was observed that both the substantialincreases in gold prices during the period of study from 1975-1980 and from2001-2007 began during periods of negative real rates, whilst the decline ingold from its 1980 peak was accompanied by a period of tight monetarypolicy.However, for this sample period, a simple forecasting method using bothgold-HUI variables and the real interest rate did not improve on the returns ofa buy-and-hold approach. Finally, we examine the market timing decisions of16
investors in gold exchange-traded funds. We note that, in aggregate,investment timing decisions have diminished returns by over 1.5% annually.These observations are supported by both monthly and daily timing methodsand are consistent across instruments traded in both the United States andthe United Kingdom.Looking ahead, if real rates stay low, or indeed negative, driven by centralbank policies then we can expect continued strength in gold prices. However,tactical market beating strategies are not necessarily robust and investorsshould consider the passive (ETF) alternative.17
ReferencesAbelson, B. (2006). “Gold/XAU Ratio Signals Froth”, Resource Investor.Barsky, R., and Summers, L. (1988) Gibson’s Paradox and the Gold Standard.Journal of Political Economy 96(3): 528-550.Bekkers, N., Doeswijk, R., and Lam T. (2009) Strategic Asset Allocation:Determining the Optimal Portfolio with Ten Asset Classes. Journal of WealthManagement 12(3): 61-77.Blose, L., and Shieh, J. (1995) The Impact of Gold Price on the Value of Gold MiningStock”, Review of Financial Economics 4(2): 125-139.Callahan, M. (2002) To Hedge or Not to Hedge That is the Question: EmpiricalEvidence from the North American Gold Mining Industry 1996-2000. FinancialMarkets, Institutions & Instruments 11(4): 271-288.Faber, M. (2009). “A Quantitative Approach to Tactical Asset Allocation – AnUpdate”, Cambria Investment Management.Faff, R., and Hillier, D. (2004) An International Investigation of the Factors thatDetermine Conditional Gold Betas. The Financial Review 39(3): 473-488.18
Friesen, G. and Sapp, T. (2007) Mutual Fund Flows and Investor Returns: AnEmpirical Examination of Fund Investor Timing Ability. Journal of Banking andFinance 31(9): 2796-2816.Gorton, G., and Rouwenhorst, G. (2006) Facts and Fantasies about CommodityFutures. Financial Analysts Journal 62(2): 47-68.Hamilton, A., (2001). Mining the XAU for Gold, Zeal LLC.Hamilton, A. (2004). Trading the HUI/Gold Ratio, Zeal LLC.Jin, Y., and Jorion, P. (2006) Firm Value and Hedging: Evidence from the U.S. Oiland Gas Producers. Journal of Finance 61(2): 893-919.Jin, Y., and Jorion, P. (2007) Does Hedging Increase Firm Value? Evidence from theGold Mining Industry. Working Paper, California State University, Northridge.McDonald, J., and Solnick, B. (1977) Valuation and Strategy for Gold Stocks. Journalof Portfolio Management 3(2): i-Definite,Heteroskedasticity and Autocorrelation Consistent Covariance Matrix. Econometrica55(3): 703-708.Sergeant, B., (2007). “Long on Gold Stocks Yet?”, Mineweb.19
Swensen, D. (2009). Pioneering Portfolio Management: An UnconventionalApproach to Institutional Investment. Pocket Books.Tufano, P. (1998) The Determinants of Stock Price Exposure: Financial Engineeringand the Gold Mining Industry. Journal of Finance 53(3): 1015-1052.20
Gold/XAU Ratio 5.255.00 – 5.254.75 – 5.004.50 – 4.754.25 – 4.504.00 – 4.253.75 – 4.003.50 – 3.753.25 – 3.503.00 – 3.25 3.00Table 1XAU Index Changes Ranked According to Gold/XAU Ratio 1983-2009Monthly Index ChangesAnnual Index ChangesNo. of UpAverage MonthlyNo. of UpAverage AnnualNo. ofNo. of(Down) IndexIndex Point(Down) IndexIndex hange2918 (11)4.48%1815 (3)34.05%2011 (9)1.98%2018 (2)33.36%2515 (10)2.58%2516 (9)14.14%3322 (11)1.72%3325 (8)23.03%5126 (25)0.53%5130 (21)9.36%3218 (14)-0.16%3214 (18)-2.76%2513 (12)0.51%256 (19)-2.92%3215 (17)-0.63%329 (23)-10.11%2616 (10)1.32%267 (19)-14.49%239 (14)-2.05%236 (17)-14.45%133 (10)-7.02%130 (13)-22.29%21
HUI/GOLDHUI/GOLD1.88Table 2HUI Returns Explained by Gold-HUI MetricsConstantCoefficientAdjusted 62)a(-2.19)baSignificant at 1% levelSignificant at 5% levelAll t-statistics are adjusted for overlapping observations using Newey and West (1987)bTable 3Subsequent 1-Year Changes in Gold Prices Explained by Real Interest Rates1975-2007PeriodConstantReal RateAdjusted R212/1975 –15.36-3.107.3%09/2009(3.30)b(-2.51)b12/1985 –9.29-2.307.7%09/2009(4.26)b(-2.51)b12/1995 2/1975 –18.6712/1995(2.20)a(-1.80)abSignificant at 1% levelSignificant at 5% levelTable 4HUI Returns Explained by Gold-HUI Metrics and Real Interest RatesabConstantHUI/GOLDHUI/GOLD1.88Real 4.63)b51.5%--218.66(-1.90)-Significant at 1% levelSignificant at 5% level2233.3%27.3%
Table 5Trading Rule Returns Using Gold-HUI Forecasts and Buy-and-Hold ApproachesNo Transaction CostsWith Transaction nnualReturnAnnualRatioRatio(%)Return (%)(%)Return (%)Panel A. Regression ForecastsRecursive 00.2456.8106.46.3310.390.140.24Rolling .250.2896.7112.29.6710.810.200.27Panel B. Regression Forecasts Including the Real Interest Rate (RIR) as a VariableRecursive ForecastsHUI/GOLD108.4196.0HUI/GOLD1.88RIR 910.1015.7913.050.210.330.27Rolling ForecastsHUI/GOLD113.81.88HUI/GOLD168.0RIR 5Panel C. Buy-and-HoldBUY & HOLD211.623
Table 6Market Timing Performance of Investors in Gold ETFsAll20052006200720082009(9mths)Arithmetic Return (%)1.591.441.842.300.761.59Geometric Return 30.15-0.360.16-0.150.230.16Arithmetic Return (%)1.591.421.842.360.611.76Geometric Return 80.170.000.12-0.030.260.06A. GLD ETFMoney-Weighted Return(%, Monthly Data)Performance Gap (%,Monthly Data)Money-Weighted Return(%, Daily Data)Performance Gap (%,Daily Data)B. GBS ETFMoney-Weighted Return(%, Monthly Data)Performance Gap (%,Monthly Data)Money-Weighted Return(%, Daily Data)Performance Gap (%,Daily Data)24
Figure 1 ‐ Gold/XAU Ratio and Subsequent 1‐YearChange in XAU Index1507.06.51206.0905.5oitaR 5.0UAX/ 02.5‐60198419861989199219941997Gold/XAU200
explain movements in the stock prices of gold producing firms. Using evidence from gold exchange-traded funds we also show that investors' market timing decisions have reduced their average returns from these instruments by over 1.5% annually between 2005-2009. 2. The last decade has seen some very substantial volatility in the prices of commodities. Periods where oil traded over 100/barrel .