Transcription
Unlock the secretsof trading goldAN INTRODUCTION TO TRADING GOLDA FOREX.com educational guideFOREX.com is a registered FCM and RFED with the CFTC and member ofthe National Futures Association (NFA # 0339826). Forex trading involvessignificant risk of loss and is not suitable for all investors. Spot Gold andSilver contracts are not subject to regulation under the U.S. CommodityExchange Act. *Increasing leverage increases risk.
Contents1So everyone’s talking about trading gold.What is it all about?3Factors that influence gold’s price5What is the correlation between gold and the U.S. Dollar?7Gold trading strategies11Trading gold with FOREX.comForex trading involves significant risk of loss and is not suitable for all investors. Increasing leverage increases risk.
1So everyone’s talking about trading gold.What is it all about?Human beings have long valued and treasuredgold for its inherent luster and malleability. Infact, gold has been used in human commercesince the societies of the ancient Middle Eastover 2,500 years ago, making it the oldest formof money still recognized today. Gold’s longtrack record as a store of value despite wars,natural disasters, and the rise and fall of greatempires means that it is generally seen as theultimate “safe-haven” asset.‘‘ The desire for goldis the most universaland deeply rootedcommercial instinctof the human raceGerald M. Loeb,Founding Partner of E.F. Hutton11 . oins/Forex trading involves significant risk of loss and is not suitable for all investors. Increasing leverage increases risk.’’
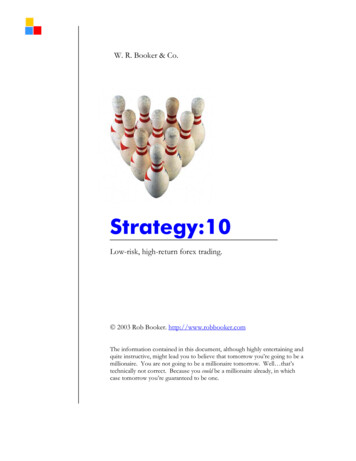
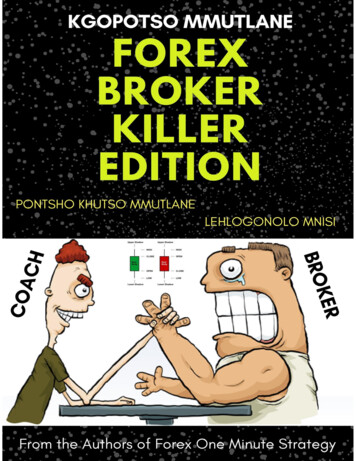
2Spot gold price in USD in oz 2,000.0Prices expode in themid- and late-2000s 1,800.0 1,600.0 1,400.0 1,200.0 1,000.0 800.0Minimal interest in trading gold in the ‘80s & ‘90s 600.0GFC 400.0 200.0 0.0198519901995200020052010Source: World Gold CouncilWhile gold has generally held its value forcenturies, traders’ interest has waxed and wanedin recent years. From the early 1980s until the early2000s, there was little interest in trading safehaven gold amidst the strong, stable economicgrowth and high-flying stock markets. As a result,gold generally consolidated between 300/oz and 500/oz for twenty years, from 1982-2002.Interest in gold grew slowly through the 2000sbefore exploding with the onset of the GreatFinancial Crisis in 2008. Gold prices rose insympathy, hitting an all-time high above 1900 inlate 2011. In this guide, we will discuss the majorforces that drive gold prices, along with someideas for trading strategies and some of the mostcommon methods for trading gold.Forex trading involves significant risk of loss and is not suitable for all investors. Increasing leverage increases risk.
3Factors that influence gold’s priceGold is one of the most difficult financial assets tovalue. Gold is similar to a currency like the U.S. dollaror the euro because it is durable, portable, uniformacross the world, and widely accepted; however, unlikethese more commonly traded currencies, gold is notsupported by an underlying economy of workers,companies, and infrastructure.In other ways, gold is more similar to a commoditylike oil or corn because it comes from the ground andhas standardized physical characteristics. Unlike othercommodities, though, the price of gold often fluctuatesindependently of its industrial supply and demand.10%In fact, only about 10% ofthe world’s gold is usedin industry: primarily inelectronics, due to itsconductivity and anticorrosive properties.90%The rest of the world’s goldis either made into jewelryor held for investmentpurposes.Forex trading involves significant risk of loss and is not suitable for all investors. Increasing leverage increases risk.
4Because of this dynamic, the emotions andbehaviors of traders tend to drive majortrends in the yellow metal. With goldmore than any other asset, traders seemto be polarized between diehard “goldbugs” who believe that gold should beworth 10,000 an ounce because centralbanks around the world are debasing theircurrencies and bearish traders who assertthat gold is a “barbarous relic” of the pastthat should be worth closer to 100. Asthe chart above shows, the gold bugs’view developed into a bit of a mania backin the mid- and late-2000s, though themore recent drop suggests gold may belosing some of its previous luster.Follow @FOREXcom onTwitter for updates on latestprice action and trade ideas.GOLD AND U.S. INTEREST RATESHistorically, one of the most reliable determinants ofgold’s price has been the level of real interest rates, orthe interest rate less inflation. If you think about it, thisrelationship is straightforward.When real interest rates are low, investment alternativeslike cash and bonds tend to provide a low or negativereturn, pushing investors to seek alternative ways toprotect the value of their wealth.On the other hand, when real interest rates are high, strongreturns are possible in cash and bonds and the appeal ofholding a yellow metal with few industrial uses diminishes.One easy way to see a proxy for real interest rates in theUnited States, the world’s largest economy, is to look atthe yield on Treasury Inflation Protected Securities (TIPS).Forex trading involves significant risk of loss and is not suitable for all investors. Increasing leverage increases risk.
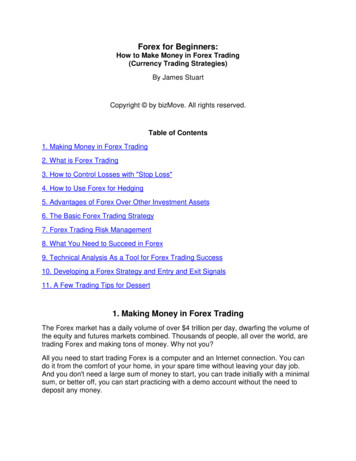
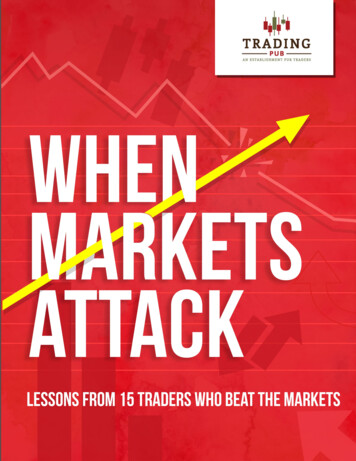
5What is the correlation betweengold and the U.S. Dollar?One of the biggest points of contention for goldtraders is on the true correlation between goldand the U.S. Dollar. Because gold is priced inU.S. Dollars, it would be logical to assume thatthe two assets are inversely correlated, meaningthat the value of gold and the dollar moveopposite to one another. In layman’s terms, ittakes fewer dollars to buy an ounce gold whenthe value of the dollar rises, and it takes moregreenbacks to buy an ounce of gold when thevalue of those dollars is lower.Unfortunately, this overly simplistic view of thecorrelation does not hold in all cases. The chartbelow shows the rolling 100-day correlationcoefficient between gold and the U.S. Dollar.The correlation coefficient measures howclosely together gold and U.S. dollar havemoved over the last 100 days; a reading of 1.0would show that they moved in perfect lockstepwith one another, while a reading of -1.0would show that their movements have beendiametrically opposed.Forex trading involves significant risk of loss and is not suitable for all investors. Increasing leverage increases risk.
6As you can see, the correlation is negative the majorityof the time, showing that the U.S. Dollar does tend tomove opposite to gold.However, it has also shown a tendency to spike rapidlyin periods of financial stress, such as in the depths ofthe Great Financial Crisis in early 2009 and the end ofthe first iteration of Quantitative Easing in mid-2010.This is because traders will buy both gold and the U.S.dollar as “safe-haven” assets in periods of uncertainty.Traders who blithely traded on the assumption thatgold and the dollar are inversely correlated wouldhave encountered a couple periods of tough marketconditions and likely losing trades over the past fewyears. Gold’s correlation with the U.S. dollar is onecrucial piece of the puzzle, but as we noted above,there are many other factors that drive gold’s value.100-Day Rolling Correlation CoeficientBetween Gold and U.S. Dollar, 2006-201210.50-0.5Source: Perth mint and Yahoo! FinanceForex trading involves significant risk of loss and is not suitable for all investors. Increasing leverage increases 30/20079/19/20065/11/2006Date-1
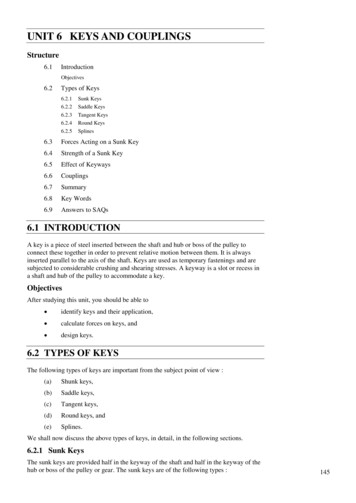
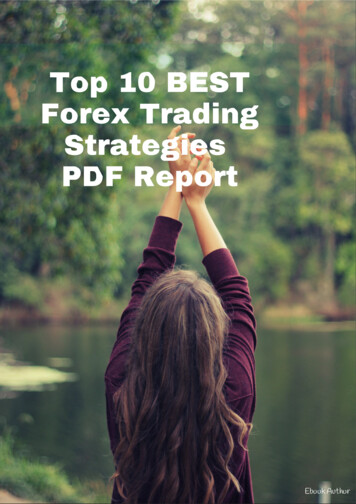
7Gold trading strategiesAs with any trading instrument, there is no single “best” way to trade gold. Manytraders from other markets have found that the technical trading strategies theyemploy on other instruments can easily be adapted to the gold market, especiallygiven gold’s tendency to form durable trends. For example, many traders havefound success adapting strategies based on trend lines, Fibonacci analysis andoverbought/oversold oscillators like RSI and Stochastics.A SAMPLE SHORT-TERM STRATEGY:CATCH THE “MEAT” OF THE TREND WITH A MOVINGAVERAGE CROSSOVERFor short-term traders, a classic way to try toprofit from the frequent trends in gold is to usea moving average crossover strategy. In thisstrategy, a trader would look to buy gold if ashorter-term moving average crossed above alonger-term moving average and sell when theshorter-term moving average crosses below thelonger-term average.Traders differ in their opinions on the “best”timeframes for the two moving averages, butwe’ve found that a 10/60 moving averagecrossover on the 1hr chart can be a strongcombination for shorter-term traders.Historically, these settings have allowed tradersto successfully trade the middle portion of atrend, though there is no guarantee of futureperformance. The chart shows how this strategycould be applied in the gold market:Forex trading involves significant risk of loss and is not suitable for all investors. Increasing leverage increases risk.
8Gold 1hr chartSMA-1284.9400 10,0,11SMA-1282.4917 60,0,1310-hour ma crosses below60-hour ma - gold selltrade at 1318.GOLD.cfd O-1288.0 H-1288.4 L-1286.9 C-1287.81340.0BEARISH 10/60 cross - close buy tradeat 1315 ( 33), enter new sell trade1330.01320.041310.01300.0BULLISH 10/60cross - close selltrade at 1331,enter new buytrade1290.01287.81284.91282.51280.0210-hour ma60-hour ma1270.010-hour ma crosses back above 60-hourma - close sell trade at 1282 ( 36),enter new buy 016th17:0017th17th14:0021st22nd22ndSource: FOREX.com12At point #1, the shorter-term 10-hour moving averagecrosses below the longer-term 60-period average,suggesting that traders should enter a sell trade as abearish trend may be forming. The moving averagesdo not cross again until point #2 a few days later, aftergold has trended down to the upper 1200s.At point #2, the initial sell trade is closed for a solidgain and a new buy trade is triggered as the trendshifts back to the topside.34After a brief consolidation, gold rallies back into thelower 1300s, and the trade is closed on the bearishmoving average cross at point #3.Like any methodology though, this strategy willproduce losing trades as well. In this case, the bigspike near point #4 caused the sell trade from #3 tobe stopped out for a loss. It’s also important to notethat the trade must be closed at the market price (near 1330) when the cross occurred, not the 1315 levelwhere the two moving averages actually crossed.Forex trading involves significant risk of loss and is not suitable for all investors. Increasing leverage increases risk.
9This simple trading strategy can help traders catchthe middle portion of trends in more volatile tradingenvironments like the one highlighted above, butusing it when gold is merely consolidating in arange can lead to a series of consecutive losingtrades. As a result, traders may want to considersupplementing this strategy with other indicators toimprove its long-term profitability.A SAMPLE LONG-TERM STRATEGY:WATCH THE LEVEL OF REAL INTEREST RATESLonger-term position traders and investors can focus more on thefundamentals driving gold’s price, such as the level of real interest rates.The chart below shows the relationship between gold prices and the yieldon TIPS, a proxy for real interest rates in the United States. The inversecorrelation is obvious, but it looks like gold’s rally accelerated as real yieldsdropped below 1% in early 2009. Not surprisingly, a longer-term look at therelationship would reveal that gold prices generally fell in the late 1990s,which were characterized by real yields above the 1% threshold.Forex trading involves significant risk of loss and is not suitable for all investors. Increasing leverage increases risk.
10Gold PRICE vs TIPS YIELD SINCE 200820004180031600214001120001000TIPS YIELD (right axis)JUL 16APR 16JAN 16OCT 15JUL 15APR 15JAN 15OCT 14JUL 14APR 14JAN 14OCT 13JUL 13APR 13JAN 13OCT 12-2JUL 12600APR 12-1JAN 12800PRICE (left axis)Source: Federal Reserve & Perth MintTherefore, longer-term traders may want toconsider buy opportunities if real yields arebelow 1%, a level which has historically beensupportive of gold prices. Conversely, if realyields rise above 2%, investors may want to focusmore on sell trades. Of course, this relationshipbetween real yields and gold prices plays outover longer-term timeframes, so shorter-termgold traders can generally ignore the level ofinterest rates.The ability to use a filter based on real interestrates is one of the unique features that traders canuse to gain an edge when trading gold, but thetrading strategies and opportunities in trading theworld’s oldest “currency” are truly limitless.Forex trading involves significant risk of loss and is not suitable for all investors. Increasing leverage increases risk.
11Trading gold with FOREX.comSome investors prefer to take physical possession of gold bullionto ensure that they can access it at will, but that strategy can beprohibitively expensive once additional costs to transport, store,protect, and trade the bullion are accounted for. Instead, sometraders focus on trading the current “spot” price of gold, whichis based on the price of the most active futures contracts on theCOMEX (Commodities Exchange) in New York. Because these futurescontracts are actively traded in a central location every single day,they provide the most accurate, up-to-date prices for gold.FOREX.com’s spot trading is based directly on the actual price ofgold, not an exchange-traded product like some other products.Gold offers diversification from other commonly traded markets. Theinverse correlation with the U.S. dollar was covered at length above,and gold has historically moved independently of stock and bondmarket prices as well.However, please be aware that there is no guarantee that it will becorrelated in the future and past performance is not indicative offuture results. Spot gold and silver trading is available 23 hours a dayfrom 6pm ET Sunday through 5pm ET Friday. Trading is closed from5pm to 6pm ET daily. Spot gold and silver trading also follow CMEholiday closures.Forex trading involves significant risk of loss and is not suitable for all investors. Increasing leverage increases risk.Gold is traded on 1:1 margin,or 100% of the contractvalue.The minimum lot size forgold is 1 troy ounce.The symbol for spot gold isXAU/USD.
12Get started with FOREX.comOPEN A LIVE ACCOUNT.Get access to exclusive market commentary, trade ideas,and technical analysis when you open an account withFOREX.com. Our application only takes five minutes.GET STARTEDOPEN A DEMO ACCOUNT.Test your trading strategy and see our competitive pricingwith a risk-free practice account.SIGN UPForex trading involves significant risk of loss and is not suitable for all investors. Increasing leverage increases risk.
FOREX.com is a registered FCM and RFED with the CFTC and member of theNational Futures Association (NFA # 0339826). Forex trading involves significantrisk of loss and is not suitable for all investors. Spot Gold and Silver contracts arenot subject to regulation under the U.S. Commodity Exchange Act. *Increasingleverage increases risk.CALL US877-FOREXGO(367.3946)LIVE CHATCONTACT US
ideas for trading strategies and some of the most common methods for trading gold. Spot gold price in USD in oz Source: World Gold Council 2,000.0 1,800.0 1,600.0 1,400.0 1,200.0 1,000.0 800.0 600.0 400.0 200.0 0.0 Minimal interest in trading gold in the ‘80s & ‘90s Prices