Transcription
Third Quarter 2019Earnings PresentationNovember 5, 2019
Forward Looking StatementsThis presentation may contain “forward-looking” statements that are based on our beliefs and assumptions and oninformation currently available to us. Forward-looking statements include information concerning our possible or assumedfuture results of operations, business strategies, competitive position and potential organic and inorganic growthopportunities. Forward-looking statements include all statements that are not historical facts and can be identified byterms such as “anticipate,” “believe,” “could,” “seek,” “estimate,” “intend,” “may,” “plan,” “potential,” “predict,” “project,”“should,” “will,” “would” or similar expressions and the negatives of those terms.Forward-looking statements involve known and unknown risks, uncertainties and other important factors that may causeour actual results, performance or achievements to be materially different from the expected results, performance orachievements expressed or implied by the forward-looking statements. Forward-looking statements represent our beliefsand assumptions only as of the date of this presentation. Except as required by law, we assume no obligation to updatethese forward-looking statements, or to update the reasons actual results could differ materially from those anticipated inthe forward-looking statements, even if new information becomes available in the future.Victory Capital uses non-GAAP financial measures referred to as Adjusted EBITDA and Adjusted Net Income to measurethe operating profitability of the business. These measures eliminate the impact of one-time acquisition, restructuring andintegration costs and demonstrate the ongoing operating earnings metrics of the business. The Company has includedthese non-GAAP measures to provide investors with the same financial metrics used by management to assess theoperating performance of the Company. Reconciliations of non-GAAP metrics to their closest comparable GAAP metricscan be found in the Appendix that accompanies this presentation.2
AgendaTopicsBusiness OverviewInvestment PerformanceUSAA Asset Management Company Integration UpdateThird Quarter 2019 Financial ResultsAppendix3
Business Overview4
Business OverviewAUM & FLOWS AUM increased to 145.8Bn at September 30, 2019 Positive 3Q long-term net flows of 726MM; YTD long-term net flows of 3.3Bn Second consecutive quarter of positive long-term net flows3Q FINANCIALHIGHLIGHTS 0.91 Adjusted Net Income with tax benefit per diluted share 44.8% Adjusted EBITDA Margin for the quarter; up 480 basis points from 2Q Ended the quarter with 1.037Bn of debt, down from 1.1Bn on July 1; subsequentlyreduced to 997MM Declared second 0.05 per share quarterly cash dividendUSAAINTEGRATIONUPDATE USAA Asset Management acquisition closed on July 1, 2019 Timing of annual cost synergies pulled forward; greater than 75 million at close; 105million as of Sept. 30; with total run-rate synergies of 120 million on track for mid-2020 Direct investment channel for USAA members reopened July 1, 2019, after being closedfor five years New call center set up and fully operational5
Investment Performance6
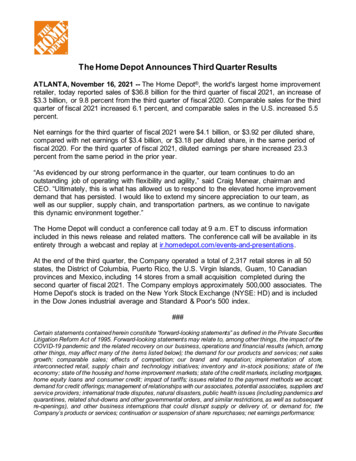
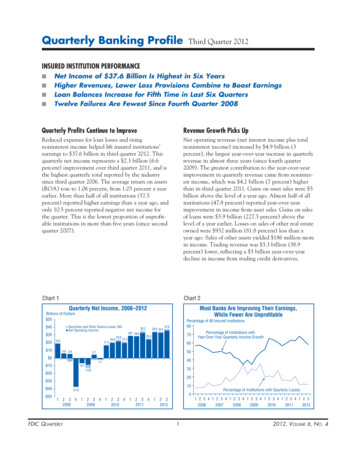
Commitment to Long-Term Investment Performance44Total MutualFunds and ETFswith 4- or 5-Staroverall ratings68%Total Mutual Fundsand ETFs AUM with4- or 5-Star overallratingsPercentage of AUM that has outperformed its benchmark100%83%76%75%88%92% 95%88%73%67%64%59%73%60%50%25%0%Over a one-year periodOver a three-year periodLegacy Victory Capital AUMAll figures as of September 30, 2019.Over a five-year periodUSAA Fixed Income AUMOver a ten-year periodTotal AUM7
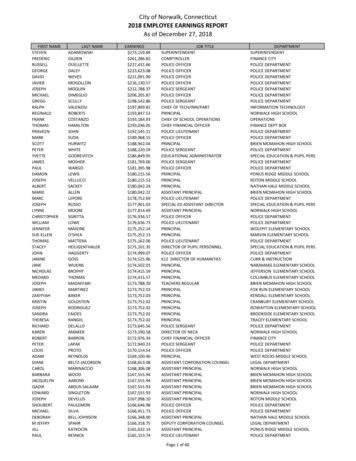
Percentage of Strategies Outperforming BenchmarksLegacy Victory ear55%82%50%25%0%USAA Fixed As of September 30, 201910-Year8
USAA Asset Management Company Integration Update9
USAA Asset Management AcquisitionIntegration UpdateLoyal USAA Members Using multiple methods to engage with members Strong digital connectivity among members: Majority of direct mutual fund and ETF purchases are made via self-service platforms 93% of member base was digitally active in 2018 Many direct channel investors take advantage of automatic investment plans Particularly 529 College Savings Plan investors Historically very high retention ratesThe New Victory Capital Investor Call Center Sales and service professionals focused on servicing USAA Members Long-tenured Member Service Representatives Familiar with USAA Member needs Serving with purpose FINRA Series 7 & 63 licensed professionals Available for personal portfolio reviews, college planning assistance, and investmentguidance for USAA members Currently meeting high-quality standards More than 150,000 total calls since acquisition closed on July 1 closeSource: Member Centric Interaction Data (MCID)10
USAA Mutual Funds Digital PresenceUSAA Mutual Funds Homepage – usaa.comSample USAA 529 College Savings Plan Campaign EmailImages are for illustrative purposes only. As of July 1, 2019, Victory Capital Management Inc. is the investment advisor for USAA Mutual Funds and the USAA 529 College Savings Plan (Plan). TheUSAA Mutual Funds and Plan are distributed by Victory Capital Advisers, Inc., a broker dealer registered with FINRA and an affiliate of Victory Capital. Victory Capital and its affiliates are not affiliatedwith United Services Automobile Association or its affiliates. USAA and the USAA logo are registered trademarks and the USAA 529 College Savings Plan logo is a trademark of United ServicesAutomobile Association and are being used by Victory Capital and its affiliates under license.11
USAA Asset Management AcquisitionIntegration Update50 Fixed Income and Solutions investment professionals retained from USAA 12 fixed income mutual funds Six taxable and six tax-exempt All 12 are four or five star rated by MorningstarNew distribution opportunity in existing channels Victory Capital’s well-established distribution teams have launched marketingof the highly rated USAA fixed income funds, ETFs, andother products via: Retail Intermediary Platforms Retirement Channel Institutional ChannelAs of July 1, 2019, Victory Capital Management Inc. is the investment advisor for USAA Mutual Funds. USAA and the USAA logos are registered trademarks of UnitedServices Automobile Association and are being used by Victory Capital and its affiliates under license. Victory Capital and its affiliates are not affiliated with USAA or itsaffiliates. Use of the term “member” or “membership” refers to membership in USAA Membership Services and does not convey any legal or ownership rights in USAA.12
Fast-Growing & Competitively PricedSolutions ProductsRULES-BASED& FACTORORIENTEDSOLUTIONS Competitive fee rates, yielding higher than firm-wide average margin on integrated platform Total AUM of 49.1Bn at September 30, 2019 Multiple mandates funded in 2019 Multi-Asset Global Dividend Customized Thematic Rules- and factor-based quantitative platform includes ETFs, mutual funds, and institutionalseparate accounts Recently added active fixed income ETFs with USAA acquisition ETF AUM has grown from 198MM in 2015 to 3.9Bn* at September 30, 2019Source: Morningstar Direct* Does not include ETFs held in proprietary mutual funds of funds or multi-asset products13
Third Quarter 2019Financial Results14
Third Quarter 2019 Financial Results3Q FLOWS ANDAUM AUM increased to 145.8Bn at September 30, 2019 Positive 3Q long-term net flows of 726MM; YTD long-term net flows of 3.3Bn Second consecutive quarter of positive long-term net flowsRECORDFINANCIALRESULTS 215MM revenue, up 135% from 2Q 0.35 GAAP Earnings per diluted share, up 75% from 2Q 0.91 Adjusted Net Income with tax benefit per diluted share, up 139% from 2Q 25.9% GAAP Operating Margin 44.8% Adjusted EBITDA MarginCAPITALMANAGEMENT 1.037Bn debt outstanding on September 30 with 63MM pay down; currently 997MMafter another 40MM paydown 7-year term loan priced at L 325 Returned 9.1MM to shareholders in 3Q15
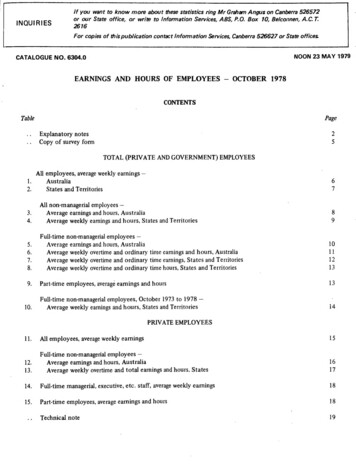
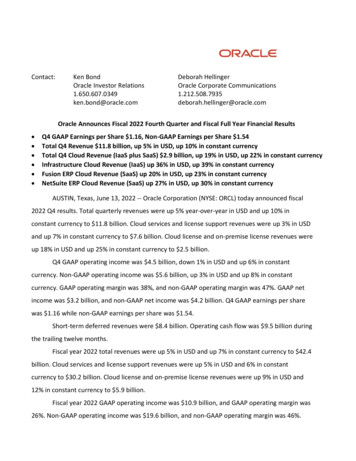
Assets Under Management (End of Period) Bn Total AUM of 145.8Bn, at September 30( mm) Up 128% fromJune 30, driven byacquired assets and net inflowsRetailInstitutionalMember 145.8 Diversified distribution channels Retail 25% Institutional 26% 128% Member 49% 58.11Q19 64.12Q193Q1916
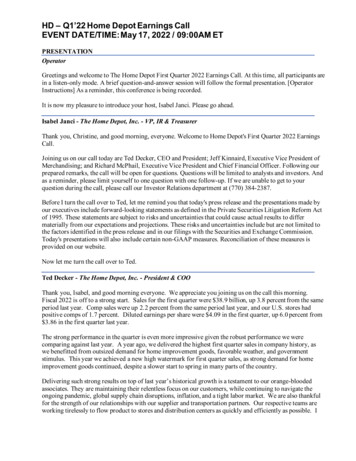
Long-Term Asset Flows Bn 3Q 2019 positive long-term net flows of 726MM3/31/18( mm) 6 franchises and Solutions generated YTDlong-term net inflowsGross SalesGross Redemptions 7.5 Long-term net inflows of 3.3Bn YTDthrough September 30Net Flows 7.5 3.0Operating Metrics1Q192Q193Q19YTD 9/30Gross long-term sales (% of starting AUM)5.7%12.9%11.6%34.1%Net long-term flows ( MM)- 1,105 3,694Net long-term flows (% of starting AUM)-2.1% 6.4% 726 1.1% 3,315 6.3%17
Revenues3/31/18( mm) Record quarterly and YTD revenue9/30/17 MM 215.0 QoQ revenue up 135% YTD revenue up 24% 105.0 101.1 92.5 Fee rate reduction in 3Q due to: 135% Temporary waiver of fulcrumfees on acquired assets, throughJuly 1, 2020 87.5 91.41Q192Q193Q19Average AUM ( Bn) 57.0 60.1 145.9Average Fee Rate (bps), as reported62.261.058.5 Mix shift to higher-margin, lowerfee channels and asset classesOperating Metrics18
Expenses MMTotal expenses increased 150% QoQ, due to: 180.99/30/173/31/18 57% increase in personnel expense from110 new hires from USAA Higher operating expenses due to increasein distribution and other asset-basedexpenses. Non-operating expense increase primarilyreflects higher interest cost and loss on debtextinguishment 68.1Operating Metrics ( MM)Personnel*Acquisition-related, restructuring & integrationOperatingNon-Operating 72.51Q192Q193Q19 34.5 35.5 55.62.84.621.228.028.582.72.83.921.519
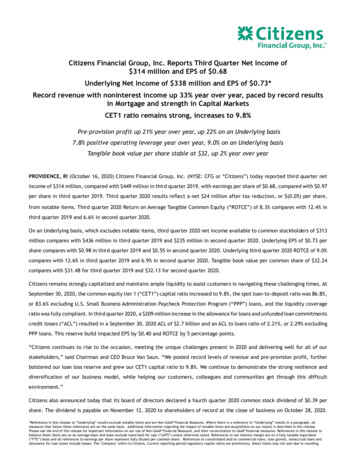
Non-GAAP Metrics9/30/173/31/18( mm) 3Q19 Adjusted Net Income (ANI)with tax benefit of 0.91 perdiluted share, up 139% 100.0 MM except per share dataANITax BenefitANI with tax benefit per diluted share 0.91 ANI with tax benefit of 67.3MM0.91 0.80 60.5MM ANI, up 148% 6.8MM tax benefit 75.0 0.60 Adjusted EBITDA Margin of 44.8% Up 480 bps vs 2Q’19 1.00 50.0 0.33 Up 640 bps vs 1Q’19 0.38 60.5 0.400.38 25.00.35 0.20 21.9 24.4 - 0.00Operating Metrics1Q192Q193Q19Adjusted EBITDA ( MM) 33.6 36.6 96.3Adjusted EBITDA Margin38.4%40.0%44.8%Adjusted measures are non-GAAP financial measures. Reconciliations and explanations of these non-GAAP financial measures are provided at the end of this presentation.20
Capital Management9/30/173/31/18( mm) Cash balance increased from 51.5MMat Dec. 31, 2018, to 79.0MM at Sept30, 2019 Repurchased 300K shares in 3Q19 Declared second quarterly cashdividend of 0.05 per share, payable onDecember 26 Returned 9.1MM to shareholdersGAAP Operating Cash Flow( MM)Selected Balance Sheet Items ( MM)9/30/19Cash / Cash Equivalents 79.0Debt 1.037BnStockholders' Equity 506.7Diluted Shares Outstanding (MM)73.7Net Debt / Proforma EBITDA1 (at Sep. 30, 2019)2.4xLeverage Ratio1Debt ( MM) 118.4 1,0372.4x1.6x 31.4 280 2801Q192Q191.5x 17.91Q191 Net2Q193Q193Q191Q192Q193Q19Debt/Proforma EBITDA ratio was 2.4x at 9.30.19, based on post-synergy run-rate Adjusted EBITDA of approximately 400MM, and net debt of 958MM from 1,037MM in debt, less 79MM in cash.21
Enhancing Shareholder Value withBalance Sheet FlexibilityInterestShareRepurchasesReturns toShareholdersAcquisitionsDividendsDe-leveraging& AcquisitionsCap ExDe-leverageEnhancing Shareholder Value by:Maintaining Balance Sheet Flexibility with: Improving platform with strategic acquisitions Strategic capital allocation policy Growing earnings in face of industry headwinds Strong free cash flow generation Gaining efficiency from integrated platform Capacity to quickly de-leverage Expanding margins by increasing scale and efficiency Ancillary cash dividend Evaluating numerous consolidation opportunities Minor share repurchases Being acquirer of choice for many asset managers Minimal capital expenditures, due to outsourcing22
Reaffirming & Accelerating Proforma Guidance 120MM in total cost synergiesANNUALCOSTSYNERGIES Greater than 75MM of costs removed, as of July 1 close 105MM of costs removed, as of Sep 30; timing faster than plan 120MM of costs removed by 3Q 2020 50MM one-time cost to achieve synergies ( 18MM through 3Q)ADJUSTED EPSACCRETION Greater than 40% in 2019CASH FLOWAND BALANCESHEET Adjusted EBITDA margin of 46%, when fully integrated Greater than 100% in 2020 Free cash flow of 70%-75% of adjusted EBITDA Ability to rapidly de-leverage23
Appendix24
Notes and DisclosuresInformation Regarding Non-GAAP Financial MeasuresVictory Capital uses non-GAAP financial measures referred to as Adjusted EBITDA and Adjusted Net Income to measure theoperating profitability of the Company. These measures eliminate the impact of one-time acquisition, restructuring and integrationcosts and demonstrate the ongoing operating earnings metrics of the Company. The Company has included these non-GAAPmeasures to provide investors with the same financial metrics used by management to assess the operating performance of theCompany. Due to rounding, numbers presented in the following tables may not add up to precisely the totals provided.Adjusted EBITDAAdjustments made to GAAP Net Income to calculate Adjusted EBITDA, as applicable, are: Adding back income tax expense;Adding back interest paid on debt and other financing costs net of interest income;Adding back depreciation on property and equipment;Adding back other business taxes;Adding back amortization expense on acquisition-related intangible assets;Adding back stock-based compensation expense associated with equity awards issued from pools created in connection withthe management-led buyout and various acquisitions and as a result of equity grants related to the IPO;Adding back direct incremental costs of acquisitions and the IPO, including restructuring costs;Adding back debt issuance cost expense;Adding back pre-IPO governance expenses paid to the Company’s private equity partners that terminated as of the completionof the IPO; andAdjusting for earnings/losses on equity method investments.25
Notes and DisclosuresInformation Regarding Non-GAAP Financial Measures (cont.)Adjusted Net IncomeAdjustments made to GAAP Net Income to calculate Adjusted Net Income, as applicable, are: Adding back other business taxes; Adding back amortization expense on acquisition-related intangible assets; Adding back stock-based compensation expense associated with equity awards issued from pools created in connection withthe management-led buyout and various acquisitions and as a result of any equity grants related to the IPO; Adding back direct incremental costs of acquisitions and the IPO, including restructuring costs; Adding back debt issuance cost expense; Adding back pre-IPO governance expenses paid to the Company’s private equity partners that terminated as of the completionof the IPO; and Subtracting an estimate of income tax expense applied to the sum of the adjustments above.Tax Benefit of Goodwill and Acquired Intangible AssetsDue to Victory Capital’s acquisitive nature, tax deductions allowed on acquired intangible assets and goodwill provide it withadditional significant supplemental economic benefit. The tax benefit of goodwill and intangible assets represent the tax benefitsassociated with deductions allowed for intangible assets and goodwill generated from prior acquisitions in which the Companyreceived a step-up in basis for tax purposes. Acquired intangible assets and goodwill may be amortized for tax purposes,generally over a 15-year period. The tax benefit from amortization on these assets is included to show the full economic benefit ofdeductions for all acquired intangible assets with a step-up in tax basis.26
Consolidated Reconciliations of Adjusted EBITDAFor the three months ended,(in thousands)9/30/2018GAAP Net income 20,59012/18/2018 13,9153/31/2019 14,5276/30/2019 14,3839/30/2019 25,992GAAP Income tax expense(6,562)(4,777)(4,807)(4,478)(8,058)GAAP income before 3,61318,388Depreciation775709571612682Other business taxes350337555424146GAAP amortization of acquisition-related intangibles4,7994,6514,6514,6517,086Stock-based compensation4,0053,9431,4783,3214,326Acquisition, restructuring and exit costs1,6473,6642,7774,57524,452Debt issuance costs37337136436610,002Earnings/losses from equity method investments1672244150(2,837)Interest expenseAdjusted EBITDA 43,321 36,388 33,587 36,573 96,295Revenue (in thousands) 108,082 95,967 87,479 91,360 214,980Adjusted EBITDA Margin40.1%37.9%38.4%40.0%44.8%27
Detailed Reconciliation of3Q19 Adjusted Net IncomeThree months ended September 30, 2019Adjustments(in thousands, except per-share amounts)OtherBusinessTaxesU.S. GAAPBasisRevenueInvestment management fees Fund administration and distribution feesGAAPAmortization tionAcquisition,Restructuring andExit CostsDebtIssuanceCosts155,406TotalAdjustments 59,574Total revenue214,980-----–Non-GAAPBasis Tax Benefit ofGoodwill esPersonnel compensation and benefits (1)55,556Distribution and other asset-based expenses (2)57,202General and administrative (2)17,654Depreciation and amortization ition-related costs (2)Restructuring and integration costs (2)Total operating expensesIncome/(loss) from operations50,025-7,768Change in value of consideration payable for acquisition ofbusiness Other income (expense)Interest income and other income/(expense) (3)2,742Interest expense and other financing costs (3)(16,856)Loss on debt extinguishment (3)(7,409)Total other income (expense), net(21,523)Income/(loss) before income taxes34,050Income tax (expense)/benefit(8,058)Net income/(loss) 25,992Earnings per share—basic Earnings per share—diluted 7,0864,32624,45210,00246,01280,062(37) 110(1,772) 5,315(1,082) 3,245(6,113) 18,339(2,501) 7,502(11,503) 34,509(19,561)6,802 60,501 6,8020.38 0.89 0.100.35 0.82 0.09Weighted average shares outstanding—basic67,72467,72467,724Weighted average shares outstanding—diluted73,67173,67173,671Personnel (1)55,55650,025Operating (2)103,85169,03221,52315,861 67,303 0.91Memo: ExpensesNon-Operating (3)28
Detailed Reconciliation of2Q19 Adjusted Net IncomeThree months ended June 30, 2019Adjustments(in thousands except, per-share amounts)OtherBusinessTaxesU.S. GAAPBasisRevenueInvestment management fees GAAPAmortization tionAcquisition,Restructuring andExit CostsDebtIssuanceCosts78,042Fund administration and distribution fees13,318Total revenue91,360TotalAdjustments -----–Non-GAAPBasis Tax Benefit ofGoodwill Personnel compensation and benefits (1)35,542Distribution and other asset-based expenses (2)16,182General and administrative (2)7,087Depreciation and amortization (2)5,263Change in value of consideration payable for acquisition ofbusiness 63(4,651)612(14)(14)Acquisition-related costs (2)2,787(2,787)(2,787)Restructuring and integration costs (2)1,788(1,788)(1,788)--Total operating )55,664Income/(loss) from 66366Other income (expense)Interest income and other income/(expense) (3)656Interest expense and other financing costs (3)-(4,520)Loss on debt extinguishment (3)-Total other income (expense), net(3,864)Income/(loss) before income taxes18,861Income tax (expense)/benefit-(4,478)Net income/(loss) 14,383Earnings per share—basic Earnings per share—diluted 3,337(106) 318(1,163) 3,488(830) 2,491(1,144) 3,431(92) 274(3,498)32,198(3,334) 10,002(7,812)3,361 24,386 3,3610.21 0.36 0.050.20 0.33 0.05Weighted average shares outstanding—basic67,58367,58367,583Weighted average shares outstanding—diluted73,52173,52173,521Personnel (1)35,54232,221Operating (2)33,09323,4433,8643,498 27,747 0.38Memo: ExpensesNon-Operating (3)29
Detailed Reconciliation of3Q18 Adjusted Net IncomeThree months ended September 30, 2018(in thousands, except per-share amounts)AdjustmentsOtherBusinessTaxesU.S. GAAPBasisRevenueInvestment management fees Fund administration and distribution feesGAAPAmortizationof onAcquisition,Restructuring andExit CostsDebt asis 15,557Total revenueTax Benefit ofGoodwill ,082-ExpensesPersonnel compensation and benefits (1)38,027Distribution and other asset-based expenses (2)24,269General and administrative (2)6,951Depreciation and amortization (2)Change in value of consideration payable foracquisition of business (2)Acquisition-related costs structuring and integration costs (2)-1,451(1,451)---Total operating 67Income/(loss) from r income (expense)Interest income and other income/(expense) (3)Interest expense and other financing costs (3)Loss on debt extinguishment (3)Total other income (expense), netIncome/(loss) before income 89)38,326Income tax (expense)/benefit196373–350(6,562)Net income/(loss) 20,590Earnings per share—basic Earnings per share—diluted –4,799(88) 262–4,005(1,200) 3,5991961,647(1,001) 3,004373373(412) 1,235(93) 280 (9,356)–3,318 28,970 0.30 0.43 0.29 0.40 3,318 32,2880.050.05Weighted average shares outstanding—basic67,97267,97267,972Weighted average shares outstanding—diluted71,86471,86471,864Personnel (1)38,02734,022Operating (2)38,24531,645Non-Operating (3)4,6584,089 0.45Memo: Expenses30
Detailed Reconciliation of9-mo ‘19 Adjusted Net IncomeNine months ended September 30, 2019Adjustments(in thousands, except per-share amounts)OtherBusinessTaxesU.S. GAAPBasisRevenueInvestment management fees Fund administration and distribution feesGAAPAmortizationof onAcquisition,Restructuring andExit CostsDebt IssuanceCosts307,859TotalAdjustments 85,960Total revenue393,819-----–Non-GAAPBasis Tax Benefit ofGoodwill esPersonnel compensation and benefits (1)125,599Distribution and other asset-based expenses (2)89,151General and administrative (2)31,828Depreciation and amortization (2)18,253Change in value of consideration payable for acquisition ofbusiness uisition-related costs (2)Restructuring and integration costs otal operating 0)(62,782)230,614Income/(loss) from 163,2051,6501,650Other income (expense)Interest income and other income/(expense) (3)5,231Interest expense and other financing costs (3)-(26,000)Loss on debt extinguishment (3)(7,409)Total other income (expense), net(28,178)Income/(loss) before income taxes72,245Income tax (expense)/benefit(17,343)Net income/(loss) 54,902Earnings per share—basic Earnings per share—diluted 2516,3889,12531,80410,73269,174(281) 5,231(24,350)844(4,097) 12,291(2,281) 6,844(7,951) 23,853(2,683) 8,049141,419(17,293) 51,881(34,636)13,523 106,783 13,5230.81 1.58 0.200.75 1.46 0.18Weighted average shares outstanding—basic67,61067,61067,610Weighted average shares outstanding—diluted73,30073,30073,300Memo: ExpensesPersonnel (1)Operating (2)Non-Operating (3)125,599167,79728,178115,269115,34521,786 120,306 1.6431
Detailed Reconciliation of9-mo ‘18 Adjusted Net IncomeNine months ended September 30, 2018(in thousands, except per-share amounts)AdjustmentsOtherBusinessTaxesU.S. GAAPBasisRevenueInvestment management fees Fund administration and distribution feesGAAPAmortizationof onAcquisition,Restructuring andExit CostsDebt Basis 46,792Total revenueTax Benefit ofGoodwill 7,445-ExpensesPersonnel compensation and benefits (1)111,970Distribution and other asset-based expenses (2)73,557General and administrative (2)23,095Depreciation and amortization (2)17,917Change in value of consideration payable foracquisition of business ,624(15,670)2,247(4)Acquisition-related costs (2)(4)1,446Restructuring and integration costs (2)(1,446)702Total operating expensesIncome/(loss) from 51,898138121,346Other income (expense)Interest income and other income/(expense) (3)(229)Interest expense and other financing costs (3)31081(16,256)Loss on debt extinguishment (3)(6,058)Total other income (expense), net(22,543)Income/(loss) before income taxes66,219Income tax (expense)/benefit1,3374,201– 49,789Earnings per share—basic Earnings per share—diluted –1,168(16,430)Net income/(loss)(14,919)15,670(292) 876–11,295(3,918) 11,753(2,824) 8,4715,538–2,7257,436138(681) (1,857)3102,044(1,859) 5,577(16,695)104,651(35) 104(26,038) 78,6130.76 0.71 9,958 9,9581.19 0.151.12 0.14Weighted average shares outstanding—basic65,81765,81765,817Weighted average shares outstanding—diluted70,16870,16870,168 88,571 321.26
Consolidated Reconciliation of Adjusted Net IncomeFor the three months ended,(in thousands, except per-share data)9/30/2018GAAP Net Income Other business taxes20,59012/18/2018 13,9153/31/2019 14,5276/30/2019 14,3839/30/2019 25,992350337555424146GAAP amortization of acquisition-related intangibles4,7994,6514,6514,6517,086Stock-based compensation4,0053,9431,4783,3214,326Acquisition, restructuring and exit ebt issuance costsTax effect of above adjustmentsAdjusted Net IncomeTax benefit of goodwill and acquired intangiblesAdjusted Net Income with Tax Benefit Weighted average shares outstanding – dilutedAdjusted Net income with Tax BenefitPer Diluted 88 71,864 0.4526,960 71,558 0.3825,257 72,282 0.3527,747 73,521 0.3867,30373,671 0.9133
Notes and DisclosuresInvesting involves risk, including the potential loss of principal. There are no assurances that any fund will achieve its statedobjective. All data in this presentation, unless otherwise noted, is as of September 30, 2019.Past performance does not guarantee future results. A fund’s most recent performance can be found at vcm.com. 54 mutualfunds and ETFs did not have 4- or 5- star overall ratings. 32% of AUM in mutual funds and ETFs did not receive overall rating of 4or 5 stars.Consider the investment objectives, risks, charges and expenses of the funds carefully before investing. Download a prospectusor summary prospectus, if available, containing this and other important information for USAA mutual funds fromwww.usaa.com/prospectus, for Victory mutual funds from www.victoryfunds.com, or for VictoryShares and VictoryShares USAAETFs from www.victorysharesliterature.com. Read it carefully before investing.Victory Mutual Funds and USAA Mutual Funds are distributed by Victory Capital Advisers, Inc. (VCA). VictoryShares ETFs andVictoryShares USAA ETFs are distributed by Foreside Fund Services, LLC (Foreside). VCA and Foreside are members of FINRAand SIPC. Victory Capital Management Inc. (VCM) is the investment adviser to the Victory Mutual Funds, USAA Mutual Funds,VictoryShares ETFs and VictoryShares USAA ETFs. VCA and VCM are not affiliated with Foreside. USAA is not affiliated withForeside, VCM, or VCA.The Morningstar Rating for funds, or “star rating,” is calculated for managed products (including mutual funds, variable annuity andvariable life subaccounts, exchange-traded funds, closed-end funds, and separate accounts) with at least a three-year history.Exchange-traded funds and open-ended mutual funds are considered a single population for comparative purposes. It iscalculated based on a Morningstar Risk-Adjusted Return measure that accounts for variation in a managed product’s monthlyexcess performance, placing more emphasis on downward variations and rewarding consistent performance. The top 10% ofproducts in each product category receive 5 stars, the next 22.5% receive 4 stars, the next 35% receive 3 stars, the next 22.5%receive 2 stars, and the bottom 10% receive 1 star. The Overall Morningstar Rating for a managed product is derived from aweighted average of the performance figures associated with its three-, five-, and ten-year (if applicable) Morningstar Ratingmetrics. The weights are: 100% three-year rating for 36–59 months of total returns, 60% five-year rating/40% three-year rating for60–119 months of total returns, and 50% ten-year rating/30% five-year rating/20% three-year rating for 120 or more months oftotal returns. While the ten-year overall star rating formula seems to give the most weight to the ten-year period, the most recentthree-year period actually has the greatest impact because it is included in all three rating periods. Ratin
Available for personal portfolio reviews, college planning assistance, and investment . As of July 1, 2019, Victory Capital Management Inc. is the investment advisor for USAA Mutual Funds and the USAA 529 College Savings Plan (Plan). The USAA Mutual Funds and Plan are distributed by Victory Capital Advisers, Inc., a broker dealer registered .