Transcription
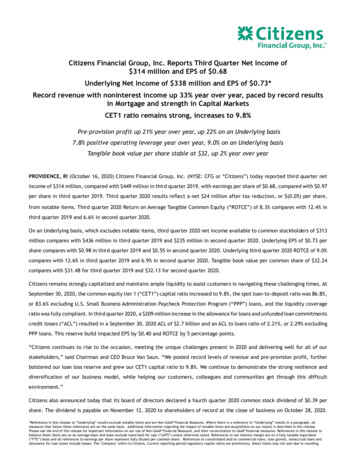
Citizens Financial Group, Inc. Reports Third Quarter Net Income of 314 million and EPS of 0.68Underlying Net Income of 338 million and EPS of 0.73*Record revenue with noninterest income up 33% year over year, paced by record resultsin Mortgage and strength in Capital MarketsCET1 ratio remains strong, increases to 9.8%Pre-provision profit up 21% year over year, up 22% on an Underlying basis7.8% positive operating leverage year over year, 9.0% on an Underlying basisTangible book value per share stable at 32, up 2% year over yearPROVIDENCE, RI (October 16, 2020) Citizens Financial Group, Inc. (NYSE: CFG or “Citizens”) today reported third quarter netincome of 314 million, compared with 449 million in third quarter 2019, with earnings per share of 0.68, compared with 0.97per share in third quarter 2019. Third quarter 2020 results reflect a net 24 million after-tax reduction, or (0.05) per share,from notable items. Third quarter 2020 Return on Average Tangible Common Equity (“ROTCE”) of 8.3% compares with 12.4% inthird quarter 2019 and 6.6% in second quarter 2020.On an Underlying basis, which excludes notable items, third quarter 2020 net income available to common stockholders of 313million compares with 436 million in third quarter 2019 and 235 million in second quarter 2020. Underlying EPS of 0.73 pershare compares with 0.98 in third quarter 2019 and 0.55 in second quarter 2020. Underlying third quarter 2020 ROTCE of 9.0%compares with 12.6% in third quarter 2019 and 6.9% in second quarter 2020. Tangible book value per common share of 32.24compares with 31.48 for third quarter 2019 and 32.13 for second quarter 2020.Citizens remains strongly capitalized and maintains ample liquidity to assist customers in navigating these challenging times. AtSeptember 30, 2020, the common equity tier 1 (“CET1”) capital ratio increased to 9.8%, the spot loan-to-deposit ratio was 86.8%,or 83.6% excluding U.S. Small Business Administration Paycheck Protection Program (“PPP”) loans, and the liquidity coverageratio was fully compliant. In third quarter 2020, a 209 million increase in the allowance for loans and unfunded loan commitmentscredit losses (“ACL”) resulted in a September 30, 2020 ACL of 2.7 billion and an ACL to loans ratio of 2.21%, or 2.29% excludingPPP loans. This reserve build impacted EPS by 0.40 and ROTCE by 5 percentage points.“Citizens continues to rise to the occasion, meeting the unique challenges present in 2020 and delivering well for all of ourstakeholders,” said Chairman and CEO Bruce Van Saun. “We posted record levels of revenue and pre-provision profit, furtherbolstered our loan loss reserve and grew our CET1 capital ratio to 9.8%. We continue to demonstrate the strong resilience anddiversification of our business model, while helping our customers, colleagues and communities get through this difficultenvironment.”Citizens also announced today that its board of directors declared a fourth quarter 2020 common stock dividend of 0.39 pershare. The dividend is payable on November 12, 2020 to shareholders of record at the close of business on October 28, 2020.*References in this release to “Underlying” results exclude notable items and are Non-GAAP Financial Measures. Where there is a reference to “Underlying” results in a paragraph, allmeasures that follow these references are on the same basis. Additional information regarding the impact of notable items and Acquisitions on our results is described in this release.Please see the end of this release for important information on our use of Non-GAAP Financial Measures, and their reconciliation to GAAP financial measures. References in this release tobalance sheet items are on an average basis and loans exclude loans held for sale (“LHFS”) unless otherwise noted. References to net interest margin are on a fully taxable equivalent(“FTE”) basis and all references to earnings per share represent fully diluted per common share. References to consolidated and/or commercial loans, loan growth, nonaccrual loans andallowance for loan losses include leases. The "Company" refers to Citizens. Current reporting-period regulatory capital ratios are preliminary. Select totals may not sum due to rounding.
Citizens Financial Group, Inc.The quarterly dividend is 8% higher than the year-ago quarter.Third quarter 2020 vs. second quarter 2020Key highlights Record pre-provision net revenue (“PPNR”) of 803 million, up 4%. Record Underlying PPNR of 834 million, up 6%,driven by record noninterest income and well-controlled expenses. Third quarter 2020 results reflect a net 24 million after-tax reduction, or (0.05) per share, from notable itemscompared with a net 10 million after-tax reduction, or ( 0.02) per share, in second quarter 2020. Efficiency ratio of 55.2%; Underlying efficiency ratio of 53.4% compares with 54.9% in second quarter 2020, reflectingrecord revenue and well-controlled expenses. Operating leverage was 1.3%, or 2.6% on an Underlying basis, reflectingcontinued strong focus on top-line growth and expense management. Provision for credit losses of 428 million includes a reserve build of 209 million. This compares with a provision of 464 million in second quarter 2020, which included a 317 million reserve build. ROTCE of 8.3% reflects the provision build associated with COVID-19 impacts. Underlying ROTCE of 9.0% compares with6.9% in second quarter 2020. Capital remains strong, with the CET1 ratio increasing to 9.8% compared with 9.6% at June 30, 2020. During the third quarter 2020, Citizens paid 168 million in dividends to common shareholders. Tangible book value per common share of 32.24 compares with 32.13 at June 30, 2020.Results Record revenue of 1.8 billion, up 2.4% reflecting record noninterest income, up 11%, largely offset by lower net interestincome, down 2%. Net interest income of 1.1 billion was down 2% given the impact of lower interest rates and a 1% decrease ininterest-earning assets as line draws were repaid, partly offset by an improvement in funding mix and disciplineddeposit pricing actions. Net interest margin of 2.83% was down 5 basis points reflecting the impacts of lower interest rates, higher cashbalances and day count, which were partially offset by improved funding mix and disciplined deposit pricing actions.Interest-bearing deposit costs decreased 13 basis points. Record noninterest income of 654 million, up 11% reflecting record mortgage banking fees, higher service chargesand fees, strength in trust and investment services fees, as well as higher card fees and higher letter of credit andloan fees given increased customer activity. Other income includes the gain on sale of education loans. These resultswere partially offset by a decrease in foreign exchange and interest rate products given lower customer hedgingactivity. Noninterest expense of 988 million increased 1% and includes the impact of notable items. On an Underlying basis,noninterest expense of 957 million was down slightly given strong expense discipline, as well as lower other operatingexpense. Provision for credit losses of 428 million includes a reserve build of 209 million, primarily driven by commercial.2
Citizens Financial Group, Inc.Third quarter 2020 net charge offs were 219 million, up from 147 million, reflecting an increase in commercial, dueto one credit to a mall REIT and one in metals and mining. This compares to second quarter 2020 provision for creditlosses of 464 million which included a 317 million net reserve build primarily tied to COVID-19 impacts. In secondquarter 2020, approximately 100 million of credit reserves associated with loans transferred to held-for-sale werereallocated to the remaining loan portfolio.Balance sheet Average interest-earning assets decreased 2.2 billion, or 1%, driven by a 3% decrease in loans, reflecting a decreasein commercial loans driven by line of credit repayments and retail loan sales activity tied to balance sheet optimizationstrategies, partly offset by an increase in average PPP loans. Loans were up very slightly before the impact of PPPloans, commercial line draws and loan sales activity. Average deposits were broadly stable as a decrease in term deposits was largely offset by growth in demand depositsand savings. Average loan-to-deposit ratio of 88.4%, or 85.0% excluding PPP loans, compares with 90.9% in second quarter 2020. Allowance coverage for loans of 2.21%, or 2.29% excluding PPP loans, compares with 2.01%, or 2.09% excluding PPP loans,as of June 30, 2020. Nonaccrual loans to loans ratio of 1.03% compares with 0.79% as of June 30, 2020. Allowance coverage of nonaccrual loans of 214% compares with 255% as of June 30, 2020.Third quarter 2020 vs. third quarter 2019Key highlights Record PPNR of 803 million, up 21%. Record Underlying PPNR of 834 million, up 22%, with record revenue driven byrecord results in mortgage banking and strength in capital markets, and well-controlled expenses. Third quarter 2020 results reflect a net 24 million after-tax reduction, or (0.05) per share, from notable itemscompared with a net 4 million after-tax reduction, or (0.01) per share, in third quarter 2019. ROTCE of 8.3%, with Underlying ROTCE of 9.0%. Results reflect an efficiency ratio of 55.2%, while the Underlying efficiency ratio was 53.4%. Operating leverage was7.8%, with Underlying operating leverage of 9.0% reflecting continued strong focus on top-line growth and expensemanagement. Provision for credit losses of 428 million includes a reserve build of 209 million primarily driven by commercial. Thirdquarter 2020 net charge offs were 219 million. Tangible book value per share of 32.24, up 2%. Fully diluted average common shares outstanding decreased by 19.1million shares, or 4%.Results Record revenue increased 153 million, or 9%, reflecting record noninterest income and a slight decrease in net interestincome. Net interest income was down 1%, as lower net interest margin was only partially offset by 9% growth in interestearning assets, including the addition of PPP loans.3
Citizens Financial Group, Inc. Net interest margin of 2.83%, down 29 basis points, reflects the impact of lower interest rates and higher cashbalances given strong deposit flows, partially offset by improved funding mix and lower funding costs. Interestbearing deposit costs decreased 89 basis points, reflecting strong pricing discipline. Record noninterest income of 654 million was up 33%, driven by record mortgage banking fees given strongorigination volumes and gain-on-sale margins, as well as strength in capital markets fees and trust and investmentservices fees. Service charges and fees, card fees and foreign exchange and interest rate products were lowerreflecting COVID-19 impacts. Other income includes the gain on sale of education loans and increased from thirdquarter 2019 which included a benefit related to a lease restructuring. Noninterest expense of 988 million was up 2%. Underlying noninterest expense of 957 million, was up slightly reflectinghigher equipment and software expense given continued investments in technology, higher outside services and highersalaries and employee benefits tied to strong mortgage banking results. These were partially offset by lower otheroperating expense given lower travel and advertising costs, as well as a 10 million charge related to a lease restructuringin the prior year. Provision for credit losses of 428 million includes a reserve build of 209 million, primarily driven by commercial. Thethird quarter 2019 provision for credit losses was 101 million. Third quarter 2020 net charge offs were 219 million,up from 113 million, reflecting COVID-19-related impacts in commercial.Balance Sheet Average interest-earning assets increased 13.7 billion, or 9%, driven by 7% loan growth, which includes the 4.7 billionimpact of the PPP loans, and 14% growth in the investment portfolio given higher interest-bearing cash balances drivenby strong deposit flows. Loan growth was 4% excluding the impact of PPP loans, commercial line draws and retail loansales activity tied to balance sheet optimization strategies. Average deposits increased 17.4 billion, or 14%, reflecting growth in demand deposits, money market accounts, savingsand checking with interest, partially offset by a decrease in term deposits. Average loan-to-deposit ratio of 88.4%, or 85.0% excluding PPP loans, compares with 94.6% in third quarter 2019. Allowance coverage for loans of 2.21%, or 2.29% excluding PPP loans, compares with 1.11% as of September 30, 2019,reflecting the first quarter 2020 implementation of CECL and the subsequent reserve increases primarily associatedwith COVID-19 impacts. Nonaccrual loans to loans ratio of 1.03% compares with 0.63% as of September 30, 2019. Allowance coverage of nonaccrual loans of 214% compares with 177% as of September 30, 2019, reflecting the firstquarter 2020 implementation of CECL and the subsequent reserve increases primarily associated with COVID-19 impacts.4
Citizens Financial Group, Inc.Earnings highlights:Quarterly Trends3Q20 change from( s in millions, except per share data)3Q202Q203Q192Q20EarningsNet interest income /bps Noninterest incomeTotal revenue1,137 1,160 1,145 3Q19%(23) /bps(2) % %(8)(1) st expense98897997391152Pre-provision profit80377166532413821Provision for credit losses428464101(36)(8)327NMNet income3142534496124(135)(30)(3)(11)Preferred dividendsNet income available to common stockholders25 289Underlying net income Underlying net income available to commonstockholdersAverage common shares outstanding 28 225338 313 After-tax notable Items17 432263 453 75235 436 782410 46428 %14847 (143)29 % (115)(25) %33 % (123)(28) %(4)140(33) %20NMBasic (in millions)426.8426.6445.70.2—(18.9)Diluted (in millions)428.0427.6447.10.4—(19.1)(4)Diluted earnings per share 0.68 0.53 0.97 0.1528 % (0.29)(30) %Underlying diluted earnings per share 0.73 0.55 0.98 0.1833 % (0.25)(26) %Performance metricsNet interest margin2.82 %2.87 %3.10 %(5) bpsNet interest margin, FTE2.832.883.12(5)(28) bps(29)Effective income tax rate16.117.720.5(159)(436)Efficiency ratio555659(73)(422)Underlying efficiency ratio535558(141)(478)Return on average common equity5.64.48.4116(275)Return on average tangible common equity8.36.612.4171(411)Underlying return on average tangible common equity9.06.912.6210(358)Return on average total assets0.700.571.1013(40)Underlying return on average total tangible assets0.79 %0.61 %1.16 %18 bps(37) bps9.6 %10.3 %Capital adequacy(1,2)Common equity tier 1 capital ratioTotal capital ratioTier 1 leverage ratioAllowance for credit losses to loans and leases9.8 %13.313.19.59.313.09.92.21 %2.01 %1.11 %20 bps110 bps1.03 %0.79 %0.63 %24 bps40 bpsAsset quality(2)Nonaccrual loans and leases to loans and leasesAllowance for credit losses to nonaccrual loans andleases214255177Net charge-offs as a % of average loans and leases0.70 %0.46 %0.38 %1) Current reporting-period regulatory capital ratios are preliminary.2) Capital adequacy and asset-quality ratios calculated on a period-end basis, except net charge-offs.5NMNM24 bps32 bps
Citizens Financial Group, Inc.Notable items:Third and second quarter 2020 and third quarter 2019 results reflect notable items primarily related to TOP 6 transformational andrevenue and efficiency initiatives. Third and second quarter 2020 and third quarter 2019 results also reflect notable items relatedto integration costs primarily tied to the August 1, 2018 Franklin American Mortgage Company ("FAMC") acquisition. These notableitems have been excluded from reported results to better reflect Underlying operating results.Cumulative after-tax integration costs related to the FAMC acquisition totaled 34 million through the end of third quarter 2020.Cumulative after-taxintegration costsNotable items - integration costs( s in millions, except per share data)Noninterest incomeSalaries & benefits3Q20Pre-tax 2Q20After-tax— — ther— — — — — — — — (3) — (3)— — — — — (1) (1) — (10) — (10)Equipment & software(1)(1)——————Outside —————Other (20)—(1)—(1)—(2)—(5) (36)(5) (39)(0.01)Noninterest expense (2) (2) — (2) (1) — (4) (3) (0.01) (31)Total Integration costs (2) (2) — (2) (1) — (4) (3) (0.01) (34)Other notable items - primarily tax and TOP3Q20( s in millions, except per share data)Pre-taxTax notable items —2Q20After-tax —EPS Pre-tax— —3Q19After-tax 4EPSPre-tax 0.01 —After-tax 10EPS 0.02Other notable items - TOP & other actionsSalaries & de )(1)(3)(2)——OccupancyNoninterest expenseTotal——— (29) (22) (0.05) (17) (13) (0.03) (15) (11)Total other notable items (29) (22) (0.05) (17) (9) (0.02) (15) (1) Total notable items (31) (24) (0.05) (19) (10) (0.02) (19) (4) (0.01)6 (0.03)— (2)
Citizens Financial Group, Inc.The following table provides information on Underlying results before the impact of notable items.Underlying results:Quarterly Trends3Q20 change from( s in millions, except per share data)Net interest incomeNoninterest incomeTotal revenueNoninterest expenseNotable itemsUnderlying noninterest expenseUnderlying pre-provision profitProvision for credit lossesNet income available to common stockholdersUnderlying net income available to common stockholdersPerformance metricsDiluted EPSUnderlying EPSEfficiency ratioUnderlying efficiency ratioReturn on average tangible common equityUnderlying return on average tangible common equityOperating leverageUnderlying operating leverage3Q202Q203Q192Q203Q19 1,137654 1,79198831 957834428289313 1,160590 1,75097919 960790464225235 1,145493 1,63897319 954684101432436(2) %112%163—%6(8)2833(1) %339%263—%22NM(33)(28)28 %33 %(73) bps(141)171210 bps1.32.6 %(30) %(26) %(422) bps(478)(411)(358) bps7.89.0 % 70.68 0.73 55 %538.39.0 %0.53 0.55 56 %556.66.9 %0.970.9859 %5812.412.6 %
Citizens Financial Group, Inc.Discussion of results:3Q20 change fromNet interest income( s in millions)3Q202Q203Q192Q20 /bps3Q19% /bps%Interest income:Interest and fees on loans and leasesand loans held for sale Investment securities 1,219121Interest-bearing deposits in banksTotal interest income 1,1571,3771302 1(5) % (62)153(9)81(16) %(220)(7)100(32)(21)(6)(75) 1,280 1,350 1,538 (70)(5) % (258)(17) % 89 124 297 (35)(28) % (208)(70) %Interest expense:DepositsShort-term borrowed funds——2——
The quarterly dividend is 8% higher than the year-ago quarter. Citizens Financial Group, Inc. 2 Third quarter 2020 vs. second quarter 2020 Key highlights
