Transcription
FB Earnings Presentation Q3 2021investor.fb.com
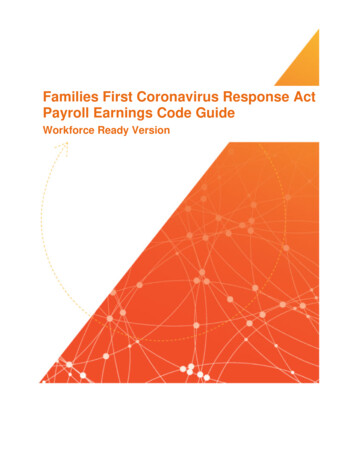
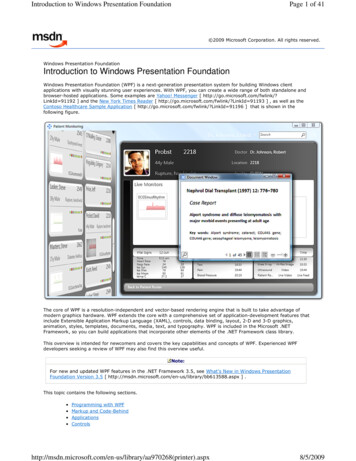
Facebook Daily Active Users (DAUs)In 1678699Rest of 189190195198196195195195196US & se see Facebook's most recent quarterly or annual report filed with the SEC for definitions of user activity used to determine the number of our Facebook DAUs and MAUs. The numbers forDAUs and MAUs do not include users on Instagram, WhatsApp, or our other products unless they would otherwise qualify as DAUs or MAUs, respectively, based on their other activities onFacebook.2
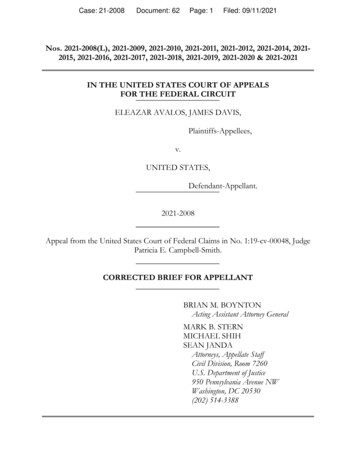
Facebook Monthly Active Users (MAUs)In 1,1661,1991,2301,2651,278Rest of 3'21Asia-PacificEuropeUS & CanadaPlease see Facebook's most recent quarterly or annual report filed with the SEC for definitions of user activity used to determine the number of our Facebook DAUs and MAUs. The numbers forDAUs and MAUs do not include users on Instagram, WhatsApp, or our other products unless they would otherwise qualify as DAUs or MAUs, respectively, based on their other activities onFacebook.3
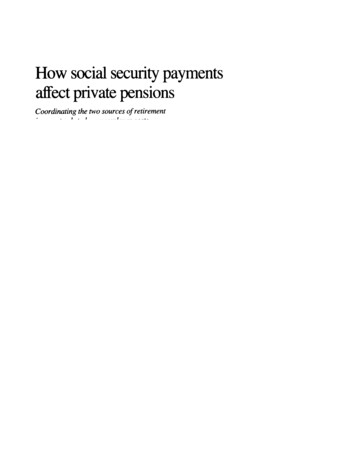
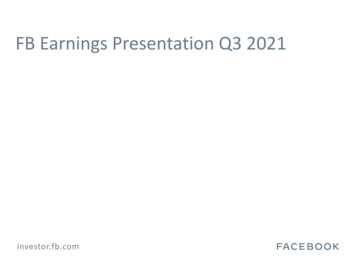
Facebook Average Revenue per User (ARPU) 53.56 10.14 7.89 0.09 7.80Q3'20 0.32 9.27 0.26 10.12 10.00 39.63 0.17 0.25 0.58 9.74 39.04Q3'21Q3'20 9.82 9.01 9.95Q4'20Q1'21Q2'21 2.28 0.02 3.64 4.05 3.94 53.01 52.34 1.44 2.00 1.97 51.28 16.87 12.41 51.58 46.06 50.34 0.13 12.28Q4'20Worldwide 3.67 48.03Q1'21Q2'21Q3'21Q3'20 0.45 4.30 0.05 4.25 0.08 0.04 0.03 3.98 3.90 4.13 2.22 0.02 2.20 2.77 2.64 0.02 0.02 2.75 2.62 0.36 17.23 16.50 0.15 0.32 16.41 15.13 17.08 16.19Q4'20Q1'21Q2'21Q3'21US & Canada 4.16 15.49Europe 3.05 3.14 0.02 0.02 3.02 21Q3'21Q3'20Q4'20Q1'21Q2'21Q3'21Rest of WorldPlease see Facebook's most recent quarterly or annual report filed with the SEC for the definition of ARPU.Revenue by Facebook user geography is geographically apportioned based on our estimation of the geographic location of our users when they perform a revenue-generating activity. Thisallocation differs from our revenue disaggregated by geography disclosure in our condensed consolidated financial statements where revenue is disaggregated by geography based on theaddresses of our customers.4
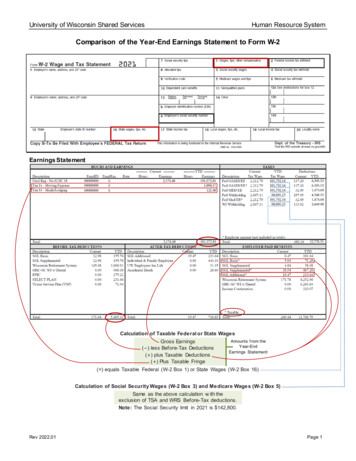
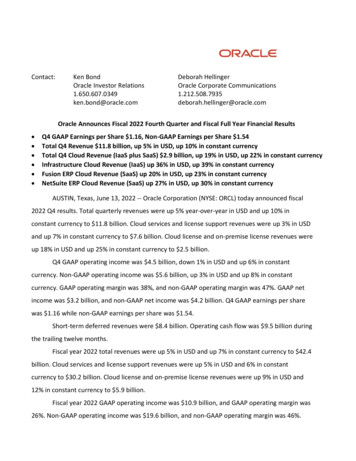
Family Daily Active People (DAP)In %78%79%79%79%79%79%79%79%DAP/MAPWe define a daily active person (DAP) as a registered and logged-in user of Facebook, Instagram, Messenger, and/or WhatsApp (collectively, our "Family" of products) who visited at least one of theseFamily products through a mobile device application or using a web or mobile browser on a given day.The numbers for DAP do not include users on our other products unless they would otherwise qualify as DAP based on their other activities on our Family products.We do not require people to use a common identifier or link their accounts to use multiple products in our Family, and therefore must seek to attribute multiple user accounts within and across productsto individual people. Our calculations of DAP rely upon complex techniques, algorithms, and machine learning models that seek to estimate the underlying number of unique people using one or more ofthese products, including by matching user accounts within an individual product and across multiple products when we believe they are attributable to a single person, and counting such group ofaccounts as one person. As these techniques and models require significant judgment, are developed based on internal reviews of limited samples of user accounts, and are calibrated against user surveydata, there is necessarily some margin of error in our estimates. For additional information, see "Limitations of Key Metrics and Other Data" located in the Appendix of this presentation. In the secondquarter of 2020, we updated our Family metrics calculations to reflect recent data from a periodic WhatsApp user survey and to incorporate certain methodology improvements, and we estimate suchupdates contributed an aggregate of approximately 40 million DAP to our reported worldwide DAP in June 2020. In the first quarter of 2021, we updated our Family metrics calculations to maintaincalibration of our models against recent user survey data, and we estimate such update contributed an aggregate of approximately 60 million DAP to our reported worldwide DAP in March 2021.5
Family Monthly Active People (MAP)In '203.30Q4'203.453.51Q1'21Q2'213.58Q3'21We define a monthly active person (MAP) as a registered and logged-in user of Facebook, Instagram, Messenger, and/or WhatsApp (collectively, our "Family" of products) who visited at least one of theseFamily products through a mobile device application or using a web or mobile browser in the last 30 days as of the date of measurement.The numbers for MAP do not include users on our other products unless they would otherwise qualify as MAP based on their other activities on our Family products.We do not require people to use a common identifier or link their accounts to use multiple products in our Family, and therefore must seek to attribute multiple user accounts within and across productsto individual people. Our calculations of MAP rely upon complex techniques, algorithms, and machine learning models that seek to estimate the underlying number of unique people using one or more ofthese products, including by matching user accounts within an individual product and across multiple products when we believe they are attributable to a single person, and counting such group ofaccounts as one person. As these techniques and models require significant judgment, are developed based on internal reviews of limited samples of user accounts, and are calibrated against user surveydata, there is necessarily some margin of error in our estimates. For additional information, see "Limitations of Key Metrics and Other Data" located in the Appendix of this presentation. In the secondquarter of 2020, we updated our Family metrics calculations to reflect recent data from a periodic WhatsApp user survey and to incorporate certain methodology improvements, and we estimate suchupdates contributed an aggregate of approximately 50 million MAP to our reported worldwide MAP in June 2020. In the first quarter of 2021, we updated our Family metrics calculations to maintaincalibration of our models against recent user survey data, and we estimate such update contributed an aggregate of approximately 70 million MAP to our reported worldwide MAP in March 2021.6
Family Average Revenue per Person (ARPP) 8.62 0.27 7.38 6.33 0.10 6.03 6.10 0.10 0.12 6.23 5.93 5.98 0.14 8.18 0.21 0.08 8.35 7.26 7.75 0.22 6.76 0.12 8.36 6.68 7.54 8.21 Q1'21Q2'21Q3'21We define average revenue per person (ARPP) as our total revenue during a given quarter, divided by the average of the number of MAP at the beginning and end of the quarter. While ARPPincludes all sources of revenue, the number of MAP used in this calculation only includes users of our Family products as described in the definition of MAP in the previous slide.7
RevenueIn Millions 28,072 885 26,171 29,077 29,010 497 734 28,580 28,276 732 21,470 21,082 17,652 346 17,737 297 269 18,687 249 366 27,187 20,736 17,440 17,383 18,321 25,439 20Q1'21Q2'21Q3'218
Revenue by Facebook User GeographyIn Millions 28,072 2,534 26,171 2,454 21,470 21,082 17,652 1,774 3,267 2,010 3,665 5,159 17,737 1,664 3,257 4,254 4,124 18,687 1,999 1,553 4,230 4,793 7,011 8,487 8,562 9,291 2,879 2,981 5,190 5,461 7,270 6,955 13,738 13,613 6,523 5,104 13,734 10,248 29,010 4,789 3,341 4,502 29,077 10,137 12,405Rest of WorldAsia-PacificEuropeUS & 1Revenue by Facebook user geography is geographically apportioned based on our estimation of the geographic location of our users when they perform a revenue-generating activity. Thisallocation differs from our revenue disaggregated by geography disclosure in our condensed consolidated financial statements where revenue is disaggregated by geography based on theaddresses of our customers.9
Advertising Revenue by Facebook User GeographyIn Millions 27,187 2,512 21,221 20,736 17,383 1,766 3,243 2,002 3,642 5,071 1,654 3,236 4,171 4,057 8,317 17,440 10,021 8,379 18,321 1,980 1,539 4,202 3,312 4,411 9,059 25,439 2,434 4,703 28,580 28,276 2,857 2,963 5,152 5,398 7,205 6,821 13,366 13,094 4,735 6,822 6,373 5,051 9,988 13,150 11,897Rest of WorldAsia-PacificEuropeUS & 1Revenue by Facebook user geography is geographically apportioned based on our estimation of the geographic location of our users when they perform a revenue-generating activity. Thisallocation differs from our revenue disaggregated by geography disclosure in our condensed consolidated financial statements where revenue is disaggregated by geography based on theaddresses of our customers.10
Other Revenue by Facebook User GeographyIn Millions 885 22 90 189 732 20 734 18 54 63 150 134 497 22 38 269 8 24 67 170 346 8 23 88 297 10 21 366 14 29 91 83 227 183 65 249 19 28 53 584 519 508Rest of World 372Asia-Pacific 232Europe 149US & 1Revenue by Facebook user geography is geographically apportioned based on our estimation of the geographic location of our users when they perform a revenue-generating activity. Thisallocation differs from our revenue disaggregated by geography disclosure in our condensed consolidated financial statements where revenue is disaggregated by geography based on theaddresses of our customers.11
Expenses as a Percentage of 2%18%19%6%7%11%11%20%21%12%22%General &AdministrativeMarketing& Sales18%17%20%20%20%19%20%19%20%Research &DevelopmentCost of 2112
Income from OperationsIn Millions 12,775 12,367 11,378 10,423 8,858 8,040 7,185Q3'19Q4'19 5,893 5,963Q1'20Q2'20Q3'20Q4'20Q1'21Q2'21Q3'2113
Operating '20Q3'20Q4'20Q1'21Q2'21Q3'2114
Effective Tax RateIn Millions, Except for PercentagesQ3’19Q4’19Q1’20Q2’20Q3’20 (1)Q4’20Q1’21Q2’21Q3’21 7,329 9,169 5,861 6,131 8,133 13,055 11,503 12,513 10,565Provision for income ive Tax Rate17%20%16%16%4%14%17%17%13%Income before provisionfor income taxes(1) Reflects a one-time income tax benefit of 913 million related to the effects of a tax election to capitalize and amortize certain research and development expenses for U.S. income tax purposes.Excluding this tax benefit, our effective tax rate would have been 11 percentage points higher in Q3 2020.15
Net IncomeIn Millions 11,219 10,394 9,497 9,194 7,846 7,349 6,091Q3'19Q4'19 4,902 ) Reflects a one-time income tax benefit of 913 million related to the effects of a tax election to capitalize and amortize certain research and development expenses for U.S. income tax purposes.16
Diluted Earnings Per Share 3.88 3.61 3.30 3.22 2.71 2.56 2.12Q3'19Q4'19 1.71 1.80Q1'20Q2'20Q3'20⁽¹⁾Q4'20Q1'21Q2'21Q3'21(1) Reflects a one-time income tax benefit of 913 million related to the effects of a tax election to capitalize and amortize certain research and development expenses for U.S. income tax purposes.Excluding this tax benefit, our diluted EPS would have been 0.31 lower.17
Capital ExpendituresIn Millions 13,703 10,900 4,544 3,878Q3'20Q3'21YTD 2020QuarterlyCapital expenditures for periods presented were related to purchases of property and equipment and principal payments on finance leases.YTD 2021YTD18
Appendix
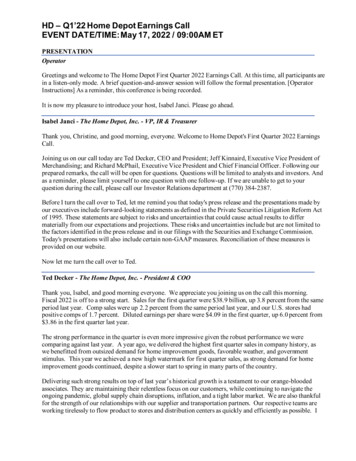
Free Cash Flow ReconciliationIn MillionsQ3’19Q4’19Q1’20Q2’20 (1)Q3’20Q4’20Q1’21Q2’21Q3’21Net cash provided by operatingactivities 9,307 9,083 11,001 3,878 9,828 14,040 12,242 13,246 14,091Less: Purchases of property andequipment, 4141100109189205151123231 5,631 4,842 7,343 514 5,950 9,222 7,819 8,511 9,547Less: Principal paymentson finance leasesFree cash flowFree cash flow (FCF) is a non-GAAP financial measure that has limitations as an analytical tool, and you should not consider it in isolation or as a substitute for analysis of other GAAP financialmeasures, such as net cash provided by operating activities. Some of the limitations of FCF are: (i) FCF does not reflect our future contractual commitments, and (ii) other companies in our industrypresent similarly titled measures differently than we do, limiting their usefulness as comparative measures. FCF is not intended to represent our residual cash flow available for discretionaryexpenditures.(1) Reflects the 5.0 billion FTC settlement that was paid in the second quarter of 2020.20
Limitations of Key Metrics and Other DataThe numbers for our key metrics are calculated using internal company data based on the activity of user accounts. We have historically reported the numbers of our daily active users (DAUs), monthlyactive users (MAUs), and average revenue per user (ARPU) (collectively, our "Facebook metrics") based on user activity only on Facebook and Messenger and not on our other products. Beginning withour fourth quarter 2019 earnings presentation, we also report our estimates of the numbers of our daily active people (DAP), monthly active people (MAP), and average revenue per person (ARPP)(collectively, our "Family metrics") based on the activity of users who visited at least one of Facebook, Instagram, Messenger, and WhatsApp (collectively, our "Family" of products) during theapplicable period of measurement. We believe our Family metrics better reflect the size of our community and the fact that many people are using more than one of our products. As a result, overtime we intend to report our Family metrics as key metrics in place of DAUs, MAUs, and ARPU.While these numbers are based on what we believe to be reasonable estimates of our user base for the applicable period of measurement, there are inherent challenges in measuring usage of ourproducts across large online and mobile populations around the world. The methodologies used to measure these metrics require significant judgment and are also susceptible to algorithm or othertechnical errors. In addition, we are continually seeking to improve our estimates of our user base, and such estimates may change due to improvements or changes in our methodology. We regularlyreview our processes for calculating these metrics, and from time to time we discover inaccuracies in our metrics or make adjustments to improve their accuracy, which can result in adjustments to ourhistorical metrics. Our ability to recalculate our historical metrics may be impacted by data limitations or other factors that require us to apply different methodologies for such adjustments. Wegenerally do not intend to update previously disclosed Family metrics for any such inaccuracies or adjustments that are within the error margins disclosed below.In addition, our Facebook metrics and Family metrics estimates will differ from estimates published by third parties due to differences in methodology.Facebook MetricsWe regularly evaluate our Facebook metrics to estimate the number of "duplicate" and "false" accounts among our MAUs. A duplicate account is one that a user maintains in addition to his or herprincipal account. We divide "false" accounts into two categories: (1) user-misclassified accounts, where users have created personal profiles for a business, organization, or non-human entity such asa pet (such entities are permitted on Facebook using a Page rather than a personal profile under our terms of service); and (2) violating accounts, which represent user profiles that we believe areintended to be used for purposes that violate our terms of service, such as bots and spam. The estimates of duplicate and false accounts are based on an internal review of a limited sample ofaccounts, and we apply significant judgment in making this determination. For example, to identify duplicate accounts we use data signals such as identical IP addresses and similar user names, and toidentify false accounts we look for names that appear to be fake or other behavior that appears inauthentic to the reviewers. Any loss of access to data signals we use in this process, whether as aresult of our own product decisions, actions by third-party browser or mobile platforms, regulatory or legislative requirements, limitations while our personnel work remotely during the COVID-19pandemic, or other factors, also may impact the stability or accuracy of our estimates of duplicate and false accounts. Our estimates also may change as our methodologies evolve, including throughthe application of new data signals or technologies or product changes that may allow us to identify previously undetected duplicate or false accounts and may improve our ability to evaluate abroader population of our users. Duplicate and false accounts are very difficult to measure at our scale, and it is possible that the actual number of duplicate and false accounts may vary significantlyfrom our estimates.In the fourth quarter of 2020, we estimated that duplicate accounts may have represented approximately 11% of our worldwide MAUs. We believe the percentage of duplicate accounts ismeaningfully higher in developing markets such as the Philippines and Vietnam, as compared to more developed markets. In the fourth quarter of 2020, we estimated that false accounts may haverepresented approximately 5% of our worldwide MAUs. Our estimation of false accounts can vary as a result of episodic spikes in the creation of such accounts, which we have seen originate morefrequently in specific countries such as Indonesia and Vietnam. From time to time, we disable certain user accounts, make product changes, or take other actions to reduce the number of duplicate orfalse accounts among our users, which may also reduce our DAU and MAU estimates in a particular period. We intend to disclose our estimates of the number of duplicate and false accounts amongour MAUs on an annual basis.The numbers of DAUs and MAUs discussed in this presentation, as well as ARPU, do not include users on Instagram, WhatsApp, or our other products, unless they would otherwise qualify as DAUs orMAUs, respectively, based on their other activities on Facebook.21
Limitations of Key Metrics and Other DataFamily MetricsMany people in our community have user accounts on more than one of our products, and some people have multiple user accounts within an individual product. Accordingly, for our Family metrics,we do not seek to count the total number of user accounts across our products because we believe that would not reflect the actual size of our community. Rather, our Family metrics represent ourestimates of the number of unique people using at least one of Facebook, Instagram, Messenger, and WhatsApp. We do not require people to use a common identifier or link their accounts to usemultiple products in our Family, and therefore must seek to attribute multiple user accounts within and across products to individual people. To calculate these metrics, we rely upon complextechniques, algorithms and machine learning models that seek to count the individual people behind user accounts, including by matching multiple user accounts within an individual product andacross multiple products when we believe they are attributable to a single person, and counting such group of accounts as one person. These techniques and models require significant judgment, aresubject to data and other limitations discussed below, and inherently are subject to statistical variances and uncertainties. We estimate the potential error in our Family metrics primarily based on usersurvey data, which itself is subject to error as well. While we expect the error margin for our Family metrics to vary from period to period, we estimate that such margin generally will be approximately4% of our worldwide MAP. At our scale, it is very difficult to attribute multiple user accounts within and across products to individual people, and it is possible that the actual numbers of unique peopleusing our products may vary significantly from our estimates, potentially beyond our estimated error margins. As a result, it is also possible that our Family metrics may indicate changes or trends inuser numbers that do not match actual changes or trends.To calculate our estimates of Family DAP and MAP, we currently use a series of machine learning models that are developed based on internal reviews of limited samples of user accounts andcalibrated against user survey data. We apply significant judgment in designing these models and calculating these estimates. For example, to match user accounts within individual products andacross multiple products, we use data signals such as similar device information, IP addresses, and user names. We also calibrate our models against data from periodic user surveys of varying sizesand frequency across our products, which are inherently subject to error. The timing and results of such user surveys have in the past contributed, and may in the future contribute, to changes in ourreported Family metrics from period to period. In addition, our data limitations may affect our understanding of certain details of our business and increase the risk of error for our Family metricsestimates. Our techniques and models rely on a variety of data signals from different products, and we rely on more limited data signals for some products compared to others. For example, as a resultof limited visibility into encrypted products, we have fewer data signals from WhatsApp user accounts and primarily rely on phone numbers and device information to match WhatsApp user accountswith accounts on our other products. Similarly, although Messenger Kids users are included in our Family metrics, we do not seek to match their accounts with accounts on our other applications forpurposes of calculating DAP and MAP. Any loss of access to data signals we use in our process for calculating Family metrics, whether as a result of our own product decisions, actions by third-partybrowser or mobile platforms, regulatory or legislative requirements, limitations while our personnel work remotely during the COVID-19 pandemic, or other factors, also may impact the stability oraccuracy of our reported Family metrics, as well as our ability to report these metrics at all. Our estimates of Family metrics also may change as our methodologies evolve, including through theapplication of new data signals or technologies, product changes, or other improvements in our user surveys, algorithms, or machine learning that may improve our ability to match accounts withinand across our products or otherwise evaluate the broad population of our users. In addition, such evolution may allow us to identify previously undetected violating accounts (as defined below).We regularly evaluate our Family metrics to estimate the percentage of our MAP consisting solely of "violating" accounts. We define "violating" accounts as accounts which we believe are intended tobe used for purposes that violate our terms of service, including bots and spam. In the fourth quarter of 2020, we estimated that approximately 3% of our worldwide MAP consisted solely of violatingaccounts. Such estimation is based on an internal review of a limited sample of accounts, and we apply significant judgment in making this determination. For example, we look for accountinformation and behaviors associated with Facebook and Instagram accounts that appear to be inauthentic to the reviewers, but we have limited visibility into WhatsApp user activity due toencryption. In addition, if we believe an individual person has one or more violating accounts, we do not include such person in our violating accounts estimation as long as we believe they have oneaccount that does not constitute a violating account. From time to time, we disable certain user accounts, make product changes, or take other actions to reduce the number of violating accountsamong our users, which may also reduce our DAP and MAP estimates in a particular period. We intend to disclose our estimates of the percentage of our MAP consisting solely of violating accounts onan annual basis. Violating accounts are very difficult to measure at our scale, and it is possible that the actual number of violating accounts may vary significantly from our estimates.The numbers of Family DAP and MAP discussed in this presentation, as well as ARPP, do not include users on our other products, unless they would otherwise qualify as DAP or MAP, respectively,based on their other activities on our Family products.22
Limitations of Key Metrics and Other DataUser GeographyOur data regarding the geographic location of our users is estimated based on a number of factors, such as the user’s IP address and self-disclosed location. These factors may not always accuratelyreflect the user’s actual location. For example, a user may appear to be accessing Facebook from the location of the proxy server that the user connects to rather than from the user’s actual location.The methodologies used to measure our metrics are also susceptible to algorithm or other technical errors, and our estimates for revenue by user location and revenue by user device are also affectedby these factors.23
FB Earnings Presentation Q3 2021investor.fb.com
our fourth quarter 2019 earnings presentation, we also report our estimates of the numbers of our daily active people (DAP), monthly active people (MAP), and average revenue per person (ARPP)