Transcription
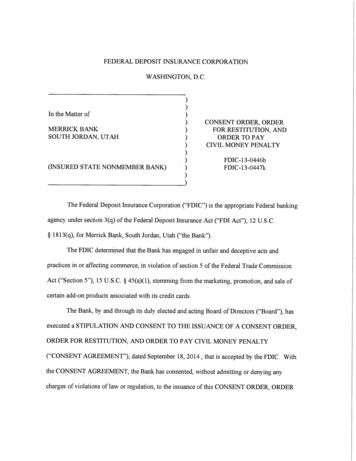
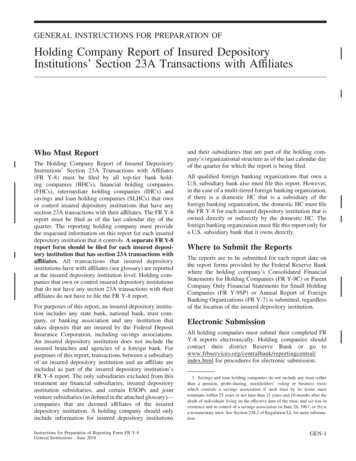
Quarterly Banking ProfileThird Quarter 2012INSURED INSTITUTION PERFORMANCENet Income of 37.6 Billion Is Highest in Six Years Higher Revenues, Lower Loss Provisions Combine to Boost Earnings Loan Balances Increase for Fifth Time in Last Six Quarters Twelve Failures Are Fewest Since Fourth Quarter 2008 Quarterly Profits Continue to ImproveRevenue Growth Picks UpReduced expenses for loan losses and risingnon interest income helped lift insured institutions’earnings to 37.6 billion in third quarter 2012. Thisquarterly net income represents a 2.3 billion (6.6percent) improvement over third quarter 2011, and isthe highest quarterly total reported by the industrysince third quarter 2006. The average return on assets(ROA) rose to 1.06 percent, from 1.03 percent a yearearlier. More than half of all institutions (57.5percent) reported higher earnings than a year ago, andonly 10.5 percent reported negative net income forthe quarter. This is the lowest proportion of unprofitable institutions in more than five years (since secondquarter 2007).Net operating revenue (net interest income plus totalnoninterest income) increased by 4.9 billion (3percent), the largest year-over-year increase in quarterlyrevenue in almost three years (since fourth quarter2009). The greatest contribution to the year-over-yearimprovement in quarterly revenue came from noninterest income, which was 4.2 billion (7 percent) higherthan in third quarter 2011. Gains on asset sales were 5billion above the level of a year ago. Almost half of allinstitutions (47.8 percent) reported year-over-yearimprovement in income from asset sales. Gains on salesof loans were 3.9 billion (227.5 percent) above thelevel of a year earlier. Losses on sales of other real estateowned were 932 million (81.8 percent) less than ayear ago. Sales of other assets yielded 186 million morein income. Trading revenue was 3.3 billion (38.9percent) lower, reflecting a 3 billion year-over-yeardecline in income from trading credit derivatives.Chart 1Chart 2Most Banks Are Improving Their Earnings,While Fewer Are UnprofitableQuarterly Net Income, 2008–2012Billions of Dollars 50 40Securities and Other Gains/Losses, NetNet Operating Income 30 20 1019.317.44.8 0.920.923.835.228.7 28.521.434.8 34.4Percentage of All Insured Institutions8037.67025.460502.1 0- 1040-1.7-6.130-12.6- 2020- 30- 40- 50Percentage of Institutions withYear-Over-Year Quarterly Income Growth10-37.801 2 3 4 1 2 3 4 1 2 3 4 1 2 3 4 1 2 320082011200920122010FDIC Quarterly1 Percentage of Institutions with Quarterly Losses1 2 3 4 1 2 3 4 1 2 3 4 1 2 3 4 1 2 3 4 1 2 3 4 1 2 320062007200820092010201120122012, Volume 6, No. 4
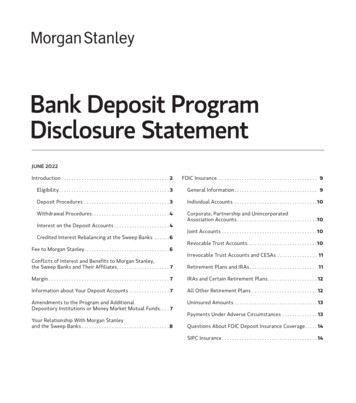
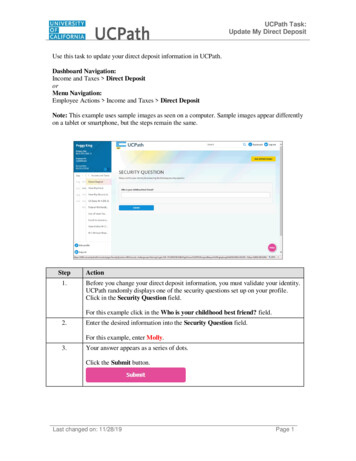
declined in all major loan categories except 1-4 familyresidential real estate loans, where NCOs were 1.3billion (15.5 percent) higher than a year earlier. Thisincrease was the result of new accounting and reportingguidelines applicable to national banks and federalsavings associations concerning the reporting of restructured loans.1Growth in Earning Assets Offsets Narrower MarginsNet interest income was 746 million (0.7 percent)higher than a year ago, even though the average netinterest margin (NIM) fell from 3.56 percent to 3.43percent. The increase in net interest income was madepossible by a 4.6 percent increase in interest-earningassets. Two out of every three insured institutions (67.8percent) reported year-over-year NIM declines, as average asset yields declined faster than average fundingcosts.Noncurrent Loan Balances Are Almost UnchangedThe amount of loans and leases that were noncurrent(90 days or more past due or in nonaccrual status)declined by only 100 million (0.03 percent) during thethird quarter. This marks the tenth consecutive quarterthat noncurrent loan balances have declined, but it isthe smallest decline registered during that time.Noncurrent real estate construction loan balances fellby 3.4 billion (14.6 percent) during the quarter,noncurrent real estate loans secured by nonfarmnon residential properties declined by 1.8 billion (5.2percent), and noncurrent loans to commercial andindustrial (C&I) borrowers fell by 1.4 billion (9.1percent). The same accounting guidance that producedthe increase in 1-4 family residential real estate loanNCOs also contributed to a 6.9 billion (3.6 percent)rise in reported noncurrent 1-4 family residential realestate loans.Expenses for Bad Loans Fall AgainProvisions for loan losses declined year over year for a12th consecutive quarter, falling by 3.8 billion (20.6percent). Banks set aside 14.8 billion in the thirdquarter, down from 18.6 billion in third quarter 2011.Slightly more than half of all institutions (50.4 percent)reduced their provisions from year-earlier levels. Lossprovisions represented 8.7 percent of net operatingrevenue, compared with 11.3 percent in third quarter2011.Loan Losses Decline Across Most Loan CategoriesFor the ninth quarter in a row, net charge-offs (NCOs)were lower than a year earlier. Banks charged off 22.3billion (net) during the quarter, 4.4 billion (16.5percent) less than in third quarter 2011. The largestNCO declines occurred in credit cards (down 2.8billion, or 30.4 percent), and in real estate constructionloans (down 1.4 billion, or 61 percent). Charge-offsSee Topic 2A., “Troubled Debt Restructurings,” in OCC’s BankAccounting Advisory Series, June 2012; t 3Chart 4Indicators of Asset Quality Continue to ImproveQuarterly Revenue and Loan-Loss Provision, 2008-2012Billions of Dollars 180Billions of Dollars 120Quarterly Loan-Loss Provision 160 100 140 80 120 60Quarterly Net Operating Revenue* 100 80 40 60 20 40 0 20 0Quarterly Change in Noncurrent LoansQuarterly Net Charge-Offs- 201 2 3 4 1 2 3 4 1 2 3 4 1 2 3 4 1 2 320082009201020112012- 40*Net operating revenue net interest income noninterest incomeFDIC Quarterly2 1 2 3 4 1 2 3 4 1 2 3 4 1 2 3 4 1 2 3 4 1 2 32010200820092011201220072012, Volume 6, No. 4
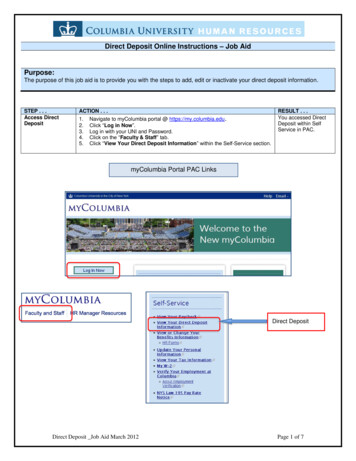
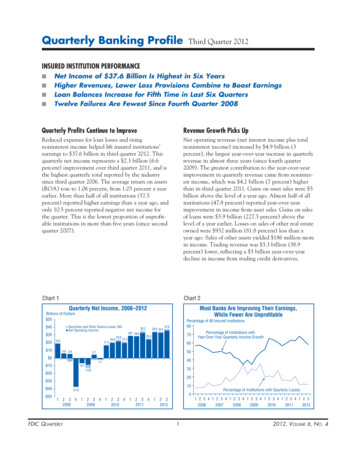
Quarterly Banking Profileter 2011. Banks declared 20.4 billion in dividends inthe third quarter, an increase of 594 million (3percent) over third quarter 2011. A 38.3 percentincrease in unrealized gains on available-for-sale securities added 12.5 billion to equity during the quarter.Large Banks Reduce Their Reserves FurtherInsured institutions reduced their reserves for loan lossesby 9.6 billion (5.4 percent) during the quarter, as netcharge-offs of 22.3 billion exceeded loss provisions of 14.8 billion. This is the tenth consecutive quarter thatthe industry’s reserves have declined. Much of the totalreduction in reserves was concentrated among largerinstitutions. The ten largest banks together reducedtheir reserves by 7.3 billion (8.1 percent) during thequarter. Overall, a majority of institutions (53.5percent) added to their reserves during the quarter. Thecombination of sizable reserve reductions with smallerreductions in noncurrent loan balances meant that theindustry’s “coverage ratio” of reserves to noncurrentloans declined from 60.4 percent to 57.2 percent duringthe quarter. More than half of all institutions (53.4percent) increased their coverage ratios, but theirincreases were outweighed by larger declines at many ofthe biggest banks.Loan Balances Rise for Second Consecutive QuarterTotal assets increased by 192.1 billion (1.4 percent)between June 30 and September 30, with loan balancesrising for the fifth time in the last six quarters. Totalloans and leases increased by 64.8 billion (0.9percent), as C&I loans rose by 31.8 billion (2.2percent). Residential mortgage loans increased by 14.5billion (0.8 percent). Loans to individuals increased by 13.1 billion (1 percent), led by auto loans (up 7.4billion, or 2.4 percent). The largest net declines in loanbalances occurred in home equity lines of credit (down 12.9 billion, or 2.2 percent) and in real estateconstruction and development loans (down 6.9billion, or 3.2 percent). This is the 18th consecutivequarter in which construction loan balances havefallen. At the end of the quarter, they were 421.4billion (66.7 percent) below the peak level of 631.8billion at the end of first quarter 2008. Insured institutions’ securities holdings rose by 49.1 billion duringthe quarter, while Fed funds sold and reverse reposincreased by 39 billion (8.3 percent). Assets in tradingaccounts increased by 30.6 billion (4.4 percent).Equity Capital Receives a Boost From HigherRetained EarningsHigher retained earnings combined with improvedvalues in securities portfolios helped lift the industry’sequity capital by 30.5 billion (1.9 percent) in the thirdquarter. This is the largest quarterly increase in equitycapital in three years. Retained earnings totaled 17.2billion, the highest quarterly total in six years, and anincrease of 1.7 billion (11.3 percent) from third quar-Chart 5Chart 6Quarterly Change in Loan Balances, 2007–2012The 12-Month Loan Growth Rate Has Been Positivefor the Last Four QuartersBillions of DollarsPercent40 300237 250189 200221*203 100 5043 0- 5010267612820651024-60-7 -14-63- 100-116- 150- 200- 25030134 150-140-109-133-107-10-126-20-210-301 2 3 4 1 2 3 4 1 2 3 4 1 2 3 4 1 2 3 4 1 2 3201020122007200920112008-40* FASB Statements 166 and 167 resulted in the consolidation of large amounts of securitizedloan balances back onto banks' balance sheets in the first quarter of 2010. Although the totalamount consolidated cannot be precisely quantified, the industry would have reported a declinein loan balances for the quarter absent this change in accounting standards.FDIC QuarterlyFAS 166/167 *Secured by 1-4 Family Residential PropertiesConstruction & DevelopmentNonfarm Nonresidential Real EstateC&I LoansLoans to IndividualsTotal Loans & Leases2000 2001 2002 2003 2004 2005 2006 2007 2008 2009 2010 2011 2012* FASB Statements 166 and 167 resulted in the consolidation of large amounts ofsecuritized loan balances back onto banks’ balance sheets in the first quarter of 2010.Most of these balances consisted of credit card loans.3 2012, Volume 6, No. 4
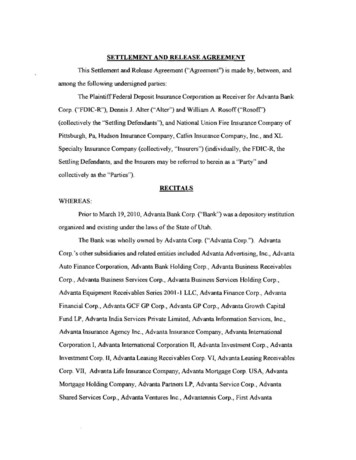
Deposits Post Strong GrowthFailures Fall to Lowest Level Since the End of 2008Most of the increase in assets was funded by depositgrowth, as total deposits increased by 181.7 billion(1.8 percent). Deposits in foreign offices rose by 35.2billion (2.5 percent), while domestic office depositsincreased by 146.5 billion (1.6 percent). More thanthree-quarters of the increase in domestic deposits( 110.9 billion) consisted of balances in noninterestbearing transaction deposits that exceeded the basicFDIC coverage limit of 250,000 but have temporaryfull FDIC insurance coverage until the end of 2012.Nondeposit liabilities declined by 20.2 billion (1percent). At the end of September, deposits funded73.9 percent of banking industry assets, the highestproportion since the end of 1993.The number of insured institutions reporting financialresults declined from 7,245 to 7,181 in the quarter.Mergers absorbed 49 insured institutions, and 12 institutions failed. This is the smallest number of failures ina quarter since fourth quarter 2008. For a fifth consecutive quarter, no new charters were added. The last timea start-up bank opened was in fourth quarter 2010. Thenumber of institutions on the FDIC’s “Problem List” fellfrom 732 to 694, while assets of “problem” banksdeclined from 282.4 billion to 262.2 billion. This isthe smallest number of “problem” institutions sincethird quarter 2009. The number of full-time equivalentemployees at insured financial institutions declined by2,352 (0.1 percent) from the previous quarter.Author:Chart 7Chart 8Much of the Recent Deposit Growth Has Consisted ofLarge Noninterest-Bearing Transaction Accounts 234.6 250 179.6 150 163.2 186.0Quarterly Failures150Net Quarterly Change inNumber of Problem Banks 61.525 00- 50- 100Balances Temporarily Covered byFull Insurance-25All Other Deposits-50Q1 2011 Q2 2011 Q3 2011 Q4 2011 Q1 2012 Q2 2012 Q3 2012FDIC Quarterly4 45411221950 50502410075 100- 150175125 181.7 74.7Quarterly Changes in the Number ofTroubled Institutions, 2007–2012200Quarterly Change (Billions of Dollars) 300 200Ross Waldrop, Senior Banking AnalystDivision of Insurance and Research(202) 898-395121335420 1 1278 4 11 148153111136451504173543031 24 26 22 2618 16 15 124-23 -21 -31-41 -40 -381 2 3 4 1 2 3 4 1 2 3 4 1 2 3 4 1 2 3 4 1 2 32007200820092010201120122012, Volume 6, No. 4
Quarterly Banking ProfileTABLE I-A. Selected Indicators, All FDIC-Insured Institutions*Return on assets (%) Return on equity (%) Core capital (leverage) ratio (%) Noncurrent assets plus other real estate owned to assets (%) Net charge-offs to loans (%) Asset growth rate (%) Net interest margin (%) Net operating income growth (%) Number of institutions reporting Commercial banks Savings institutions Percentage of unprofitable institutions (%) Number of problem institutions Assets of problem institutions (in billions) Number of failed institutions Number of assisted institutions ,01310.68694 6,3521,08515.85844 2911,06616.16813 6,5301,12822.11884 ,0126,8401,17230.84702 7,0871,21824.89252 ,2841,25012.1076 2230* Excludes insured branches of foreign banks (IBAs).** Through September 30, ratios annualized where appropriate. Asset growth rates are for 12 months ending September 30.TABLE II-A. Aggregate Condition and Income Data, All FDIC-Insured Institutions3rd Quarter20127,1812,105,8332nd Quarter20127,2452,108,1853rd Quarter20117,4372,109,352%Change11Q3-12Q3-3.4-0.2 612166,9727,410,6402,986,46541,044364,1703,420,622 860176,5717,336,2892,937,40841,761366,7413,348,659 43.77.1-18.7-2.3-1.1Total liabilities and capital Deposits Domestic office deposits Foreign office deposits Other borrowed funds Subordinated debt All other liabilities Total equity capital (includes minority interests) Bank equity capital -8.4-17.9-0.63.83.8Loans and leases 30-89 days past due Noncurrent loans and leases Restructured loans and leases Mortgage-backed securities Earning assets FHLB Advances Unused loan commitments Trust assets Assets securitized and sold*** Notional amount of derivatives*** -13.1-7.1-17.78.34.6-1.60.312.92.6-8.5(dollar figures in millions)Number of institutions reporting Total employees (full-time equivalent) CONDITION DATATotal assets Loans secured by real estate 1-4 Family residential mortgages Nonfarm nonresidential Construction and developmentHome equity lines Commercial & industrial loans Loans to individuals Credit cards Farm loans Other loans & leases Less: Unearned income Total loans & leases Less: Reserve for losses Net loans and leases Securities Other real estate owned Goodwill and other intangibles All other assets INCOME DATATotal interest income Total interest expense Net interest income Provision for loan and lease losses Total noninterest income Total noninterest expense Securities gains (losses) Applicable income taxes Extraordinary gains, net Total net income (includes minority interests) Bank net income Net charge-offs Cash dividends Retained earnings Net operating income First ThreeQuarters 2012 4-54107,366106,85364,40460,84346,010102,177First ThreeQuarters 2011 .113.63rd Quarter2012 -4437,72237,58922,33020,42117,16835,7083rd Quarter2011 52835,47135,24626,74119,82715,41932,653*** Prior to 2012, does not include data for insured savings institutions that file Thrift Financial Reports. Beginning in 2012, all insured institutions file Call Reports. FDIC Quarterly5 M6.36.7-16.53.011.39.4N/M - Not Meaningful2012, Volume 6, No. 4
TABLE III-A. Third Quarter 2012, All FDIC-Insured InstitutionsAsset Concentration Groups*THIRD QUARTERAll Insured(The way it is.)InstitutionsNumber of institutions reporting 7,181Commercial banks 6,168Savings institutions 1,013Total assets (in billions) 14,222.9Commercial banks 13,069.9Savings institutions 1,153.1Total deposits (in billions) 10,504.2Commercial banks 9,622.4Savings institutions 881.9Bank net income (in millions) 37,589Commercial banks 34,715Savings institutions 2,874CreditCardInternational Agricultural 5173,2343021343 580.0 3,774.2 223.9 5708Mortgage ConsumerLendersLenders706532174048913 821.8 1,531480852261679219OtherSpecializedAll Other 1 Billion 1 Billion39781836371734101 63.4 731793064667All Other 1 Billion70619 1Performance Ratios (annualized, %)Yield on earning assets Cost of funding earning assets Net interest margin Noninterest income to assets Noninterest expense to assets Loan and lease loss provision to assets Net operating income to assets Pretax return on assets Return on assets Return on equity Net charge-offs to loans and leases Loan and lease loss provision tonet charge-offs Efficiency ratio % of unprofitable institutions % of institutions with earnings gains l ChangesNew reporters Institutions absorbed by mergers Failed institutions 049120000000610349042000010020020PRIOR THIRD QUARTERS(The way it was.)Return on assets (%) 2011 2009 201.060.741.070.990.630.81Net charge-offs to loans & leases (%) 2011 2009 20.540.570.221.272.630.42* See Table V-A (page 10) for explanations.Note: Blue font identifies data that are also presented in the prior quarters data at bottom of table.FDIC Quarterly6 2012, Volume 6, No. 4
Quarterly Banking ProfileTABLE III-A. Third Quarter 2012, All FDIC-Insured InstitutionsAsset Size DistributionTHIRD QUARTERAll Insured(The way it is.)InstitutionsNumber of institutions reporting 7,181Commercial banks 6,168Savings institutions 1,013Total assets (in billions) 14,222.9Commercial banks 13,069.9Savings institutions 1,153.1Total deposits (in billions) 10,504.2Commercial banks 9,622.4Savings institutions 881.9Bank net income (in millions) 37,589Commercial banks 34,715Savings institutions 2,874Geographic Regions*Less than 100 1 BillionGreater 100Million totothanMillion 1 Billion 10 Billion 10 Billion New 19416 132.4 1,278.3 1,424.4 11,387.8 43635451,942789Atlanta91882395 icago1,5291,270259 KansasCity1,7381,65385 nDallasFrancisco1,5135921,40953810454 845.9 .8163.62,4265,0552,0623,7383651,316Performance Ratios (annualized, %)Yield on earning assets Cost of funding earning assets Net interest margin Noninterest income to assets Noninterest expense to assets Loan and lease loss provision to assets Net operating income to assets Pretax return on assets Return on assets Return on equity Net charge-offs to loans and leases Loan and lease loss provision tonet charge-offs Efficiency ratio % of unprofitable institutions % of institutions with earnings gains 090.40
earnings to 37.6 billion in third quarter 2012. This quarterly net income represents a 2.3 billion (6.6 percent) improvement over third quarter 2011, and is the highest quarterly total reported by the industry since third quarter 2006. The average return on assets (ROA) rose to 1.06 percent, from 1.03 percent a year earlier.