Transcription
See discussions, stats, and author profiles for this publication at: evelopment of portable biofeedback devicesfor sport applicationsCONFERENCE PAPER · APRIL 2015READS352 AUTHORS:Tan CHOON MongZulkifli AhmadUniversiti Malaysia PahangUniversiti Malaysia Pahang2 PUBLICATIONS 0 CITATIONS16 PUBLICATIONS 5 CITATIONSSEE PROFILEAll in-text references underlined in blue are linked to publications on ResearchGate,letting you access and read them immediately.SEE PROFILEAvailable from: Zulkifli AhmadRetrieved on: 09 November 2015
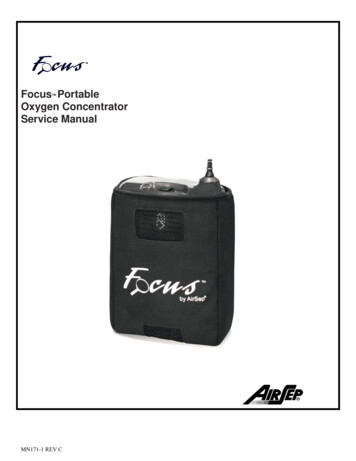
Development of portable biofeedback devicesfor sport applicationsTan Choon Mong, and Zulkifli Ahmad*Human Engineering Group,Faculty of Mechanical Engineering, Universiti Malaysia Pahang26600, Pekan, Pahang, MalaysiaCorrespondent Author: kifli@ump.edu.myAbstract—The purpose of this project is to propose a portablelow cost of ECG and EMG devices that plays the role ofcontinuous monitoring of the user heart rate and muscle eElectrocardiography (ECG) and Electromyography (EMG) areimportant in the field of healthcare and sports which enable toassess the physiological state and training progress of athlete.Heart rate can reflect individual natural fitness whereas theEMG signal indicates muscle activation and fatigue level thusdetermine the performance. However, most of the EMG andheart rate measuring tools are expensive and large in size. Theprocess of data collection also often confined to hospital orbiomechanics lab. Therefore, the development of this monitoringsystem capable provides immediate feedback about physiologicaldata which is desired by athletes and trainers. The monitoringsystem is knitted with a pulse sensor and muscle sensor V3.Arduino Uno was act as microcontroller to analyze the collectedsignal then transmits the data via Bluetooth to Android basedsmartphone; Laptop through Processing software; or LCDscreen. The significant of using Processing software is allowdisplay the data in graphical way. The pulse sensor is applyingphotoplethsmography (PPG) technique to measure the heart ratein beats per minute (bpm). In other hand, the EMG signal will becollected by passive electrode which allows the monitoring of usermuscle stress. Throughout the ECG experiment, the pulse sensorresult collected via Coolterm application was compared to radialpulse and Treadmill. The result showed that the error rate of thedevice is negligible and promising. While the EMG dataproduced by muscle sensor is achieving a full wave rectifiedwaveform that demonstrates the forearm strength romyography(EMG); Microcontroller; athlete.I.INTRODUCTIONBasically, Electrocardiography (ECG) and SurfaceElectromyography (EMG) are non-invasive technique andmonitoring tools for the detection and measurement ofheartbeat and EMG signal. Biosignals of ECG and EMG notonly play an important role in patient health monitoring butalso assess the physiological state of athlete in trainingprogress.ECG is used to evaluate the cardiac abnormalities anddetect how fast your heart is beating [1] whereas EMG is usedto analyze the muscle activity by recording the electricalactivity produced by skeletal muscle during muscle contractionand relaxation cycle [2]. In modern live, both techniques haveincreasing important in sports for biomechanical analysis. Thedata heart rate capable provide good indicators of exerciseintensity and fitness respectively by inform athlete about hishealthy and effective exercise behavior [3].Surface EMG canhelp to understand the muscle activation in specific movementwhich may lead to healthy training by improve the utilizationof muscle and prevent risk of injury [2].The conventional ECG and EMG tools were expensive andbulky. Therefore, the experiment was confined in hospital orbiomechanical lab. Beside this, both measurement methodswere using conductive electrodes which directly attached to theskin with help of gel. These kind of method was not reusableand troublesome where not optimal for long term used as aresult of surface degradation of the electrode and require thecleaning of target muscle [4].Such situation has lead to certain needs for lower cost , userfriendly and portable heart rate and muscle activity detector inorder to achieve the purpose of continuously monitoring theathlete physiological information [5]. In the sport domain, thereis a trend to personal monitoring. Thus, there is a growing needfor solution to record and analyze the biosignal on mobiledevices. Hence, with the help of Bluetooth module, the datacollected were capable transmit to Android base smartphonefor further analyzing.II.DEVICE DEVELOPMENTFig. 1 shows an overview of the device system monitoring.This project is proposed to develop a system by using ArduinoUno as microcontroller to perform analog to digital (A/D)process. It compatible for both pulse and muscle sensors todetect and measure the heartbeat and muscle activityrespectively.A. Electrocardiography (ECG)For ECG system application, the pulse sensor was chosenwhich applied the photoplethysmography (PPG) technology tomeasure the heartbeat. Basically , PPG tools is an inexpensiveand less power consume optical technique which measure theblood volume change in the vascular tissue [6]. The PPG ispreferred in the portable design due to small size and withoutprecise positioning the sensor on subject body compared withconventional ECG. Pulse sensor is reflectance mode where the
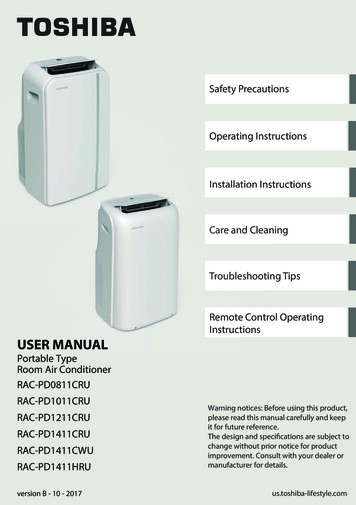
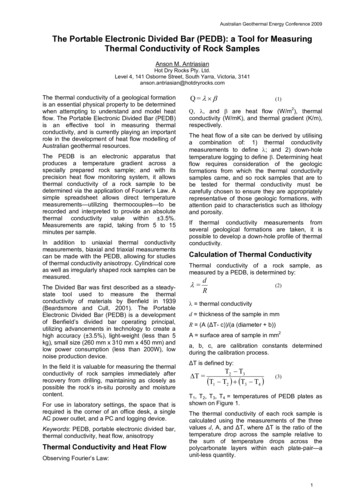
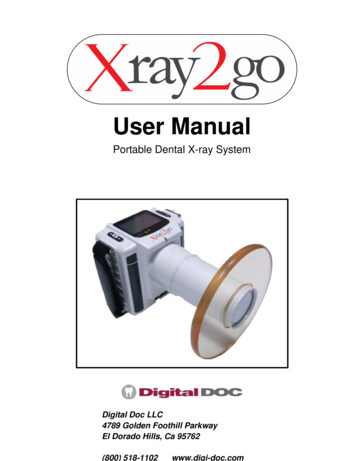
photo-detector sensor and LED placing on the same side oftissue. The pulse sensor work by green light shining into veinsand a light source measure the reflected light and convert intoan analog voltage. The pulse sensor can attach on finger orearlobe.both the digital value of pulse sensor and muscle sensor data asshown in Fig. 2. Next, Processing is an open sourceprogramming language which serves as visual context by graphthe data from the microcontroller as shown in Fig. 3. Lastly,Bluetooth module is attached which act as bridge between themicrocontroller and Android based smartphone. The data frommicrocontroller will transmit to phone wirelessly by Bluetoothmodule and display through Blueterm as shown in Fig. 4.Fig. 2. LCD screen display heart rate and EMG.Fig. 1. An overview of the device system.B. Electromyography (EMG)In contrast, muscle sensor was applied as EMG system. Themuscle sensor include surface electrode which attach on targetmuscle will collect the raw EMG signal to muscle sensorcircuit. The electrode measures the voltage difference whichgenerate by muscle activation. The muscle sensor thenamplifies, filtered and rectified the raw signal from humanmuscle and send to Arduino Uno. In the application of musclesensor, the strength of muscle contraction is correspond to theamount of voltage output which mean the voltage output isdepending on the amount of activation in the targeted muscle.There are three platforms to display the collected data.Firstly, it can be display in Personal Computer (PC) viaProcessing programming interface. Second, with help ofBluetooth module, the data can send to Android based smartphone wirelessly via Blueterm apps. Lastly, the data also candisplay in LCD directly after connect with the Arduino Uno.The systems have considerable portability due to lowweight and small size of component. Furthermore, the ArduinoUno is chosen as microcontroller due to it is a compact sizedevice that has capability of high speed analog to digitalconversion as well as low cost. For wireless technology ofcommunication, the Bluetooth module was use in transmissionof heartbeat and muscle activity data due to its low cost andsmall size. Meanwhile the Processing software was used todisplaying the data from Arduino serial monitor in graphicalway. There are about five main components in the developmentof system. The most expensive part is muscle sensor of thecurrent device. However, this device is still low cost comparedto the traditional ECG and EMG device from clinic or hospitalwhose are too expensive and cannot to be as portable.III.EXPERIMENTAL DATAAfter set up the connection of pulse sensor and musclesensor to Arduino Uno, it then needs to create a platform todisplay the collected signal. The data which display by LCDscreen is same with serial monitor of Arduino board. It displaysFig. 3. Displaying heart rate (left) and muscle activation (right) viaProcessing programming interface.Fig. 4. Displaying ECG data on Android phone via Blueterm App.A. ECG validation processThe pulse sensor can either attach in finger or earlobe toperform the measurement. Moreover, the pulse sensor does notrequire skin preparation as it is placed directly in contact withthe skin. According to [6] stated that PPG are often attach toear or fingertip which are single site measurement where thepulse can easily be detected. Therefore, in order to maximizethe utilization of pulse sensor, the comparison between thefingertip and earlobe were conducted to identify which sites ofmeasurement are more reliable. As shown in Fig. 5, the pulsesensor was sewing on the index finger position of glove inorder to ease the user to wear the pulse sensor instead of strap itwith finger. Next, a sticker is stick on the surface of pulsesensor which is to prevent the sweaty or oil fingers which mayaffect the signal collection. In other hand, the secondexperiment is hot glue the pulse sensor on the ear clip forfurther measurement.
L-snapPulse sensorSnap connectorR-snapFig. 7. Passive electrode placement on bicep brachii.Fig. 5. Pulse sensor is clip on earlobe (left) and sew on glove (right).B. EMG validation processThere are two type of electrode were using in this projectwhich were gel surface electrode and passive electrode asshown in Fig. 5 and Fig. 6. The gel surface electrode isdisposable electrode which mean the electrode have limited lifetime and cannot reuse. The advantage of this electrode is canconduct under body grounding or ungrounded condition. Fig. 5shows the placement of gel electrode on bicep by placing thereference electrode (black electrode) on electrically neutraltissue like bone area to ground the signal. Another twoelectrodes are placed on the target muscle by placed at twodifferent points on the muscle. It was provide the point ofreference for muscle activity to compare with the signal ofmuscle relaxation [7].IV.RESULTS AND DISCUSSIONA pulse sensor’s accuracy is evaluated by comparing thesignal given by the sensor in finger and earlobe with manuallycounting the user’s radial pulse [8]. During the experiment, theuser remains at sitting rest condition. Then the circuit power isswitched on whereby the pulse sensor is attached on userfinger. The user is requested to count their own radial pulserate for a minute during the experiment and the signalcollected from pulse sensor is save in laptop via Cooltermsoftware. After 60 second, the simulation result which recordfrom the Coolterm software are taken to calculate the averageof heart rate value and compared with the user’s final countradial pulse. The experiment procedure is repeated for tentimes. After finish taking the result on fingertip, the pulsesensor was shift to user earlobe and repeated the sameprocedure as above. The recorded result was shown in Table Iand Table II.After the comparison of result Table I and Table II, it wasshown that the accuracy of pulse sensor attach on earlobe andfinger was only slightly difference or consider approximatelysame during the rest condition .TABLE I.MEASUREMENT OF PULSE SENSOR ON FINGER AND RADIALPULSEFig. 6. EMG gel Electrode placement on bicep brachii.In other hand, the passive electrode is the product ofOlimex- EKG-EMG-PA. The advantage of the passiveelectrode is reusable after the measurement but it must makesure the body is grounded condition. It is means the result willaffect if the subject leg is not in land. For the placement ofpassive electrode, The R snap connector is placed on the targetmuscle while L snap connector placed slightly off the center togive a point of reference for muscle activity compared to thesignal of muscle relaxation. Lastly, the DLR snap connector isplaced in another hand wrist to ground the signal.TestPulse Sensor (BPM)Radial Pulse .430.580.821.130.301.071.48
TABLE II.MEASUREMENT OF PULSE SENSOR ON EARLOBE AND RADIALPULSETestPulse Sensor (BPM)Radial Pulse .600.001.232.780.130.831.02In the experiment of muscle sensor, there are two type ofelectrode were using which are passive electrode and gelsurface to record the EMG signal of user Bicep muscle. Afterfinish the placement of passive electrode, the user wererequested to make several time of muscle contraction and theEMG signal of user were recorded. The data were shown inFig. 8 and Fig. 9.As showed in Fig. 8, the Burst moment is the musclecontraction moment which easily noticed by the sudden breakin the baseline Silence moment is when no contraction isoccurring and therefore the signal stay maintain in baselineclose to zero. As mention earlier, the output signal of musclesensor is depending of the muscle contraction. The increase ofmuscle activation, the increase of output signal by musclesensor was collected.The second experiment involves physical activities byrunning of treadmill for the purpose of testing performance ofheart rate monitoring system. The user was request to run onthe treadmill with the speed of 8 km/hr for about three minutes.Then, the data start to record from pulse sensor on finger andtreadmill respectively within 60 second. The procedure isrepeated by attach the pulse sensor on user earlobe. Therecorded results wer
system is knitted with a pulse sensor and muscle sensor V3. Arduino Uno was act as microcontroller to analyze the collected signal then transmits the data via Bluetooth to Android based smartphone; Laptop through Processing software; or LCD screen. The significant of using Processing software is allow display the data in graphical way. The pulse sensor is applying photoplethsmography (PPG .