Transcription
A&A 631, A47 stronomy&Astrophysicsc ESO 2019Disentangling the Arcturus streamIryna Kushniruk and Thomas BensbyLund Observatory, Department of Astronomy and Theoretical Physics, Box 43, 221 00 Lund, Swedene-mail: iryna@astro.lu.se, tbensby@astro.lu.seReceived 8 February 2019 / Accepted 9 September 2019ABSTRACTContext. The Arcturus stream is an over-density of stars in velocity space and its origin has been much debated recently without anyclear conclusion. The (classical) dissolved open cluster origin is essentially refuted; instead the discussions try to distinguish betweenan accretion, a resonant, or an external-perturbation origin for the stream. As kinematic structures are observational footprints ofongoing and past dynamical processes in disc galaxies, resolving the nature of the Arcturus stream may provide clues to the formationhistory of the Milky Way and its stellar populations.Aims. We aim to characterise the kinematical and chemical properties of the Arcturus stream in order to resolve its origin.Methods. The space velocities, angular momenta, and actions for a sample of more than 5.8 million stars, composed from GaiaDR2 were analysed with a wavelet transform method to characterise kinematic over-densities in the Galactic disc. The kinematiccharacteristics of each identified group is used to select possible members of the groups from the GALAH and APOGEE spectroscopicsurveys to further study and constrain their chemical properties.Results. In the velocity and angular momentum spaces the already known Sirius, Pleiades, Hyades, Hercules, AF06, Arcturus andKFR08 streams are clearly identified. The Hercules stream appears to be a mixture of thin and thick disc stars. The Arcturus stream,as well as the AF06 and KFR08 streams, are high-velocity and low-angular momentum structures with chemical compositions similarto the thick disc. These three groups extend further from the Galactic plane compared to the Hercules stream. The detections of allthe groups were spaced by approximately 20 30 km s 1 in azimuthal velocity.Conclusions. A wide spread of chemical abundances within the Arcturus stream indicates that the group is not a dissolved opencluster. Instead the Arcturus stream, together with the AF06 and KFR08 streams, are more likely to be part of a phase-space wave,that could have been caused by a merger event. This conclusion is based on that the different structures are detected in steps of20 30 km s 1 in azimuthal velocity, that the kinematic and chemical features are different from what is expected for bar-originatedstructures, and that the higher-velocity streams extend further from the disc than bar-originated structures.Key words. stars: kinematics and dynamics – Galaxy: formation – galaxies: kinematics and dynamics – galaxies: evolution1. IntroductionThe process by which large spiral galaxies form and evolve intothe complicated structures that are observed today is an activearea of research, and presents many challenges, both theoretically and observationally. As the Milky Way is the only galaxywhere stars and structures can be studied in great detail, it servesas a benchmark galaxy when constraining models of galaxy formation. It is therefore of utmost importance to obtain a detailedmap of the Milky Way looks like, and to decipher where theobserved stellar populations and structures come from. Currently, the Milky Way contains a plethora of structures, bothphysical and kinematic, whose nature and origins are unclear.Many studies have shown that the velocity distribution of starsin the Milky Way disc is clumpy (e.g. Dehnen 1998; Skuljan et al.1999; Famaey et al. 2005; Antoja et al. 2008, 2012; Kushniruket al. 2017; Ramos et al. 2018). The kinematic and chemical properties of such structures can be used to constrain the propertiesand the formation history of the Milky Way. For example, the Hercules stream has been widely used to probe the pattern speed andthe length of the Galactic bar (e.g. Dehnen 2000; Minchev et al.2007; Antoja et al. 2014; Wegg et al. 2015; Pérez-Villegas et al.2017). Kinematic structures can be used to study the spiral structure of the Milky Way (e.g. Quillen & Minchev 2005; Chakrabarty2007; Sellwood et al. 2019; Quillen et al. 2018). Studies of kinematic streams especially in the Galactic halo can tell us about themerger history of the Milky Way (e.g. Navarro et al. 2004; Helmiet al. 2006, 2017, 2018; Koppelman et al. 2018). The analysis ofthe Gaia DR2 (Gaia Collaboration 2018a,b) revealed that the kinematic over-densities are a part of a much more complicated structure that is seen as arches and ridges across velocity space and asclumps in action space (Trick et al. 2019). This structure is possibly caused by spiral arms (Quillen et al. 2018) or is a result ofthe phase-mixing due to a past merger event (e.g. Katz et al. 2019;Antoja et al. 2018; Ramos et al. 2018; Laporte et al. 2019), as firstproposed by Minchev et al. (2009).This structure is possibly caused by spiral arms or is a resultof phase-mixing due to a past merger event (e.g. Antoja et al.2018; Ramos et al. 2018; Quillen et al. 2018). As these studies have shown, learning more about the nature of kinematicstructures can improve our understanding of the evolution of theMilky Way. In this paper we investigate the properties and originof the Arcturus stream.A set of about 50 stars, including the star Arcturus (α Bootis), was discovered by Eggen (1971) to have a very similar Vspace velocity component of V ' 100 km s 1 . Eggen (1971)proposed that this over-density in velocity space is composedof stars that escaped from an open cluster and it was thereforenamed the Arcturus moving group. Nowadays the hypothesisof the Arcturus over-density being a moving group is refutedas there is no chemical homogeneity within the group (e.g.Williams et al. 2009; Ramya et al. 2012; Bensby et al. 2014),Article published by EDP SciencesA47, page 1 of 18
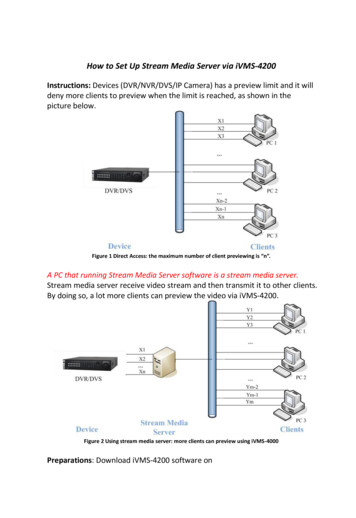
A&A 631, A47 (2019)which there should be if the stars originate from the same opencluster (e.g. De Silva et al. 2007; Bovy 2016). We have therefore chosen to adopt the “stream” nomenclature when referringto this Arcturus over-density of stars in velocity space.Two other possible origins of the Arcturus stream are nowfavoured and are widely discussed. The first is an accretion eventscenario, where a small satellite galaxy merged with the MilkyWay and caused this dynamical structure (e.g. Navarro et al.2004; Helmi et al. 2006; Minchev et al. 2009). The second possibility is that it has originated due to resonances with the Galacticbar or spiral arms that cause kinematic over-densities (e.g.Gardner & Flynn 2010; Monari et al. 2013). The chemical properties of the stream do not show any chemical peculiarities,which would be expected in the case of an extra-Galactic origin(e.g. Ramya et al. 2012; Bensby et al. 2014). At the same timethe low angular momentum and the low velocity of the streamindicate that it could be another substructure of tidal debris inthe Galactic halo (e.g. Arifyanto & Fuchs 2006; Klement et al.2008; Zhao et al. 2014). Despite numerous approaches to studythe origin of the Arcturus stream (e.g., numerical simulations,kinematic analysis, and studies of elemental abundances), thereis no consensus on its origin.The aim of this paper is to characterise the nature of theArcturus stream and constrain its origin. We start by detectingand characterising the velocities of the Arcturus stream using alarge stellar sample constructed from the Gaia DR2 catalogue(see Sect. 2). We then search for over-densities in the velocity,angular momentum, and action spaces to obtain the kinematiccharacteristics of the stream (see Sects. 3–5). Subsequently,we investigate the chemical characteristics of the group usingthe data from the GALAH (Buder et al. 2018) and APOGEE(Holtzman et al. 2018) spectroscopic surveys (see Sect. 6). Weconclude by discussing the possible origins for the Arcturusstream based on the kinematic and spectroscopic findings (seeSects. 7 and 8).2. Stellar sampleTo search for the Arcturus stream, a wavelet analysis was appliedfor a stellar sample defined by velocities, angular momentum,and action components. To calculate these parameters positionson the sky, proper motions, parallaxes, radial velocities, and thecorresponding uncertainties for these properties are needed.The size of the stellar sample and the quality of the astrometric data play a key role when hunting for kinematic structures.As the size of the samples of stars with available high-precisionastrometric data increases, so does the level of detail with whichit is possible to study kinematical structures of the Galaxy. Thecurrently best data source is the Gaia satellite, which is an ongoing full-sky mission that aims to provide high-precision astrometric parameters for more than a billion targets over the wholesky. The most recent data release, Gaia DR2 (Gaia Collaboration2018a), contains astrometric data for almost 1.7 billion targets,and radial velocities for a small subsample of about 7 milliontargets.A stellar sample of 5 844 487 stars was constructed from theGaia DR2 catalogue in the following way:– 7 173 615 stars were obtained from McMillan (2018), whoestimated distances for Gaia DR2 stars with measured radialvelocities.– Stars with bad fits of Gaia DR2 astrometric parameterswere filtered out to avoid possible systematic errors in the stellar sample. Following the procedure suggested in Lindegren(2018) a re-normalised unit weight error (RUWE) was used toA47, page 2 of 18estimate goodness of astrometric fits. Selecting those targetswith RUWE 1.4 leaves us with 6 692 285 targets. Photometricfiltering that rids the sample of stars with poor astrometric solutions (see Eq. (2) in Arenou et al. (2018)) was also applied. Thiscut leaves us with 6 683 408 stars.– Space velocities U, V, W 1 together with angular momentaand actions that are used below were computed using the galpy2package (Bovy 2015). For action estimates we used a MWPotential2014 axisymmetric gravitational potential model pre-definedin galpy. Velocity uncertainties σU , σV , σW were computed following equations from Johnson & Soderblom (1987). The velocities are given relative to the Local Standard of Rest: (U , V ,W ) (11.1, 12.24, 7.25) km s 1 (Schönrich et al. 2010).Taking into account the results from, for example, Zhaoet al. (2014), the typical size of kinematical structures is around20 km s 1 . Therefore we need to cut stars with σU , σV 20 km s 1 ,because such large velocity uncertainties will influence the precision of the results, that is the position in velocity space of thestructures. This leaves us with 6 002 514 stars.– Next, the sample was constrained to stars that are locatedwithin a distance of 5 kpc from the Sun. This filters out starsthat are located in the outskirts or in the very inner parts of theGalaxy, and thus, cannot be a part of any of the local kinematicstructures. The limit of 5 kpc was chosen to avoid regions indirect contact with for example the Galactic bar, whose halflength is about 3 kpc (e.g. Dehnen 2000; Minchev et al. 2010;Monari et al. 2017). According to Bailer-Jones (2015), distanceestimates should not be dominated by using pre-Gaia information or so-called priors if fractional parallax uncertainty does notexceed 20%. Typical parallax uncertainty for bright sources inGaia DR2 is about 0.4 µas (Lindegren 2018). Converting the5 kpc cut into µas and calculating fractional parallax uncertaintywe obtain 20% meaning that distance estimates in the sampleshould not be effected by priors. This cut leaves 5 844 487 thatare used in our analysis.Since kinematic structures are local phenomena (e.g. Antojaet al. 2012; Ramos et al. 2018; Trick et al. 2019) and the stellar sample covers a wide range in X and Y, it was divided into66 smaller volumes that were investigated separately. Each boxis 0.4 kpc in radial coordinates and 3 in azimuthal angle3 . Thetop plot in Fig. 1 shows the distribution of the 5 844 487 starsin the Galactic Cartesian X Y plane and how it is divided intosmall volumes. The name of each region, the number of stars,the median distance from the Sun, and median distance uncertainty are given in Table A.1 for each of the 65 volumes. Thebottom plot in Fig. 1 shows the sample in Cartesian X and Zcoordinates, where Z is a vertical component of Galactocentriccoordinate system (points towards the north Galactic pole).3. MethodOur current knowledge of the Arcturus stream is based on observations within a small region of about 500 pc around the Sun.Its origin is unknown, mainly due to the fact that there areonly rough estimates of its kinematic characteristics and itschemical properties are not well studied. Our strategy is therefore to search for streams in four different planes defined by1U points towards Galactic centre, V velocity defines the direction ofthe Galactic rotation, W points at the North Galactic Pole.2Available at http://github.com/jobovy/galpy3R is the radial coordinate pointing towards the Galactic anti-centre,and φ is the azimuthal angle following the direction opposite to theGalactic rotation.
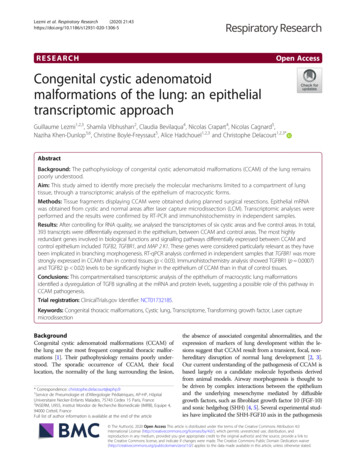
I. Kushniruk and T. Bensby: Disentangling the Arcturus streamFig. 1. Distribution of 5 844 487 stars with σU and σV 20 km s 1 and R 5 kpc in X and Y (top), and X and Z (bottom) Cartesian Galacticcoordinates. Blue and magenta boxes show 66 small regions investigated in this work and their names are written at the top in white. The dashedline in the top plot shows the solar circle. The black line in the bottom plot shows Z 0 kpc. The bin size is 0.05 kpc for both plots.combinations of velocity, angular momentum and action components respectively: the U V plane, the V U 2 2V 2 plane, theq Lz L2x Ly2 plane, and the Lz Jr plane. This will allows tocharacterise structures in terms of velocities, angular momenta,and actions, and obtain stronger criteria on how to select starmembers of kinematic structures.3.1. Investigated planesThe distributions of stars in all four planes are shown in Fig. 2.The majority of the stars in our sample have negative V velocities between V ' 0 and 200 km s 1 and angular momentum Lz between 0 and 2500 kpc km s 1 . The disc stars arelocated at Lz ' 1800 kpc km s 1 , the halo stars are expected atLz ' 0 kpc km s 1 .3.1.1. The U V planeThe U V plane is widely used to search for kinematic structures(e.g. Dehnen 1998; Antoja et al. 2008, 2012, 2018; Kushniruket al. 2017; Ramos et al. 2018; Katz et al. 2019). It allows totrace kinematic over-densities of different origin without makingany assumptions on orbital parameters of stars or on the Galacticpotential. The only limitation of this method is that stellar volumes must be relatively small (around 0.1 0.5 pc in X and Y; seeTrick et al. 2019), since kinematic structures in the U V planeare local. On the other hand, this limitation is an advantage, sinceit allows us to follow how the structures move in physical space(Ramos et al. 2018). The Arcturus stream is expected to be one ofthe arches in the U V plane localised around V ' 100 km s 1in the nearby sample. The stream is likely to cover a wide rangeof U velocities (Williams et al. 2009).A47, page 3 of 18
A&A 631, A47 (2019)q Fig. 2. Density map of the selected sample of 5 844 487 stars in U V space (top left), in V U 2 2V 2 space (top right), in Lz L2x Ly2 space (bottom left), and in Lz JR space (bottom right). The bin sizes are 1 km s 1 , 1 km s 1 , 10 kpc km s 1 , and 10 0.1 kpc km s 1 , respectively.p3.1.2. The V U2 2V 2 plane Examining the distribution of stars in the V U 2 2V 2 planewas proposed by Arifyanto & Fuchs (2006). Here, V is proportional to Lz , a vertical component of the angular momentum,and is an integral of motion in axisymmetric potentials. U 2 2V 2is a measure of eccentricity in Dekker’s approximation (Dekker1976). This means that we search for structures that share similar orbital eccentricity. This approach is applicable only forplanar orbits in axisymmetric potentials. The method showsreliable results for nearby stars with eccentricities up to 0.5(Arifyanto & Fuchs 2006). The V U 2 2V 2 plane was usedby Klement et al. (2008) and Zhao et al. (2014) to search forkinematic structures and allowed to reveal several structuresincluding the Arcturus stream. We expect to detect the Arcturusstream at the velocities around V ' 100 km s 1 in the solarneighbourhood (e.g. Williams et al. 2009).3.1.3. The Lz qL2x L2y planeAnother approach to search for kinematic groups was proposedby Helmi et al. (1999) who suggested to examine theq distributionof stars in the plane characterised by the Lz and L2x Ly2 integrals of motion, where L x , Ly , and Lz are angular momentum components in X, Y, and Z directions. The method is used to searchfor phase-mixedqstars on similar orbits. The disadvantage of thismethod is thatA47, page 4 of 18L2x Ly2 is not fully conserved in axisymmetricpotentials, but still allows dynamical structures to be revealed (e.g.Helmi et al. 1999; Klement et al. 2008; Zhao et al. 2014). TheArcturus stream is expected at Lz in the range between 700 and1100 km s 1 kpc (e.g. Navarro et al. 2004). 3.1.4. The Lz Jr planeThe most general method to search for kinematic structuresis to investigate action space. Actions are conserved quantitiesthat characterise stellar orbits. In this work we use radial andazimuthal actions Jr and Lz that are a measure of orbital eccentricity and orbital angular momentum. As suggested in Tricket al. (2019) taking the square root of radial action will makethe final plots more clear. The action space was investigated by,for example, Sellwood (2010) and Trick et al. (2019) and is richin kinematic over-densities. We expect to detect the Arcturusstream at Lz in the range between 700 and 1100 kpc km s 1 (e.g.Navarro et al. 2004).3.2. Wavelet transformTo search for kinematic structures, the methodology describedin Kushniruk et al. (2017) was used with some additions. Todetect over-densities, a wavelet transform was qapplied to the 22stellar sample in the U V, V U 2V , Lz L2x Ly2 , and Lz Jr planes. The noise from the wavelet maps was then filtered and Monte Carlo simulations were used to verify whetherthe detected structures are real or not.
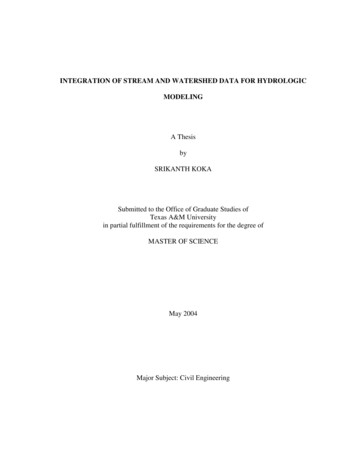
I. Kushniruk and T. Bensby: Disentangling the Arcturus streamThe data were analysed by the wavelet transform with the“a trous” algorithm (Starck & Murtagh 1998) applied to thestars in all 65 regions in the four different planes separately.The input data are in the form of a binned stellar density mapin the velocity, angular momentum, and action planes. The binsizes were set to 1 km s 1 for qthe U V, and the V U 2 2V 2planes, to 2 km s 1 kpc for the L2x Ly2 Lz plane, and to 0.1 10 kpc km s 1 for the Lz Jr plane. Due to the limitations of theusage of the V U 2 2V 2 plane, as discussed in Sect. 3.1.2,the stars that have orbits with eccentricities e 0.5 were cutout. The output data are a set of wavelet coefficients at differentscales that contain information about the presence of substructures. A higher wavelet coefficient means a higher probabilitythat the structure is real. The scale J is proportional to the sizeof the detectable structures s. Scales J 1, 2, 3 and 4 wereinvestigated for all maps. The relation between scale and binsize s J 2 J characterises the typical sizes of detectable structures. The wavelet coefficient maps were then filtered for Poissonnoise. The wavelet transform part as well as noise filtering fromthe output wavelet maps were performed in The multiresolutionanalysis software (MR software)4 developed by CEA (Saclay,France) and the Nice Observatory. More details on the algorithmitself can be found in Starck & Murtagh (2002), and more detailson the methods used to search for over-densities and structurescan be found in Kushniruk et al. (2017).3.3. Acquiring positions of the detected peaksMonte Carlo (MC) simulations were performed to obtain theprecise positions of the peaks. Monte Carlo samples were created assuming that each star can be represented as a Gaussianvelocity distribution with µ (U, V) and σ (σU , σV ) for thetwo velocity components. To generate MC samples in angularmomentum and action space, the orbits of stars were computedassuming that positions, proper motions, and radial velocitiescan be represented as Gaussians in a similar way to velocities. Here it is assumed that Gaussians are independent and donot consider correlations between astrometric parameters. TheseMC samples are then analysed in the same manner as the original data. Convergence is reached when the number of structures and their positions do not change as more simulations areadded. Typically, results converge after about 30 simulations, butto be sure of convergence, 100 MC samples were created forall regions. Subsequently, MC wavelet maps for different scaleswere over-plotted and used to search for peaks by applying thepeak local max feature from the scikit-image5 Python package(van der Walt et al. 2014). In this work we focus on the J 2and J 3 scales as they allow us to detect most structures.4. Results4.1. Stellar streams in the nearby sampleFigures 3 and 4 show 100 over-plotted wavelet maps for the central region 00 in four different planes for scales 2 and 3, respectively. Both scales show richness of kinematic structures for thenearby sample. The list of the centres of the peaks and the corresponding uncertainties are given in Table A.2 for scale J 2 andin Table A.3 for scale J 3. The fact that well-known groupslike Sirius, Coma Berenices, Hyades, Pleiades, and Hercules45Available at image.org/were identified at the expected positions shows that our methodis sound (see Tables 3–7 in Kushniruk et al. 2017 that summarise literature values for the U and V velocities of Sirius,Coma Berenices, Hyades, Pleiades, and Hercules). These groupsare detected in all four planes. The detection of other groupsvaries between the planes. Figure 3 for scale J 2 shows thesame structures as in Fig. 4 for scale J 3 but in greater detail.We decided to focus on scale J 2 since it is more sensitiveto smaller structures. By comparing our results in the nearbyregion “00” (centred around the Sun; see Fig. 2) for scale J 2with what has previously been found in the literature (e.g. Eggen1998; Navarro et al. 2004; Arifyanto & Fuchs 2006; Klementet al. 2008; Williams et al. 2009; Antoja et al. 2012, 2018; Zhaoet al. 2014; Kushniruk et al. 2017; Trick et al. 2019; Ramos et al.2018) we assign names to the structures. Curved lines and boxesof different colours in Figs. 3 and 4 correspond to the names ofthe groups listed in the legend of Fig. 3. The structures found inthe nearby region are discussed below:– A1/A2: Groups with V 15 km s 1 and Lz 2000 kpckm s 1 we link to arches A1 and A2 detected by Ramos et al. (2018,see their Table 2). Groups A1 and A2 is shown with yellow linesand boxes on the plots.– Sirius: The blue line and boxes correspond to the Siriusstream. Group 13 in the U V space is potentially Bobylev16(see Bobylev & Bajkova 2016) and could be a continuation ofSirius.– γLeo: The pink line slightly above Sirius in V is γLeostream (see Antoja et al. 2012). Unlike the majority of thegroups, γLeo is located at positive U velocities. The streamcould be a continuation of Sirius arch since both have similarangular momenta.– Coma Berenices: The magenta line just below Sirius isComa Berenices stream. Unlike arch-like neighbouring Siriusand Pleiades/Hyades, Coma Berenices is a clump in the U Vplane and is consequently a shorter line in the angular momentum space.– Dehnen98/Wolf630: Wolf630 and Dehnen98 (see Antojaet al. 2012; Dehnen 1998) are two small groups in betweenComa Berenices and Pleiades/Hyades streams. They are shownin brown colour and could be a continuation of Coma Berenices.– Pleiades/Hyades: A grey arch in the U V plane is associated with the Pleiades/Hyades stream. Group 29 in the U Vspace linked to Antoja12(15) (see Antoja et al. 2012) could be acontinuation of stream.– Hercules: Orange lines and boxes correspond to theHercules stream, which is likely to be composed of a few substructures that are visible in the angular momenta and actionspaces.– HR1614: The HR1614 moving group (see Feltzing &Holmberg 2000; De Silva et al. 2007) we connect to the clumpsjust below Hercules in V. The group is shown in lime green.– Ind: Groups g34 and g35 in the U V plane are linkedto a group called Ind (see Antoja et al. 2012). The structure ismarked in black.– AF06: The AF06 stream was first found by Arifyanto &Fuchs (2006) in the range between V ' 70 and 100 km s 1 .We did not find it in the U V space, but the group is detected inthe other three spaces and is shown with red boxes.– Arcturus: Group g36 in the U V plane could be theArcturus stream. Median V velocity and angular momentum ofg36 are V ' 92 km s 1 and Lz 1118 kpc km s 1 . These valuesare a bit higher compared to for example values from Navarroet al. (2004), but are within the uncertainties. In the V U 2 2V 2plane the nearest to Arcturus are groups g1 and g2 which haveA47, page 5 of 18
A&A 631, A47 (2019)q Fig. 3. Wavelet coefficient maps of central region 00 retrieved in U V (top left), V U 2 2V 2 (top right), Lz L2x Ly2 (bottom left), and Lz JR (bottom right) space for scale J 2. Colour bars show normalised wavelet coefficients. Kinematic structures are shown as blue circleswith radius 5 km s 1 or 5 kpc km s 1 and their centres are shown with black crosses. Lines and boxes of different colours correspond to the groupnames as listed in the legend. We note that numbers assigned to the groups do not match between the planes.the same angular momentum and radial action as g36 in the U Vplane. In the angular momentum space g21 has the parametersclosest to Arcturus. In action space there are two candidates: g9and g2. The first group is consistent with the groups detected invelocity spaces, the second one has lower angular momentumand higher V velocity. Taking into account works by for exampleKlement et al. (2008) and Zhao et al. (2014) we link g2 to the Arcturus stream and group g9 to the AF06 stream. Arcturus is shownas green lines and boxes on the wavelet maps.– KFR08: Among the detected groups we assign one weakover-density in action space at Lz ' 575 kpc km s 1 to the groupcalled KFR08. The structure was first detected by Klement et al.(2008) at V ' 160 kpc km s 1 . Group g1 detected in actionspace has exactly the same median V velocity. KFR08 is shownin cyan on the wavelet maps.Overall, 36 groups at scale J 2 and 16 groups at scaleJ 3 were discovered in the U V plane that form largerscale arches as discussed in Ramos et al. (2018), Antoja et al.(2018), and Gaia Collaboration (2018b). We alsoq conclude thatthese arches correspond to the lines in the Lz L2x Ly2 planeA47, page 6 of 18 and to clumps in the V U 2 2V 2 and Lz Jr due to thevery similar properties of the groups (see Tables A.2 and A.3).In the V U 2 2V 2 , 17 and 8 groupswere detected. Action space very closely mimics the V U 2 2V 2 plane very muchbut allows the structures to be detected in greater detail. In theangular momentum and action spaces, 24 groups were found ineach space at scale J 2 and 9 and 10 groups at scale J 3,respectively.4.2. Stellar streams outside the solar neighbourhoodThe solar neighbourhood volume is well-studied and thus itis relatively easy to match the detected groups with groupsthat have been identified by other studies in the literature. Thebehaviour of the groups outside the solar volume was studied byfor example Antoja et al. (2012) and Ramos et al. (2018). Both ofthese latter studies found a decreasing trend for V velocity whenmoving to the volumes at larger R. In this work we also investigated the trends of the structures depending on the position inthe Galaxy with a focus on the Arcturus stream.
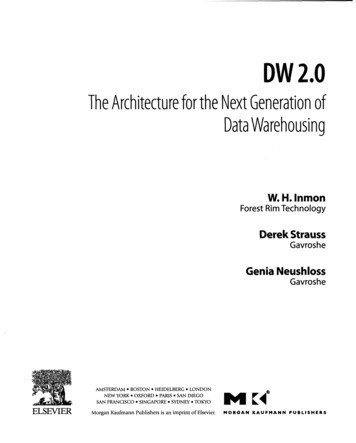
I. Kushniruk and T. Bensby: Disentangling the Arcturus streamFig. 4. Same as Fig. 3 but for scale J 3. Lines and boxes correspond to the structures detected at scale J 2. We note that numbers assigned tothe groups do not match between the planes.If one looks at the small volumes from the left-hand sideof Fig. 2 and move towards positive X values an increase in Vvelocity can be observed. As an example of this trend, Fig. 5shows how the V velocity of the groups evolves with Galactocentric distance R in regions 01, 01a, 00, 21, and 21a based onthe analysis of the U V plane. For example, the Hercules streamin region 01 is detected at V ' 70 km s 1 , and for comparison,in region 21a the Hercules stream shifts towards positive V and islocated at V ' 40 km s 1 . Similar behaviours are observed formost of the major streams and is shown in the top plot of Fig. 5.On the wavelet maps for regions 01a and 21a that are shown inthe middle and bottom plots of Fig. 5 we draw the lines fromthe top left plot in Fig. 3. Taking volumes at larger R shifts thegroups towards higher V values and vice verse.If one fixes the Galactocentric distance and starts exploringthe regions at high φ moving down towards negative φ (e.g.,start at region 15 and go down to region 35), the streams areobserved at the same position in V. Major streams includingSirius, Pleiades, Hyades, and Hercules have the same angularmomentum when fixing R and looking at different φ. This isdifferent from results in Monari et al. (2019) who found thatthe Hercules angular momentum changes with azimuth at solarradius. We also do not observe this change when fixing R insideand outside the solar circle.The shape of the angular momentum and action spaceschanges slightly at different R, but almost all main structuresdetected in the solar volume remain at the same positions withina box de
the Galactic halo (e.g.Arifyanto & Fuchs2006;Klement et al. 2008;Zhao et al.2014). Despite numerous approaches to study the origin of the Arcturus stream (e.g., numerical simulations, kinematic analysis, and studies of elemental abundances), there is no consensus on its origin. The aim of this paper is to characterise the nature of the