Transcription
NBER WORKING PAPER SERIESAN ECONOMIC ANALYSIS OF THE DIET, GROWTH,AND HEALTH OF YOUNG CHILDRENIN THE UNITED STATESDov ChernichovskyDouglas CoateWorking Paper No. ).i6NATIONAL BUREAU OF ECONOMIC RESEARCH1050 Massachusetts AvenueCambridge MA 02138December 1979The research reported here is part of the NBER's researchprogram in Health Economics. Any opinions expressed arethose of the authors and not those of the National Bureauof Economic Research. Research for this paper was supported by PHS Grant No. 1 ROl HS 02917 from the NationalCenter for Health Services Research to the NBER and by agrant from the Robert Wood Johnson Foundation to the NBER.
NBER Working Paper 416December, 1979An Economic Analysis of the Diet, Growth, andHealth of Young Children in the United StatesABSTRACTThe purpose of this paper is to investigate the extent towhich family income and education are obstacles to the provisionof adequate diets for young children in the United States. Anexamination of the Health and Nutrition Examination Survey revealsthe following:1. Average nutrient intakes of young children are well aboverecommended dietary standards, with the exception of iron.2. Average nutrient intakes for children in households oflower economic status are very similar to intakes of children inhouseholds of higher economic status. Rates of children's growthare also similar in these households.3. Family income and education of the household head havestatistically significant but very small positive effects on thenutrient intake levels of young children.4. There are substantial effects of protein intakes onchildren's height and head growth, even though protein is consumedin excess of dietary standards. This finding and the apparentcorrelation between children's growth and their intellectual development brings to question the adequacy of present protein standards.Could American mothers, who provide very high protein diets fortheir children in households at all levels of socioeconomic statusknow more about what constitutes an adequate diet for theirchildren than the experts do?Day CherichovskyWorld Bank and Ben—Gurion UniversityCenter for Health ServicesBen-Gurion UniversityBeersheva, Israel052—26556Douglas CoateDepartment of EconomicsNewark College of Artsand SciencesRutgers UniversityNewark, NJ 07102(201) 648—5940National Bureau of EconomicResearch15—19 West 4th Street, 8th Fir.Washington SquareNew York, NY 10012(212)598—7045
An Economic Analysisofofthe Diet, Growth, and HealthUnited StatesYoung Children in the"One Out of every three children under six years of age areliving in homes in which incomes are insufficient to meet thecosts of procuring many of the essentials of life, particularlyfood." Congressional testimony of Charles Upton Lowe, Directorof the National Institute of Child Health and Development, 1969(Chase, 1977).I. IntroductionInterest in the nutritional status of young American children hasheightened considerably in the past decade. Nuch of the concern has resulted from research suggesting varying degrees of under—nutrition in lowincomeAmerican school1 and pre—school children and from evidence indicatinga positive association between children's growth and their intellectual development.2 In this paper we analyze the choice of diet for children.one tofive years in the United States andand health.We are particularlycome and educationchildren inits relationinterested into the children's growththeextent to which family in-may be obstacles to the provision of adequate diets forAmericanfamilies. The hypothesis that these obstacles are sub-stantial underlies many government nutrition and income support programs andhas led to the Congressional mandate of two separate comprehensive nationalnutrition surveys, The Ten State Nutrition Survey, 1968—1970, and the Healthand Nutrition Examination Survey, 1971—1975.Inaprevious paper we used the Ten State Nutrition Survey (TSNS) data toexamine the nutritional status of children uptothe age of 36American families (Chernichovsky and Coate, 1978).from the analysis of TSNS data wasby muchThemonths inpoorpicture that emergedgenerally contrary to the impressions leftprevious research. The data indicated that low income parents hadpushed the growth of their children through choice of diet nearly as much as
—2—possible.Protein, a relatively high pricedtities two to threeits marginal impactnutrient,was consumed in quan-times recommended dietary standards and to an extent whereon the growth of children was very small. Family incomeand mother's education were shown not to be significant (in the statisticalsense) barriers to the provision of adequate protein and calorie intakes forchildren in poor American families. In the TSNS data average protein andcalorieconsumption wasstratifiedin excessof dietary standards whether the data wasby children's age, family income, or ethnic group. Protein intakesin these cross—tabulations were consistently two to three hundred percent ofdietary standards.In this paper we analyze the Health anddataNutritionExamination Survey (HANES)to provide further evidence on the choice of diet for young American childrenand its effect on their growth and health. This paper is divided into five sections. In the following section we describe the conceptual framework and sneèifva general model of children's diet, health, and growth. This is followed by adiscussion of the data that includes important descriptive statistics. InSection IV, we present the estimated econometric model. Thefinalsectionsummarizes the research.II. Conceptual FrameworkAs a point of departure we postulate that the utility of parents is apositive function of their children's growth. That is, within the bounds ofperceived norms, parents desire heavier and taller children.3 For our analysisit is not necessary that this desire be based on known correlationscurrenthealthbetweenperiod height and weight of children and their current and future periodstatus and intellectual development. Rather, we only argue that thisdesire does exist and that parents make sacrifices or forego other pleasuresin- order to augment the growth of theirchildren.4
—3—Although constrained by genetic and ohysiological factors, parents influence the growth of their children by their choice of diet for the childrenand by their investment in their children's health (medical care, parentalcare, sanitary conditions, etc.). The interdependencjeg among children'sgrowth, children's health and their diet are formalized in the following model.We begin by relating the parent's choice of the initial diet, D0, for anew born to birth weight, BW, which is a proxy for the infant's demand, forfood, and initial period socioeconomic influences, E, that impact on thequantity and quality of diet.D f (BW, E).(1)In each subsequent period the child's growth, G, is determined by geneticand arental traits, Z, and by diet, Dci, and health status, Htl, in thepreceding period. Health status can be interpreted as an efficiency parameterthat affects the rate at which nutrients are converted into children's growth.Formally, f(Z, Dtl, H1).(2)in each period is a function of the child's growth, which serves as afor appetite or the child's demand for food, and the economic status ofThe dietproxythehousehold.Dt Er).(3)The child's health status is a function of his diet, growth and other inuts whichproduce good health, X,Ht h(X,Dr).
—4—The levels ofare determined by socioeconomic status e(E).(5)In order to statistically identify certain key relationships and to makethe model consistent with available cross—section data, several assumptionsare necessary, some of which are explicit in equations 1—5. First, birthweight is considered exogenous to our model of children's growth, diet andhealth. A more sophisticated model could include birth weight as an endogenousvariable and relate it to parental characteristics, diet of the mother and socio-economic variables. We also assume that some variables are serially correlated(e.g., diet, household income) or constant (e.g., mother's education, parentaltraits) over t and that the time increments are infinitesimal.To isolate the role of diet as a bridge from socioeconomic status tochildren's growth, we can, given the assumptions detailed above, derive thefollowing simultaneous equations from (2), (3), andC g(D,D f(G,H h(,(4)H, t, Z, BW)(6)E)(7)C, E)(8)which specifies D, C, and H as endogenous variables. Equation (6) is basicallya technical relationship, describing how children's growth responds to diet andhealth levels, given age, birth weight andparentaland genetic characteristics.Equations (7) and (8) are primarily behavioral relationships, explaining thechoice of diet in the household for the children, given socioeconomic constraints,andthesubsequent influence of diet andgrowth on health levels.
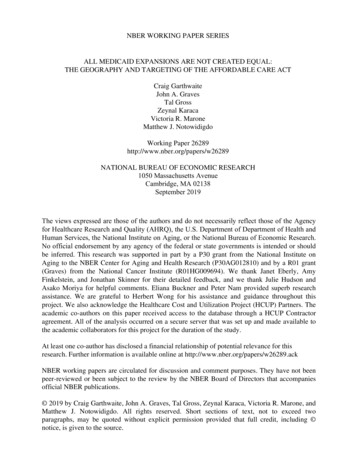
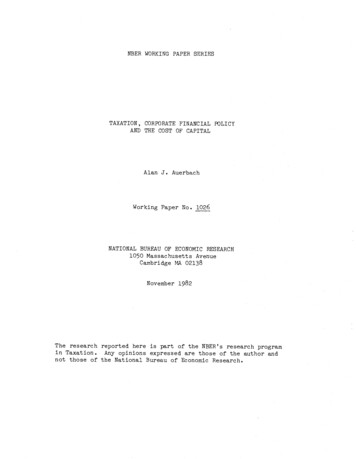
—5—III.The DataHANES is anationa]. sample of the population of the United States, withoversampling of low income families. The entire HANES sample, which wascollected between 1971 and 1975 by the National Center for Health Statistics,contains approximately 28,000 individuals between the ages of 1 and 74.Slightly less than 3,000 children aged 1 to 5 years were included in the sample.Dietary intake data for the previous 24 hours were collected for children lessthan five years of age by interview of the homemaker. A working sample of 2515was created by deleting all observations (children) with missing data. Theroughly 450 children deleted from the samDle did not differ significantly fromtheworking sample inhead,forterms of age and sex specific nutrient intakes or height,and weight growth. RANES is described indetail by the National CenterHealth Statistics (1973, 1977).Descriptive statistics for variables collected in HANES relevant to ouranalysis are presented inTable1. Endogenous variables in our econometricspecifications are selected from the measures of children's diet, health,and growth. Measures of children's growth are height, weight, and head cir—cuinference. Measures of children's health are lifetime number of overnighthospitalizations and number of colds in the six months prior to the medicalhistory. Children'svitamindiet isA and vitamin Cmeasuredby calorie, protein, calcium,iron,intakes.Exogenous variables in the growth equations are measures of aenetjcparental traits, namely children'sandage, sex, birth weight, birth order, race,mother'sheight and weight,nutrientintake and health equations are family income, family size, and dummyand father's height. Exogenous variables in thevariables reoresenting education of the household head and whether the head isfemale.
—6—Table 1Summary StatisticsVariableDaily caloriesDailyDailyDailyDailyprotein (gin)Vitamin C (ing)iron (tug)calcium (tug)Daily Vitamin A (lU)Weight (kg)Height (cm)Head circumference (cm)HospitalizationsColds (last six months)Age (months)Sex (1 male)Birth weight (oz.)Birth orderRace (1 non—white)Mother's height (in.)Father's height (in.)Mother's weight (lbs.)Household incomeHousehold sizeYears of schooling of household headless than 12)Schooling 1 (1Schooling 2 (1 12)13 to 16)Schooling 3 (1more than 16)Schooling 4 (1Sex of household head (1 632.03.37.38.19.06.46.48.39.24.16.36
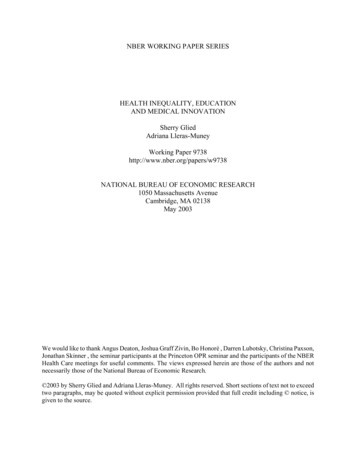
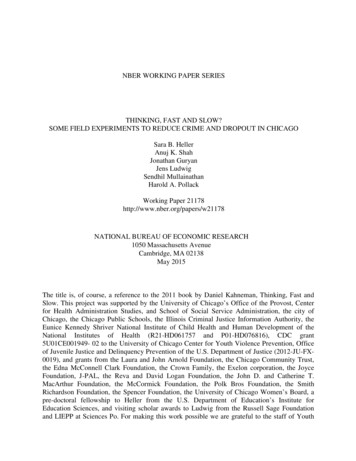
—7—The mean family incomeoftional average of 12,500 and 9,280 is considerably below the 1972 na-isindicative of the oversampling of lowprotein intakes of 1516 and 56and calorie standards of roughlyin-come families. The mean calorie andgramsare considerably above the protein1330and26, grams for children of the age and weight corresponding to the samplemeans.5 This finding of higher average protein and calorie intakes thandietary standards is not surprising given the similar results from theTSNS, a sample characterized by significantly lower family incomes. Children's intakes of calcium, vitamin A and vitamin C average two to threetimes recommended dietary standards in the MANES working sample. In thecase of iron, the average intake is two—thirds of dietary standards.In column 1 of Table 2, levels of growth, health, and nutrient intakesare presented for children in households falling into the upper and lowerthirty percentiles of thesignificantgroups,differencesin height, weight, or head growth between thesenor in protein, calorie, vitamin A,of vitamin C andemergespoverty index (PIR) distribution.6 There are nocalcium intakesor iron intakes. In the casesa statistically significant differencein favor of the higher PIR group. For both groupsmeannutrientintake levels consistently exceed dietary standards, with the exception ofiron. There are also no significant differences in hospitalizations although the lower PIR group had a significantly greater number of colds inthe six months prior to the medical history. The average family income andhouseholduressizefor the higher PIR group are 14,766 and 4.2. The same fig-for the lower PIR group are 3,673 and 5.7.Inthe remaining portion of Table 2 similar high and low PIR compari-sons are made for blacks and for whites in the working sample. The pat-terns of statistical significance within these stratifications areto that for the sample as a whole.similar
15.5097.9949.249358.2787.94151456.26White 1.01t n—White the Upper and Lower Thirty Percentilesbvalues are for significance test of difference between —.10t—aThe sample sizes for the lower and upper thirty percentiles are, for the entire sample, 1036 and 918; forwhites,521 and 831; for non—whites 515 and 87. The Imbalance in the white and non—white categories results from the use ofthe entire sample thirty percentile cut—off values for these sub—sample stratifications.Daily caloriesDaily protein (gm)Daily Vitamin C (mg)Daily iron (mg)Daily calcium (mg)Daily Vitamin A (IU)Weight (kg)height (cm)Head (cm)HospitalizationsColds (last six months)All eMean Levels of Growth, Nutrient Intakes, and Health for Familiesof the Poverty Index DistributionTable
—9—Further information on the nutritional status of young American childrencan be obtained by examining the diets of children light for their age andsex. In our HANES working sample the calorie and protein intakes of childrenbelow the 10th percentile in weight for their age and sex are 1440 and 53 grams,not significantly different from the working sample means and indicative ofmore than adequate intakes of these nutrients according to dietary standards.The mean family income for this group of light children is 8470. Unlesspresent and past nutrient intakes are not correlated, these numbers imi,ly thatinfluences other than diet may be responsible for producingassociatedthe condition usuallywith undernutrition. The consideration of the emprical results in thenext section will, enable us to come to firmer conclusions about the role ofsocioeconomic variables in the choice of diet by arents for their children andabout the subsequent effect of nutrient intakes on children's growth.IV. EmpiricalResultsAt the empirical level we have estimated several variations of our modelof children's diet, health, and growth. With the excei,tion of calories andprotein, the nutrient intake variables did not ai'proach statistical significanceon the growth equations, either because of their high correlations with roteinand calorie intakes or because they have very small impacts on growth at themargin. The health variables also oerformed poorly in the growth equationsin the statistical sense, apparently because these conditions have minor orvery short term growth effects that are rapidly overcome.In the presentation of the empirical results, therefore, we etmhasize amodel with the following endogenous variables: height, weight, head circumference,protein intake, andcalorieand for vitamin C intake.intake.We also report results for the colds variable
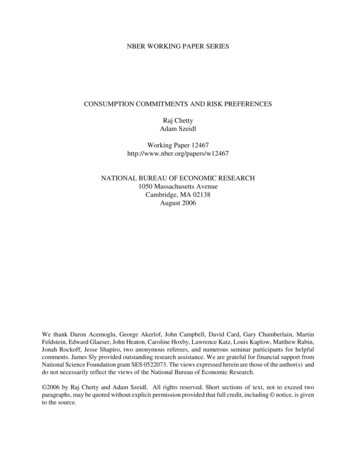
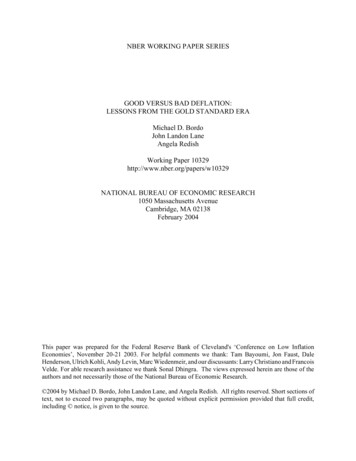
uauo uao.idIs-suptdx iaq o suzs uatuq itoi8 qatpaiadd os uaod uaq ua4a suoinba asq u.aqurnu ouIdxa ue s ppnppaqoidd '1aAatoi 's3poj;—u osie 1atbsps s asnaq uoTnbauE ;u2su-r 1-aqiuoi; ppnpxa uaaq sq aqw.1eA uTao1d auiaisapoi josuoTnba qo1 suap'[pp aq ;o sa1ursa uoTnba snou peuasa.idirnrs au4tO,I sua1pp43 iu31ppp unot( .o; uospap ap aqS[EA asaq ;o .r&.iodur aq uopsbUTuoza;o uoT oaodtwsqns u1dxa oui no UT saqpeA snouoxpaaxaaqo supq s&u-j uapi-iu utjti.y.i;o uou 'suo1nb aeu' uinusnsaz wo panpai atp ;o 3ads ups.iau iaouysaIqT1uapudappauTdau'—tin at sanpiuaiu pu aua aq apn-UT 'uo SaqB1eAApaxt eq suosso.zez qoib s,U31p43 o azts ptottasno pu saq'ç aseq ;ouopTpp aip pu sanT—T'tLIaua2uopnpa s4iaqom puU1O3UT 4ITw; 4Joi2 suaipap UTUtTdXa uT U3TUS pauv o aiesaq&A o as e- aqtoqs STTtSa. aqjioi s1ua1p-p3 ;o uopupuaq u S.ZO3TpUT e1OAeqaq UB 3pUOUO3aOpoS a4 SflSIaA Sa[q1ATuad pu aua aq ;o 93UaSfl3q suuo;TTUS aq uoapTAo.d iaq uoTu1.1o;uT aqpanpa.z qo,z s1uaiptp aq u pasa.IauT AITnc1?d aiaq UT pauasaid ai s-nsa1 uuo;panpai auiuia; T paq aqpu 'pq ptoasnoq aq ;o uonp aqptoastoq'awoQutpuiwu1np UB 'azsptotasnoq Aq pe.znsvaux saouant;trr -mouooaoos pu .xapxo qTq'qa siaioui 'sçq suaid 'ai 'xas 'ae iq panseaiuIuaid pu paua o sau uepnu pu 'aç 'qoi sua.ipppwai(8)—(9) suotnba u1o.; pa4-pap sdTqsuoTTa uuopanpaisU1o.—ot —aqjpa3npa'y
— 11—Table 3Reduced Form tSexBirth orderMother's weightMother's heightRaceIncomeHousehold 80.05(2.41)(1.55)(1.67)(0.79)0.378.380.09—0.37(1 0.02(—1.41)—0.04(—1.33)Schooling 2Colds(34.61)0.13(4.54)Father's heightProtein Vitamin C4.71(5.21)Birth weightHeight Calories(3.59)(U.16)Age squaredCircumferenceDevenden t 9(3.92)—0.12(—0.11)(0.06)Schooling chooling 0.08(0.36)(—3.84)(1.09)(1.78)(1.11)(0.66)Sex of 78.92515a(0.81)statistics in 2515.035.22515
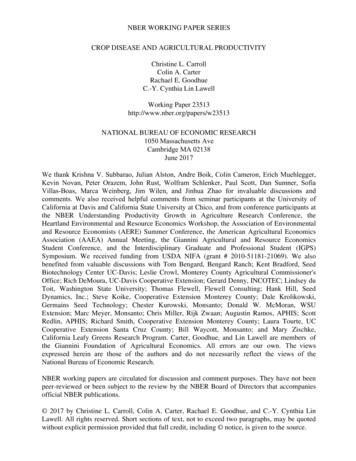
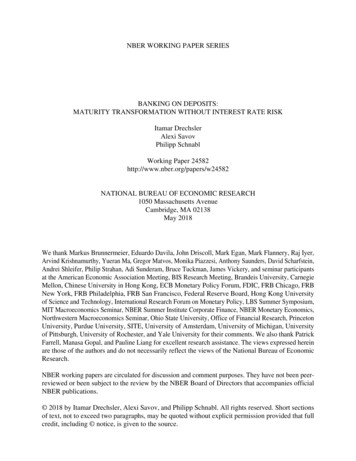
— 12 —Table 4aStructural Equation Estimates for Chi1dren' Growth and Health,Three Stage Least S4uaresDeendent 1(1.49).002(5.02)Vitamin C.011(.10).84AgeAge 7.10)(—9.45).48SexBirthweightBirth orderFather'sheightMother's .06)(.72)— .19(—3.82)Mother's height.24(31.52)— 001(—6.44)Household size.06(1.86)Schooling 2.72(—4.90)Schooling 3—1.40(—6.83)Schooling4—. 79(—2.84)aN2515b.indicates endogenous variable
—13—TABLE4bElasticities of Selected Variables aDependent ht.05CaloriesCircumference.25.20Age.38.42.21Birth weight.004.16.005Mother's weight.004.07.01Mother's height.33.46.54Father's height.27.27Race.003.001—.005Sex.003.004.003at mean values of dependent and independent variables.bindicates endogenous variable.
— 14 —ofthe diet. Protein and calories are highly colinear (r .82) so a good portionof the protein influence is captured by the calorie variable. An argument with asimilarframework explains why protein appears in the height and headgrowth equa-tions while calories does not.9In elasticity terms the most important variables in the growth equations arechildren' sage and height of the mother andwere expected anddemonstrateheightagain the importanceof the household decision makerinof the father. These resultsofvariables beyond the influencethe children's growth process. A result that issurprising is the rather substantial elasticities of children's growth with respectto nutrient intakes. The elasticities (at the means) of height and head circuxu—ference with respect to protein are .05 and .25, respectively, and the elasticityofweight with respect to calories is .20. These results imply that an increaseindaily protein consumption of ten percent or about five and one—half grams wouldincrease height by an average of one—fifth of one inch andheadcircumference byan average of one—half of one inch. A ten percent increase in calorie intakeswould increase children's weight by an average of seven—tenths of one pound. Theprotein elasticities in the height and head circumference equations seam particu-larly large in light of the fact that protein intakes average more than twicedietary standards. The protein effects on growth seem to be linear throughout therange ofappearintakes characterizing the HANES working sample: that is, we do notto be approximating a non—linear protein effect with a very small impacton growth at the margin. 10These substantial elasticities of growth with respect to nutrients thatare consumed in excess of dietary standards is consistent with the findings ofthe evaluation of the Special Supplemental Food Program for Women, Inf ants andChildren (WIC). This analysis showed that although children in poor Americanhouseholds generally consumed nutrients well in excess of dietary standards,their growth could be accelerated by increasing nutrient intakes. In light of
— 15 —these findings the WIC evaluatorsrecor!,merlded a reassessment of dietarystandards and singled out protein in particular (Edozien, et.al., 1976).C. Nutrient Intake EquationsThe simultaneous equation estimates of the protein, calorie, and vitaminequationsCare presented in Table 5. The results are similar for each of thenutrients. Simply stated they indicate, within the context of our.model, thatchildren get the amount of these nutrients that they "ask for." The child'sfor nutrients, represented by weight of the child, is a very ir!rnortantdemanddeterminant of intakes. The nutrient—weight elasticities are about one ineach case and the t—values of the weight coefficients are substantial. Thefamily income coefficients approach statistical significance but imolv veryelasticities (about .02 in each case).smallEducationnutrientof the household head has apositive but nonlinear effect onintakes. Children in families where the head has 12 years of schoolingreceive about five iercent more of these nutrients relative to children in familieswhere the head has less than 12 years of schooling. However, this education differential falls when children in families where the head has college or graduate edu-are compared to children in families where the head has less than 12 yearscationofschooling.V.primary purpose of this paper was to investigate the extent to whichAfamilyyoungSunaryincome and education are obstacles to the provision of adequate diets forchildren in the United States. Based onour examination of the HANESdatawe have, found that:1. Average nutrient intakes of youngdietarychildrenstandards, with the exception of iron.are well above recommended
— 16—TABLEStructural5aEquation Estimates for Children's Nutrient ProteinIncomeHouseholdsizeSchooling 2Schooling 3Schooling 4Sex of 3)(.70)(—1.16)aN 2515.b.Vitamin C4.03(—1.9)SexCalories(12.78)(—1.06)Age squaredVariablesindicates endogenous variable.
— 17 —Table5bElasticities of Selected VariablesaIndependentVariablesWeightDependent ncome.02.02Household Size.05.05aCouted at mean values of dependent anddent variables.bindicatesendogenous variable.indepen-
— 18 —2.nomicAverage nutrient intakes for children in households of lower eco-status arevery similar to intakes of children in householdsof highereconomic status. Rates of children's growth are also similar in thesehouseholds.3.Family income and education of the household head have statisticallysignificant but very small positive effects on the nutrient intake levels ofyoung children in the model of children's diet, growth, and health estimatedinthis paper.These findings are very consistent with those from a similar analysiswe performed with the Ten State Nutrition Survey.oftheA most interesting resultpresent study is the rather substantial estimated effects of proteinintakes on children's height and head growth, even though protein is con-sumed well in excess of dietarystandards. Thisfinding and the apparentcorrelation between children's growth and their intellectual developmentbrings to question the adequacy of present protein standards. Couldamericaninmothers, who provide very high protein diets for their childrenhouseholds at a].]. levels of socioeconomic status know more about whatconstitutes an adequate diet for their children than the experts do?
.F—lFootnotes'For examples of research into the problem of undernutrition in Americanschool and pre—school.children in the U.S., seeSims and norris (1974), andOwenChristakis(1968), Owen(1969),(1974).2Owen (1977), in his review of the effects of nutrition on growth anddevelopment, concludes that the "evidence, which still should be considered preliminary in nature, . [indicates] that bigger is srtarter, at leastcognitiveamongpre—school children."3More formally,it couldbe argued that rates of children's growth enterthe utility function in a non—linear fashion and that(e.g.excessive rates of growthobesity) are negatively related to parent's utility.4it is often pointed out that inagricultural societies parents are veryconcernedabout the size of their children because physical strength is animportantcorrelate of individual output. Although a desire for larger childrenin modern societies may not be based on a similar observation, there is evidencethatthe height or weight of children at younger ages correlate with their in-tellectual develomnent and health in later years, and thus withtheirfutureearnings.5The dietary standards cited in the text are those of the HANES dietarystandards committee for children 24—47 months weighing the sample mean of 15.5kilograms.computed in HANES, the poverty index ratio takesaccountof householdincome, household size, and household diet requirements as reflected by the agedistribution of the household members.
-7F—2Adjusted R2,s increased by less than .01 when the socioeconomic variableswere added to either height, weight, or head size regressions that already contained age, the square of age, sex, parent's height, birthweight and birthorder.It should also be pointed out that the limited significance of the socioeconomicvariables does not appear to be due to colinearity with the genetic and parentaltrait variables. The t—values of the socioeconomic variables do not increasemarkedly even when the genetic and parental trait variables are excluded fromthe children's growth equations.8The results for the colds variable are also presented in Table 4 but arenot discussed in the text. Household income and education of the householdhead are inversely related to the number of children's colds while protein andvitamin C intakes do not have statistically significant impacts.9Because the growth equations formed part of a simultaneous system traditional F tests could not be employed to test the individual and joint contribu-tions of the protein and calorie variables. Results from OLS regressions indicate that protein makes a significant incremental contribution to explainingthe variance in height and head growth when added to regressions containingthe other independent variables, while calories does not. When both dietvariables are added jointly to height and head growth regressions the incre—mental contribution is insignificant. For the weight equation, the incrementalcontribution to explained variance is significant when the trotein and calorievariables are entered individually or jointly to regressions contaning theother independent variables.
F—310Predicted protein and the square of predicted protein were enteredas independent variables in the height and head circumference equations inthe final stage of a two—stage least squares process. No evidence of a non—linear orotein effect was uncovered.
R-].REFERENCESChase, A. "Poverty andLow IQ: TheVicious Circle," NewYork Times BookReview, July 17, 1977, p. 9.Chernichovsky,Dov, andchildren a
052—26556 Newark, NJ 07102 (201) 648—5940 National Bureau of Economic Research 15—19 West 4th Street, 8th Fir. Washington Square New York, NY 10012 (212)598—7045. An Economic Analysis of the Diet, Growth, and Health of Young Children in the United States . The child's health status is a function of his diet, growth and otherinuts which