Transcription
JUNE 2021ISSUE BRIEFAUTHORS:The Effectiveness and Adequacyof the Supplemental NutritionAssistance Program (SNAP)in Reducing Food InsecurityDuring an Economic DownturnJane L. Tavares, Ph.D.,Marc A. Cohen, Ph.D.,LeadingAge LTSS Center@ UMass BostonSusan Silberman, Ph.D.,Lauren Popham, Ph.D.,National Council on AgingLearnings from the Great Recession of 2008In a recent data brief, we analyzed the impacts of the 2008 Great Recession on food insecurityamong older adults age 60 and over. We observed in this previous study that the SupplementalNutrition Assistance Program (SNAP) was an integral part of combatting food insecurity duringan economic downturn. The recently passed American Rescue Plan includes roughly 12 billionin new funding allocated to food assistance programs. Making additional resources available at this timeis not surprising given the dramatic increase in the number of households that have struggled duringthe COVID-19 pandemic to feed their families. In fact, the Census Bureau’s Household Pulse Survey,launched in April 2020, showed that in March 2021 roughly 11% of all U.S. adults with children and7% of those without reported that their household sometimes or often did not have enough to eat in thelast seven days. This represents a three-fold increase from pre-pandemic levels and is equivalentto roughly 22 million adults as well as more than 10 million children who live in households thatcannot afford to buy enough food to eat. The negative impacts of food insecurity on health and otheroutcomes are well documented, as are the long-term negative impacts, which is why it is imperative toaddress this issue.Much of the 12 billion investment is allocated to increasing SNAP. For example, the maximum benefitis being increased by up to 15% above what had been established in December 2020 — a 100increase per month for a family of four. It is important to note that even in the context of these additionalinvestments, SNAP benefits have been modest. For example, according to the U.S. Department ofAgriculture (USDA) the average SNAP household received about 246 a month in fiscal year 2020,which is equivalent to an average benefit of about 125 per month per person and works out to about 1.39 per person per meal. In addition to benefit increases, monies are also devoted to additionalemergency SNAP assistance benefits, strengthening administration of the program, and to assuringaccess to the program by particularly disadvantaged populations, including racial and ethnic minorities.Clearly, the primary underlying goal of the policy is to reduce food insecurity. Experience from the lastmajor economic downturn may be particularly instructive in identifying whether and how reported foodinsecurity is likely to be changed by this investment in the SNAP program and whether program benefitssupport a level of food consumption deemed to be adequate to support good nutrition.1
PurposeIn this data brief, we present information on the impact of SNAP on food insecurity during the 2008 GreatRecession. Our purpose is to explore the role of SNAP during the most recent economic downturn to betterunderstand the effectiveness and adequacy of the program in regard to how it may mitigate food insecurityamong older adults as a result of the COVID-19 pandemic. We analyzed the nationally representative,longitudinal data in the Health and Retirement Study (HRS) from 2006 to 2018 to assess the pre- andpost-recession impacts of SNAP on food insecurity for individuals age 60 and over (N 12,401) and furtherexamine the adequacy of SNAP benefits in comparison to food budgets set by the USDA.MethodWe investigated the impact of SNAP during the 2008 economic downturn by observing patterns of foodinsecurity and skipped meals among individuals who had not reported any SNAP utilization pre-recession(2006 to 2008) and who then began utilizing SNAP during the recession impact period (2008 to 2012). Wealso employed longitudinal regression analyses to understand the effect of SNAP on food insecurity andthe probability of skipping meals, after taking account of other factors that could influence food insecurity.Specifically, we controlled for the following demographic, financial, and health characteristics: age, gender,race/ethnicity, marital status, education, net value of total wealth, poverty status, retirement status, selfreported health, chronic conditions, activities of daily living limitations (ADLs), instrumental activities of dailyliving limitations (IADLs), body mass index (BMI), and Medicare, Medicaid, and Dual-Eligibility status.To explore the adequacy of SNAP benefits, we determined SNAP eligibility for individuals age 60 and olderin the HRS sample and then calculated the monthly SNAP benefit amount based on the standard federalSNAP eligibility and benefit criteria. We then compared SNAP users’ monthly benefit amount to the USDAfood budget plan which sets a nutritious diet standard at four different monthly cost levels by age andhousehold size. Specifically, we investigated the percentage of SNAP users in the HRS sample whosemonthly benefit was below the lowest amount set in the USDA’s monthly food budget plans1 from 2006 to2018 (e.g. USDA ‘Thrifty Plan’ in 2018 was 165 for singles, 365 for couples).1The USDA sets budgetary food plans that represent a nutritious diet at four different cost levels by age and householdsize. According to the USDA, the nutritional bases of the food plans come from the Dietary Reference Intakes, DietaryGuidelines for Americans, and MyPyramid food intake recommendations. The food plans take into account cost differencesin specific foods and quantities of foods and are based on all meals being prepared at home. Food plans are updated overtime to reflect current dollar value by using the Consumer Price Index for specific food items. The four USDA food plan costlevels are as follows: Thrifty, Low-Cost, Moderate-Cost, and Liberal Food Plans.2
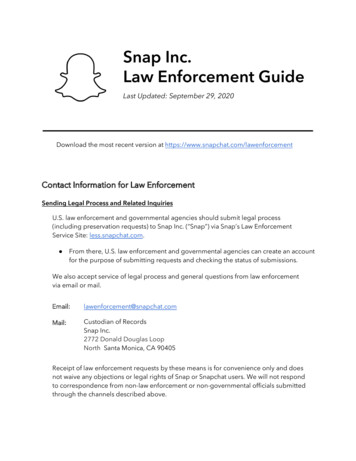
FindingsFigure 1 shows that for those who did not report any SNAP use pre-recession (2006 to 2008) andeventually used SNAP during the recession period (2008 to 2012), both food insecurity and skippingmeals peaked around the time that SNAP utilization was first reported. In fact, during the period beforeSNAP utilization began, food insecurity increased by 51% and skipping meals increased by 56%.Following up two years after the initial report of SNAP use, both food insecurity and skipping mealsdropped down and approached, although never completely declined to, pre-recession/pre-SNAPutilization levels. These patterns suggest that SNAP had a very positive impact on reducing foodinsecurity and skipping meals during the recession and this is consistent with prior research lookinginto SNAP enhancements during the 2008 recession. Given these findings, we further employedlongitudinal regression models to isolate the independent effect of SNAP utilization on food insecurityand skipping meals while controlling for key demographic, health, and financial characteristics that alsoinfluence food insecurity.FIGURE 1. Reported Food Insecurity & Skipped Meals for SNAP Users Age 60 fromPre- to Post-Recession (2006 to 2014)3
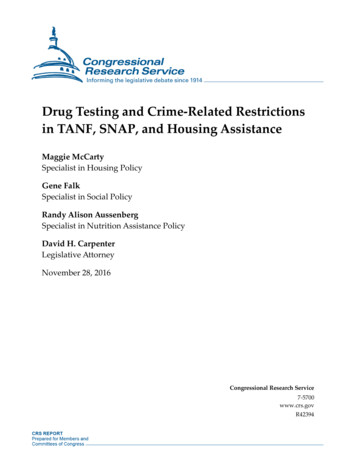
Table 1 presents the results of an ordinary least squares (OLS) regression analysis which examinedthe association between the number of years of reported food insecurity and the number of years ofreported SNAP utilization for those age 60 and older during the full study period (2006 to 2018). Apositive coefficient (B) means that having the characteristic is associated with more years of reportedfood insecurity and a negative coefficient (B) means the effect is to reduce the number of years offood insecurity. The findings showed that every one year of reported SNAP use was associated with6.6 months less time of reported food insecurity during the study period (B -0.55, p 0.001). As well,being among younger older adults (age 60 and over), female, Non-Hispanic Black, Hispanic, below theFederal Poverty Line (FPL), and in poorer health with greater chronic conditions and physical limitationswere significantly associated with higher reported years of food insecurity.TABLE 1. OLS Regression: Association between Years of Food Insecurity and Years of SNAPUtilization from 2006 to 2018 for Individuals Age 60 and olderN 10,925Covariates (measured in 2006)BSE Bp-valueYears of SNAP Use 2006 to 2018-0.55*0.010.00Age ic c Other0.120.180.60Married-0.080.060.20Education (Years)-0.02*0.010.01Net Total Wealth elf-Reported Fair/Poor Health0.31*0.080.00Chronic Conditions0.10*0.020.00Body Mass Index (BMI)0.010.010.96Activities of Daily Living Limitations(ADLs)0.24*0.060.00Instrumental Activities of Daily LivingLimitations (IADLs)0.11*0.040.03Medicare Only0.20*0.060.00Medicaid Only1.030.900.31Dual Eligible0.200.150.20Below Federal Poverty Level (FPL)Retired*Significant at p 0.054
Table 2 presents the results of a logistic regression analysis, which examines the predictors of skippingmeals among those 60 and older who reported food insecurity during the recession period (2008 to2012). Specifically, we investigate the effect of using SNAP benefits during this same period on skippingmeals — a proxy measure for the severity of food insecurity. We find that food insecure older individualswho utilized SNAP during the recession period had 42% lower odds of skipping meals. Also notablewas that food insecure individuals who were Non-Hispanic Black, Hispanic, and/or below the FPL wereapproximately 1.2 times more likely to skip meals compared to Whites or those living above the FPL.Taken together, these results present compelling evidence that SNAP has a significant impact onreducing both food insecurity and skipping meals during an economic downturn. Given the demonstratedimportance of SNAP in buffering the effects of a recession, it is critical to explore whether the program isdoing so adequately and evaluate whether there is need for increased benefit amounts and greater takeup rates among older adults.TABLE 2. Logistic Regression: Association between Skipping Meals and SNAP Usage duringthe Recession Period (2008 to 2012) for Individuals Age 60 and olderN 8,197Covariates (measured in 2006)Odds Ratiop-valueAny SNAP Use 2008 to 20120.58*0.00Age (Years)0.95*0.00Female1.050.77Non-Hispanic Black1.25*0.04Hispanic1.16*0.04Non-Hispanic Other1.200.68Married0.830.26Education (Years)0.970.13Net Total Wealth (logged)0.94*0.04Below Federal Poverty Level (FPL)1.22*0.02Retired0.770.08Self-Reported Fair/Poor Health1.040.82Chronic Conditions1.12*0.03Body Mass Index (BMI)1.020.07Activities of Daily Living Limitations (ADLs)1.13*0.02Instrumental Activities of Daily LivingLimitations (IADLs)1.12*0.04Medicare Only1.010.94Medicaid Only1.050.93Dual Eligible0.750.22*Significant at p 0.055
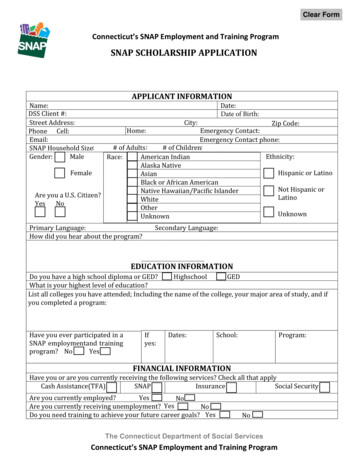
Figure 2 presents the percentage of SNAP users age 60 and older whose monthly SNAP benefits werebelow the lowest monthly food budget for nutritious eating as determined by the USDA (i.e., ThriftyBudget) from 2006 to 2018. In 2006, 61% of older SNAP users did not have benefits that met the lowestUSDA food budget, and this percentage has steadily grown over the years. In 2018, 85% of olderSNAP users’ benefits were below the lowest USDA food budget — a 39% increase from 2006 to 2018,suggesting a major erosion in the value of the benefit.These findings suggest that while SNAP plays a significant role in reducing food insecurity and skippedmeals among older adults, the program is not adequately keeping up with rising food costs over time.The maximum federal monthly SNAP benefit for older adults in 2021 is 204 for single householdsand 374 for coupled households. When compared to the 2021 USDA Thrifty Plan monthly food budget( 173 for single households; 382 for coupled households), the maximum SNAP benefits are only slightlyabove the lowest USDA budget for singles and actually below the USDA budget for couples. This isconcerning in light of that fact that many older adults do not qualify for the maximum SNAP benefit andthat even the maximum SNAP benefit barely meets the lowest possible food budget for a nutritious dietset by the USDA. In fact, the most recently available SNAP data for older adults showed an averagemonthly SNAP benefit of 104 per older adult living alone in 2019 when the USDA monthly Thrifty Planbudget per older adult in 2019 was 166.FIGURE 2. Percentage of SNAP Users Age 60 with Monthly Benefit Amounts Below theUSDA ‘Thrifty Plan’ Budget (2006 to 2018)6
ConclusionsThe results of our analysis reinforce previous work that shows just how important the SNAP program canbe for reducing food insecurity. Here we have quantified that impact in terms of its influence on the reportedduration of food insecurity. And it is significant — cutting off more than half a year. Yet, even in the presenceof the program, if the real value of benefits is not adjusted to account for the increasing cost of food, thenas a society we will not be able to guarantee that the most vulnerable among us will be able to accessnutritious food. The approach of the American Rescue Plan recognizes this by significantly increasingbenefit values. However, many of the supplemental benefits under the Plan are set to expire in a year.Thus, unless the benefits are made permanent and adjusted to account for food costs over time, the overalleffectiveness of the program will diminish. We have the evidence that this will likely be the result by lookingat the experience of the last great economic downturn: rates of food insecurity after the 2008 recessionnever returned to their pre-recession levels. After the terrible and disproportionate price paid by olderAmericans during the current pandemic, we need to assure that history does not repeat itself and that thelessons of 2008 inform our policies going forward.About NCOAThe National Council on Aging (NCOA) is the national voice for every person’s right to age well.NCOA empowers individuals with trusted solutions to improve their own health and economicsecurity — and protects and strengthens federal programs that people depend on as they age.Working with a nationwide network of partners, NCOA’s goal is to improve the lives of 40 millionolder adults by 2030. Learn more at ncoa.org and @NCOAging. 2021 National Council on Aging.All rights reserved.7
2018 (e.g. USDA 'Thrifty Plan' in 2018 was 165 for singles, 365 for couples). 1 The USDA sets budgetary food plans that represent a nutritious diet at four different cost levels by age and household size. According to the USDA, the nutritional bases of the food plans come from the Dietary Reference Intakes, Dietary