Transcription
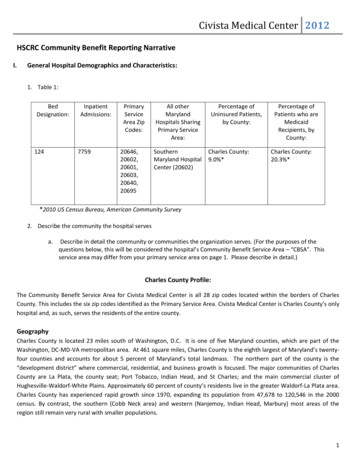
Volume 62, Number 9December 30, 2013Births: Final Data for 2012by Joyce A. Martin, M.P.H.; Brady E. Hamilton, Ph.D.; Michelle J.K. Osterman, M.H.S.; Sally C. Curtin, M.A.; andT.J. Mathews, M.S., Division of Vital StatisticsAbstractObjectives—This report presents 2012 data on U.S. birthsaccording to a wide variety of characteristics. Data are presentedfor maternal age, live-birth order, race and Hispanic origin, maritalstatus, attendant at birth, method of delivery, period of gestation,birthweight, and plurality. Birth and fertility rates are presented byage, live-birth order, race and Hispanic origin, and marital status.Selected data by mother’s state of residence and birth rates by ageand race of father also are shown. Trends in fertility patterns andmaternal and infant characteristics are described and interpreted.Methods—Descriptive tabulations of data reported on thebirth certificates of the 3.95 million births that occurred in 2012 arepresented.200180160Rate per 100,000 921994NOTE: Triplet/ births are births in triplet and higher-order multiple deliveries.SOURCE: CDC/NCHS, National Vital Statistics System.Figure 1. Triplet/ birth rates: United States, 2
2National Vital Statistics Reports, Vol. 62, No. 9, December 30, 2013Results—A total of 3,952,841 births were registered in theUnited States in 2012. The general fertility rate declined to 63.0 per1,000 women aged 15–44. The teen birth rate fell 6%, to 29.4 per1,000 women. Birth rates declined for women in their twenties andincreased for women aged 30–44. The total fertility rate (estimatednumber of births over a woman’s lifetime) declined 1% to 1,880.5per 1,000 women. The rate of births to unmarried women declined;the percentage of births to unmarried women was essentially stableat 40.7%, but the number of births to unmarried women increasedslightly. The cesarean delivery rate was unchanged at 32.8%. Thepreterm birth rate declined for the sixth straight year to 11.55%; thelow birthweight rate declined slightly to 7.99%. The twin birth ratewas stable at 33.1 per 1,000 births; the rate of triplet and higherorder multiple births dropped 9% to 124.4 per 100,000 total births.Keywords: birth certificate maternal and infant health birth rates maternal characteristicsHighlights A total of 3,952,841 births were registered in the United Statesin 2012, slightly fewer births (749) than in 2011. Births declined1% for non-Hispanic white and Hispanic women and wereessentially unchanged for non-Hispanic black women from2011 to 2012.The 2012 general fertility rate declined to 63.0 births per 1,000women aged 15–44, another historic low for the United States.The total fertility rate declined 1%, to 1,880.5 births per 1,000women in 2012.The birth rate for teenagers aged 15–19 dropped 6% from 2011to 2012, to 29.4 per 1,000—the lowest rate ever reported forthe United States. Rates were down for age groups 15–17 and18–19, and for nearly all race and Hispanic origin groups.Birth rates declined among women in their early twentiesbetween 2011 and 2012 to a record low. The rate was alsodown for women aged 25–29, but it increased for women aged30–44. Birth rates for the youngest (under age 15 years) and theoldest (aged 45 and over) mothers were unchanged.The mean age of mother at first birth rose again, to 25.8 yearsin 2012, up from 25.6 years in 2011.The 2012 U.S. cesarean delivery rate was unchanged at 32.8%.The cesarean rate rose nearly 60% from 1996 to 2009, declinedslightly from 2009 to 2010, and has been stable since.The birth rate for unmarried women fell for the fourthconsecutive year in 2012 to 45.3 per 1,000 unmarried womenaged 15–44. The percentage of births to unmarried women wasunchanged from 2011 at 40.7%, but the number of nonmaritalbirths increased slightly, by less than 1%, to 1,609,619.The preterm birth rate (less than 37 weeks) declined for thesixth straight year, to 11.55% of all births in 2012, down 2%from 2011 and 10% from the 2006 peak. Rates declined fornon-Hispanic white and non-Hispanic black births and for mostmaternal age groups from 2011 to 2012.The 2012 rate of low birthweight (less than 2,500 grams) was7.99%, down slightly from 2011 (8.10%) and 3% lower than the2006 high (8.26%).The 2012 twin birth rate was 33.1 per 1,000 total births andwas essentially unchanged from 2009–2011. The triplet andhigher-order multiple birth rate (triplet/ ) dropped 9% in 2012to 124.4 per 100,000 births and is down by more than one-thirdsince the high in 1998 (193.5); see Figure 1.IntroductionThis report presents detailed data on numbers and characteristicsof births in 2012, birth and fertility rates, maternal demographicand health characteristics, place and attendant at birth, and infanthealth characteristics. A report of preliminary birth statistics for 2012presented data on selected topics based on a substantial sample(99.96%) of 2012 births (1). In addition to the tabulations includedin this report, more detailed analysis is possible by using the natalitypublic-use file issued each year. The data file may be downloadedfrom http://www.cdc.gov/nchs/data access/Vitalstatsonline.htm (2).The public-use file does not include geographic detail; a file with thisinformation may be available upon special request (3). A data accessand analysis tool, VitalStats, is also available from http://www.cdc.gov/nchs/VitalStats.htm (4). VitalStats includes birth data for 1990through 2012, with access to interactive, prebuilt tables. Users alsocan build tables using more than 100 variables from the natalitypublic-use files and geographic information by state and for countieswith populations of 100,000 or more.1989 and 2003 revisions of U.S. StandardCertificate of Live BirthThis report includes 2012 data on items that are collected onboth the 1989 revision of the U.S. Standard Certificate of Live Birth(unrevised) and the 2003 revision of the U.S. Standard Certificateof Live Birth (revised). The 2003 revision is described in detailelsewhere (5,6).Thirty-eight states, the District of Columbia (DC), and threeterritories implemented the revised birth certificate as of January1, 2012. The 38 revised states and DC represent 86% of all 2012U.S. births. The revised reporting areas are: California, Colorado,Delaware, DC, Florida, Georgia, Idaho, Illinois, Indiana, Iowa, Kansas,Kentucky, Louisiana, Maryland, Massachusetts, Michigan, Minnesota,Missouri, Montana, Nebraska, Nevada, New Hampshire, New Mexico,New York, North Carolina, North Dakota, Ohio, Oklahoma, Oregon,Pennsylvania, South Carolina, South Dakota, Tennessee, Texas,Utah, Vermont, Washington, Wisconsin, Wyoming, Guam, NorthernMarianas, and Puerto Rico. One state, Virginia, implemented therevised birth certificate in 2012, but after January 1.This report presents information on selected data itemscomparable between the 1989 and 2003 birth certificate revisions.Information on topics comparable between revisions but not presentedin this report (e.g., day of birth, month of birth, and congenitalanomalies) can be found in the Internet tables (see “List of InternetTables”) and in the “User’s Guide” public-use file for each data year(2). Recent reports and data releases present information on itemsnot previously available from the National Center for Health Statistics(e.g., use of infertility therapies, WIC food, source of payment for thedelivery, maternal morbidity, and breastfeeding) for 2009, 2010, and2011 (7–11). A recent report also assesses the quality of the 2003revised medical and health birth certificate data (12).
3National Vital Statistics Reports, Vol. 62, No. 9, December 30, 2013MethodsData shown in this report are based on 100% of the birthcertificates registered in all states and DC. More than 99% of birthsoccurring in this country are registered (13). Tables showing databy state also provide separate information for Puerto Rico, VirginIslands, Guam, American Samoa, and Commonwealth of the NorthernMarianas. These areas, however, are not included in totals for theUnited States.Race and Hispanic origin are reported independently on thebirth certificate. In tabulations of birth data by race and Hispanicorigin, data for Hispanic persons are not further classified by racebecause the majority of women of Hispanic origin are reported aswhite. Most tables in this report show data for the categories of nonHispanic white, non-Hispanic black, and Hispanic. Data for births arealso presented in some tables for American Indian or Alaska Native(AIAN) and Asian or Pacific Islander (API); for specific Hispanic groupsMexican, Puerto Rican, Cuban, and Central and South American; andfor other and unknown Hispanic. Data for AIAN and API births arenot shown separately by Hispanic origin because the majority ofthese populations are non-Hispanic. Text references to black birthsand black mothers or to white births and white mothers are usedinterchangeably for ease in writing; see Technical Notes.The 2003 revision of the U.S. Standard Certificate of Live Birthallows the reporting of more than one race (multiple races) for eachparent (5) in accordance with the revised standards issued by theOffice of Management and Budget (OMB) in 1997 (14). See TechnicalNotes and the “User Guide” (13) for detailed information on the 2012multiple-race reporting area and methods used to bridge responsesto a single race for those who report more than one race.In this report, the total number of births includes births towomen up to age 64. In tables that include age of mother, the oldestage group shown (40–54, 45–49, 45–54, or 50–54) includes birthsto mothers up to age 64. For information on levels of incompletereporting by state, see Technical Notes and the “User Guide” (13). Forinformation on the measurement of data items shown in this reportand the Internet tables, imputation techniques used, computation ofderived statistics, and definitions of terms, see the “User Guide” (13).Birth and fertility rates for specific Hispanic population groups(Mexican, Puerto Rican, Cuban, Central and South American, andother Hispanic populations) for 2010–2012 are based on populationestimates derived from the American Community Survey (ACS),conducted by the U.S Census Bureau. Rates for specific Hispanicpopulation groups prior to 2010 are based on population estimatesderived from the Current Population Survey (CPS). For moreinformation about the populations for Hispanic groups, see TechnicalNotes and the 2011 “User Guide” (13).Demographic CharacteristicsBirths and birth ratesA total of 3,952,841 births were registered in the United Statesin 2012, 749 fewer than in 2011 (3,953,590) (Tables 1 and 5; Figure2). From 2007 through 2011, the number of births declined, fallingsteadily from 2007 through 2010, but the downward pace slowedfrom 2010 to 2012 (1).Among the three largest race and Hispanic origin groups, thenumber of births declined less than 1% for non-Hispanic black2005180Number160Births in 9601970198019902000YearNOTE: Beginning with 1959, trend lines are based on registered live births; trend lines for 1920–1958 are based on live births adjusted for underregistration.SOURCE: CDC/NCHS, National Vital Statistics System.Figure 2. Live births and general fertility rates: United States, 1920–201220120Rate per 1,000 women aged 15–444
4National Vital Statistics Reports, Vol. 62, No. 9, December 30, 2013women and 1% for non-Hispanic white and Hispanic women from2011 to 2012. The number of births also declined for AIAN women(1%) but rose 7% for API women. Among the specified Hispanicgroups, births declined less than 1% for Puerto Rican women and2%–3% for Cuban, Mexican, and Central and South American womenbetween 2011 and 2012.Fertility rateThe 2012 general fertility rate (GFR) for the United States was63.0 births per 1,000 women aged 15–44, down slightly (less than1%) from the record low rate reported for the country in 2011 (63.2)(Tables 1 and 5; Figure 2). As with the number of births, the fertilityrate declined steadily from 2007 through 2010, but the pace of thedecline slowed from 2010 to 2012 (1).The GFR declined for the three largest race and Hispanic origingroups from 2011 to 2012, down less than 1% for non-Hispanicwhite, 1% for non-Hispanic black, and 2% for Hispanic women.The GFR also declined for AIAN women (1%). However, the rate forAPI women rose by 4%. Among the specified Hispanic groups, therate for Mexican women fell 3% from 2011 to 2012, whereas ratesfor Puerto Rican, Cuban, and other Hispanic women (Central andSouth American and unspecified Hispanic groups) were essentiallyunchanged.Age of motherTeenagers—The teenage birth rate was 29.4 births per 1,000women aged 15–19 in 2012, another historic low for the country anddown by 6% from 2011 (31.3) (Tables A, 3, 4, 7, and 8; Figures 3 and17515018–19Rate per 1,000 women1251007515–195015–17254) (15–18). This rate has fallen by over one-half since 1991 (61.8),when the long-term decline in births to teenagers began (15). From2011, the number of births to teenagers aged 15–19 declined 7% to305,388 in 2012, the lowest number since 1945 (280,997) and 41%lower than in 1991 (519,577).Birth rates for teenagers aged 15–17 and 18–19 were 14.1births per 1,000 for the younger teenagers and 51.4 births per 1,000for the older teenagers in 2012, down 8% and 5%, respectively, from2011. Record lows were reached for both younger (15–17) and older(18–19) teenagers. Since 1991, the rate for teenagers aged 15–17has fallen 63%, and the rate for teenagers aged 18–19 has fallen45%. The birth rate for the youngest teenagers, aged 10–14, wasunchanged (0.4 births per 1,000 in 2012).Among racial and ethnic groups, rates for teenagers aged 15–19declined for all groups from 2011 to 2012, with declines ranging from3% for AIAN teenagers to 5% for API, and 6%–7% for non-HispanicTable A. Birth rates for women aged 10–19, by age and raceand Hispanic origin of mother: United States, 2011 and 2012[Rates per 1,000 women in specified age and race and Hispanic origin group.Population based on counts enumerated as of July 1]YearAge (years) and race andHispanic origin of mother20122011Percentchange10–14All races and origins1 . . . . . . . . . . . . . . . . . . . . .Non-Hispanic white2 . . . . . . . . . . . . . . . . . . . . . .Non-Hispanic black2 . . . . . . . . . . . . . . . . . . . . . .American Indian or Alaska Native total2,3 . . . . . . .Asian or Pacific Islander total2,3 . . . . . . . . . . . . . .Hispanic4 . . . . . . . . . . . . . . . . . . . . . . . . . . . . . �†–1415–19All races and origins1 . . . . . . . . . . . . . . . . . . . . .Non-Hispanic white2 . . . . . . . . . . . . . . . . . . . . . .Non-Hispanic black2 . . . . . . . . . . . . . . . . . . . . . .American Indian or Alaska Native total2,3 . . . . . . .Asian or Pacific Islander total2,3 . . . . . . . . . . . . . .Hispanic4 . . . . . . . . . . . . . . . . . . . . . . . . . . . . . �6–6–7–3–5–715–17All races and origins1 . . . . . . . . . . . . . . . . . . . . .Non-Hispanic white2 . . . . . . . . . . . . . . . . . . . . . .Non-Hispanic black2 . . . . . . . . . . . . . . . . . . . . . .American Indian or Alaska Native total2,3 . . . . . . .Asian or Pacific Islander total2,3 . . . . . . . . . . . . . .Hispanic4 . . . . . . . . . . . . . . . . . . . . . . . . . . . . . ��7–11–7–11–918–19All races and origins1 . . . . . . . . . . . . . . . . . . . . .Non-Hispanic white2 . . . . . . . . . . . . . . . . . . . . . .Non-Hispanic black2 . . . . . . . . . . . . . . . . . . . . . .American Indian or Alaska Native total2,3 . . . . . . .Asian or Pacific Islander total2,3 . . . . . . . . . . . . . .Hispanic4 . . . . . . . . . . . . . . . . . . . . . . . . . . . . . ��5–5–6††–5†Difference not statistically significant.011960197019801990Year20002012SOURCE: CDC/NCHS, National Vital Statistics System.Figure 3. Birth rates for teenagers aged 15–19, by age:United States, 1960–2012Includes births to race and origin groups not shown separately, such as white-Hispanic andblack-Hispanic women, and births with origin not stated.2Race and Hispanic origin are reported separately on birth certificates. Persons of Hispanic originmay be of any race. Race categories are consistent with the 1977 Office of Management andBudget standards. Forty-one states and the District of Columbia reported multiple-race datafor 2012 that were bridged to single-race categories for comparability with other states; seeTechnical Notes. Multiple-race reporting areas vary for 2011 and 2012; see Technical Notes.3Includes persons of Hispanic and non-Hispanic origin and origin not stated, according to themother’s reported race; see Technical Notes.4Includes all persons of Hispanic origin of any race; see Technical Notes.
National Vital Statistics Reports, Vol. 62, No. 9, December 30, 2013white, non-Hispanic black, and Hispanic teenagers. Birth rates forteenagers aged 15–17 also declined for all racial and ethnic groupsin 2012; rates for ages 18–19 were down for all groups except forAIAN and API.Women in their twenties—The birth rate for women aged20–24 in 2012 was 83.1 births per 1,000 women in this age group,down 3% from 2011 (85.3) and a record low for the United States(Tables 3, 4, 7, 8, and 12; Figure 4). The rate for women in this agegroup has declined steadily since 2007 at nearly 5% annually. Thenumber of births to women in their early twenties declined 1% from2011 to 2012, whereas their population rose 2% (17). The rate forwomen aged 25–29 was 106.5 births per 1,000 women, down 1%from 2011 (107.2). The rate for women in this age group has declined2% a year since 2008. The number of births to women in their latetwenties also declined in 2012, down slightly (less than 1%) from2011, whereas their population rose slightly (less than 1%).Women in their thirties—The birth rate for women aged 30–34 was 97.3 births per 1,000 women in 2012, up 1% from 2011(96.5). Both the number of births and the population of women inthis age group increased in 2012, by 3% and 2%, respectively. Thebirth rate for women aged 35–39 was 48.3 births per 1,000 womenin 2012, up 2% from the 2011 rate (47.2). The number of births towomen aged 35–39 rose 2% in 2012, whereas the population ofwomen in this age group declined 1% (Tables 2, 6, and II) (17).Women in their forties—The birth rate for women aged 40–44was 10.4 births per 1,000 women in 2012, up 1% from 2011 (10.3)(Tables 4 and 8). The rate for women in this age group has risensteadily since 2000 (8.0) by 2% annually (Figure 4). The numberof births to women in their early forties rose 1%, whereas their20020025–2910010020–2430–34Rate per 1,000 women505035–3915–1940–441010555population was essentially unchanged. The birth rate for womenaged 45–49 (which includes births to women aged 50 and over)was 0.7 births per 1,000 women in 2012, unchanged since 2008.Births to women aged 45–49 declined 6% from 2011 to 2012, andthe population for these women declined 2%. The increase in birthrates for women aged 35 and over during the last 20 years has beenlinked, in part, to the use of fertility-enhancing therapies (19).Women aged 50 and over—Six hundred births occurred towomen aged 50 and over in 2012, compared with 585 births in 2011(Tables 2 and 6) (17). Since 1997, when data for women aged 50 andover became available again, the number of births to women in thisage group has generally increased (from 144 births). In 2012, thebirth rate for women aged 50–54 was 0.5 births per 10,000 women,unchanged since 2006 (data not shown in tables). Because of thesmall number of births to women in this age group, the birth ratefor women aged 50–54 is expressed per 10,000 women. For ratesshown elsewhere in this report, births to women aged 50 and overare included with births to women aged 45–49 when computing birthrates by age of mother (the denominator for the rate is women aged45–49).Live-birth orderThe 2012 first-birth rate for the United States was 25.2 birthsper 1,000 women aged 15–44, 1% less than the rate in 2011 (25.4)(Tables 3, 7, and 9). First-birth rates declined for women aged 15–19,20–24, and 25–29 (by 5%, 2%, and 1%, respectively), whereas ratesfor women aged 30–34 and 35–39 rose (2% and 3%, respectively).The rates for women aged 10–14 and 40 and over were unchanged.Another useful measure for interpreting childbearing patternsis the mean age at first birth, which is the arithmetic average of theage of mothers at the time of birth and is computed directly from thefrequency of first births by age of mother. In 2012, the mean age ofmother was 25.8 years, up from 25.6 years in 2011 and from 21.4years in 1970 (Tables 13, 14, and I–1) (18,20,21). The increase inthe mean age in 2012 reflects, in part, the relatively large decline inbirths to women in their teen years and their twenties.Mean age at first birth varied by race and Hispanic origin in2012, from 22.5 years for AIAN women to 29.3 years for API women.The average ages at first birth for the three largest race and Hispanicorigin groups were 23.6 years for non-Hispanic black, 23.8 years forHispanic, and 26.6 years for non-Hispanic white women (Tables 13and 14). Among the specified Hispanic groups, average ages rangedfrom 23.2 years for Mexican women to 26.6 years for Cuban women.Average age at first birth increased for women in nearly all race andHispanic origin groups in 2012.Total fertility rate119901995200020052012YearNOTE: Rates are plotted on a logarithmic scale.SOURCE: CDC/NCHS, National Vital Statistics System.Figure 4. Birth rates, by selected age of mother:United States, 1990–20121The 2012 total fertility rate (TFR) for the United States was1,880.5 births per 1,000 women, 1% below the 2011 rate (1,894.5)(Tables 4, 8, 13, and 14). After generally increasing from 1998 through2007, the TFR has declined for each of the last 5 years. The TFRestimates the number of births that a hypothetical group of 1,000women would have over their lifetimes, based on age-specific birthrates in a given year. Because it is computed from age-specific birthrates, the TFR is age-adjusted, and can be compared for populationsacross time, population groups, and geographic areas.
6National Vital Statistics Reports, Vol. 62, No. 9, December 30, 2013Table B. Birth rates for teenagers aged 15–19: United States,each state, and territory, 2011 and 2012[By place of residence. Birth rates per 1,000 estimated female population aged15–19. Population estimated as of July 1]AreaUnited States1 . . . . . . . . . . . . . . . . . . .201229.4201131.3Percentchange–6Alabama . . . . . . . . . . . . . . . . . . . . .Alaska . . . . . . . . . . . . . . . . . . . . . . .Arizona . . . . . . . . . . . . . . . . . . . . . .Arkansas . . . . . . . . . . . . . . . . . . . . .California . . . . . . . . . . . . . . . . . . . .Colorado . . . . . . . . . . . . . . . . . . . . .Connecticut . . . . . . . . . . . . . . . . . . .Delaware . . . . . . . . . . . . . . . . . . . .District of Columbia. . . . . . . . . . . . .Florida . . . . . . . . . . . . . . . . . . . . . .Georgia . . . . . . . . . . . . . . . . . . . . . .Hawaii. . . . . . . . . . . . . . . . . . . . . . .Idaho . . . . . . . . . . . . . . . . . . . . . . .Illinois . . . . . . . . . . . . . . . . . . . . . . .Indiana . . . . . . . . . . . . . . . . . . . . . .Iowa . . . . . . . . . . . . . . . . . . . . . . . .Kansas . . . . . . . . . . . . . . . . . . . . . .Kentucky . . . . . . . . . . . . . . . . . . . . .Louisiana . . . . . . . . . . . . . . . . . . . .Maine . . . . . . . . . . . . . . . . . . . . . . .Maryland. . . . . . . . . . . . . . . . . . . . .Massachusetts . . . . . . . . . . . . . . . .Michigan . . . . . . . . . . . . . . . . . . . . .Minnesota . . . . . . . . . . . . . . . . . . . .Mississippi . . . . . . . . . . . . . . . . . . .Missouri . . . . . . . . . . . . . . . . . . . . .Montana . . . . . . . . . . . . . . . . . . . . .Nebraska . . . . . . . . . . . . . . . . . . . .Nevada . . . . . . . . . . . . . . . . . . . . . .New Hampshire . . . . . . . . . . . . . . .New Jersey . . . . . . . . . . . . . . . . . . .New Mexico . . . . . . . . . . . . . . . . . .New York. . . . . . . . . . . . . . . . . . . . .North Carolina . . . . . . . . . . . . . . . . .North Dakota . . . . . . . . . . . . . . . . . .Ohio . . . . . . . . . . . . . . . . . . . . . . . .Oklahoma . . . . . . . . . . . . . . . . . . . .Oregon . . . . . . . . . . . . . . . . . . . . . .Pennsylvania . . . . . . . . . . . . . . . . . .Rhode Island . . . . . . . . . . . . . . . . . .South Carolina . . . . . . . . . . . . . . . .South Dakota . . . . . . . . . . . . . . . . .Tennessee. . . . . . . . . . . . . . . . . . . .Texas . . . . . . . . . . . . . . . . . . . . . . .Utah . . . . . . . . . . . . . . . . . . . . . . . .Vermont . . . . . . . . . . . . . . . . . . . . .Virginia . . . . . . . . . . . . . . . . . . . . . .Washington . . . . . . . . . . . . . . . . . . .West Virginia . . . . . . . . . . . . . . . . . .Wisconsin . . . . . . . . . . . . . . . . . . . .Wyoming. . . . . . . . . . . . . . . . . . . . uerto Rico . . . . . . . . . . . . . . . . . . .Virgin Islands . . . . . . . . . . . . . . . . .Guam . . . . . . . . . . . . . . . . . . . . . . .American Samoa . . . . . . . . . . . . . . .Northern Marianas . . . . . . . . . . . . †††† Difference not statistically significant.1Excludes data for the territories.NOTES: Population data for computing birth rates were provided by the U.S. Census Bureau.Rates by state may differ from rates computed on the basis of other population estimates.TFRs declined for nearly all race and Hispanic origin groups in2012, down 1%–2% for non-Hispanic white, non-Hispanic black,Hispanic, and AIAN women. However, the rate for API women rose4% from 2011 to 2012. Among specified Hispanic groups, the rate forMexican and Puerto Rican women fell 3% each; rates for Cuban andother Hispanic women (Central and South American and unspecifiedHispanic groups) did not change significantly.The 2012 U.S. TFR remained below “replacement”—the levelat which a given generation can exactly replace itself (generallyconsidered to be 2,100 births per 1,000 women). The TFR hasbeen generally below replacement since 1971. With the exceptionof Hispanic women (reflecting mainly, rates for Mexican andother Hispanic women), the TFRs for all other groups were belowreplacement (Tables 8 and 14).Births and birth rates by stateThe number of births declined between 2011 and 2012 in 7states (Alabama, Connecticut, Georgia, Illinois, Mississippi, NewHampshire, and New Jersey); increased in 6 states (Arizona, Idaho,Kansas, Louisiana, North Dakota, and Texas); and was essentiallyunchanged in the 37 remaining states and DC; see Tables 10 and 11for 2012 data. Among U.S. territories, the number of births declinedfor all areas except Guam, where births rose 9% in 2012.The GFR declined in 13 states in 2012 (Alabama, Alaska,Colorado, Connecticut, Florida, Georgia, Illinois, Massachusetts,Mississippi, Nevada, New Hampshire, New Jersey, and NorthCarolina); increased in 4 states (Idaho, Kansas, North Dakota, andOhio); and was essentially unchanged in the 33 remaining statesand DC. Rates among the states ranged from 50.3 births per 1,000women aged 15–44 in New Hampshire to 83.1 in Utah (Table 12). TheGFR decreased for Puerto Rico and Northern Marianas in 2012, 3%and 15%, respectively; increased for Guam (9%); and was essentiallyunchanged for American Samoa and Virgin Islands.The TFR declined from 2011 to 2012 for 21 states (Alabama,Alaska, California, Colorado, Connecticut, Delaware, Florida, Georgia,Illinois, Maryland, Massachusetts, Michigan, Mississippi, Missouri,Nevada, New Hampshire, New Jersey, New York, North Carolina,Pennsylvania, and Virginia); increased in 1 state (Idaho); and wasessentially unchanged in the remaining 28 states and DC. TFRsranged from 1,592.5 births per 1,000 women in Rhode Island to2,373.5 in Utah (Table 12). In 2012, the TFR decreased for AmericanSamoa, Puerto Rico, and Northern Marianas; increased for Guam;and was essentially unchanged for Virgin Islands.Birth rates for teenagers by stateThe birth rate for teenagers aged 15–19 declined between 2011and 2012 in 29 states and DC and was essentially unchanged in theremaining 21 states (Table B). Declines ranged from 4% for Louisianato 15% for Delaware. The teen birth rates for the U.S. territoriesdeclined for Puerto Rico and Virgin Islands and were essentiallyunchanged for the remaining areas from 2011 to 2012.Despite declines across all reporting areas in recent years, largedifferences in teen childbearing persist among the states (22–24). In2012, teen births rates ranged from 13.8 in New Hampshire to 47.5in New Mexico (Table 12). The wide range in state-specific teen ratesis consistent with patterns observed in previous analyses. In general,
National Vital Statistics Reports, Vol. 62, No. 9, December 30, 2013teen birth rates were lowest in the Northeast and highest across theSouth and Southwest. Differences in teen birth rates among raceand Hispanic origin groups, noted earlier, contribute in part to thevariation in state-specific teen birth rates (see “Age of mother
Selected data by mother's state of residence and birth rates by age and race of father also are shown. Trends in fertility patterns and maternal and infant characteristics are described and interpreted. Methods— Descriptive tabulations of data reported on the birth certificates of the 3.95 million births that occurred in 2012 are presented.