Transcription
You asked and we listened. For customerconvenience and estimating ease, we havemade the 2018 Project Costs available fordownload at www.RSMeans.com/2018books.You will also find sample estimates, anRSMeans data overview video and bookregistration form to receive quarterly dataupdates throughout 2018.Estimating Tips¡ The cost figures available in thedownload were derived from hundredsof projects contained in the RSMeansdatabase of completed constructionprojects. They include the contractor’soverhead and profit. The figureshave been adjusted to January of thecurrent year.¡ These projects were locatedthroughout the U.S. and reflect atremendous variation in square foot(S.F.) costs. This is due to differences,not only in labor and materialcosts, but also in individual owners’requirements. For instance, a bankin a large city would have differentfeatures than one in a rural area. Thisis true of all the different types ofbuildings analyzed. Therefore, cautionshould be exercised when usingthese Project Costs. For example, forcourthouses, costs in the database arelocal courthouse costs and will notapply to the larger, more elaboratefederal courthouses.¡ None of the figures ‘‘go with’’ anyothers. All individual cost items werecomputed and tabulated separately.Thus, the sum of the median figuresfor plumbing, HVAC, and electricalwill not normally total up to the totalmechanical and electrical costs arrivedat by separate analysis and tabulationof the projects.¡ Each building was analyzed as to totaland component costs and percentages.The figures were arranged in ascendingorder with the results tabulated asshown. The 1/4 column shows that25% of the projects had lower costsand 75% had higher. The 3/4 columnshows that 75% of the projects hadlower costs and 25% had higher. Themedian column shows that 50% of theprojects had lower costs and 50% hadhigher.¡ Project Costs are useful in theconceptual stage when no details areavailable. As soon as details becomeavailable in the project design, thesquare foot approach should bediscontinued and the project pricedas to its particular components. Whenmore precision is required, or forestimating the replacement cost ofspecific buildings, the current editionof RSMeans Square Foot Costs shouldbe used.additional information is available.The median figures, when multipliedby the total city construction costindex figures (see City Cost Indexes)and then multiplied by the project sizemodifier at the end of this section,should present a fairly accurate basefigure, which would then have to beadjusted in view of the estimator’sexperience, local economic conditions,code requirements, and the owner’sparticular requirements. There is noneed to factor the percentage figures,as these should remain constant fromcity to city.¡ The editors of this data would greatlyappreciate receiving cost figures onone or more of your recent projects,which would then be included in theaverages for next year. All cost figuresreceived will be kept confidential,except that they will be averagedwith other similar projects to arrive atsquare foot cost figures for next year.See the website above for details andthe discount available for submittingone or more of your projects.¡ In using the figures in this section, it isrecommended that the median columnbe used for preliminary figures if noDid you know?RSMeans data is available through our onlineapplication with 24/7 access: No part of this cost data may be reproduced, stored in a retrievalsystem, or transmitted in any form or by any means without priorwritten permission of Gordian.Search for unit prices by keyword Leverage the most up-to-date data Build and export estimatesTry it free for 30 days!www.rsmeans.com/2018freetrialCopyright The Gordian Group, Inc. 2018Project CostsBack by customer demand!
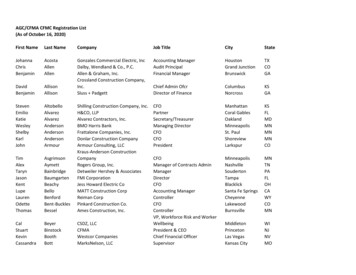
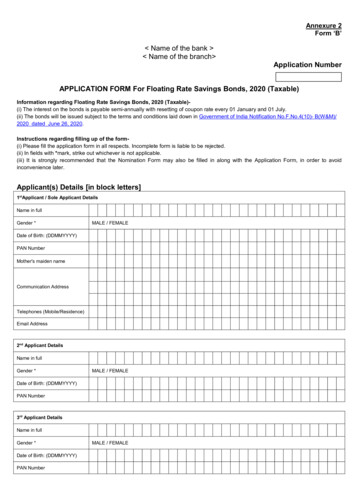
50 17Project Costs50 17 00 Project 000200030004000500Auto Sales with al Project CostsBanking calTotal Project CostsCourt l Project CostsData tal Project CostsDetention tal Project CostsFire otal Project ricalTotal Project ricalTotal Project CostsIndustrial Total Project CostsMedical Clinics & tal Project CostsUNIT COSTSUNIT% OF S.F.䊲10S.F.䊲Copyright The Gordian Group, Inc. 2018
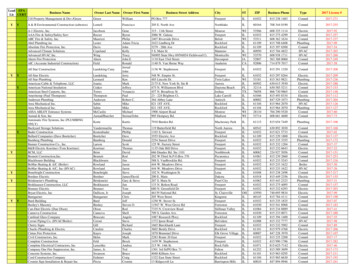
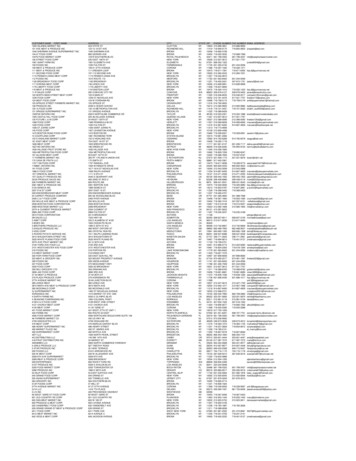
50 17Project Costs50 17 00 Project 200030004000500Mixed UseArchitecturalPlumbingMechanicalElectricalTotal Project CostsMulti-Family tal Project CostsNursing Home & Assisted al Project CostsOffice Total Project CostsParking al Project CostsParking Garage/Mixed UseArchitecturalPlumbingMechanicalElectricalTotal Project CostsPolice otal Project ctricalTotal Project CostsPublic Assembly Total Project ectricalTotal Project CostsUNIT COSTSUNIT% OF .䊲18S.F.䊲19S.F.䊲20S.F.䊲Copyright The Gordian Group, Inc. 2018893
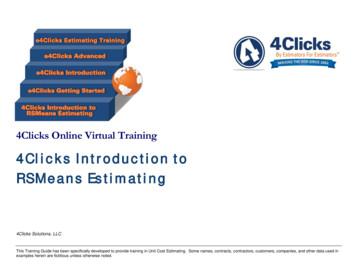
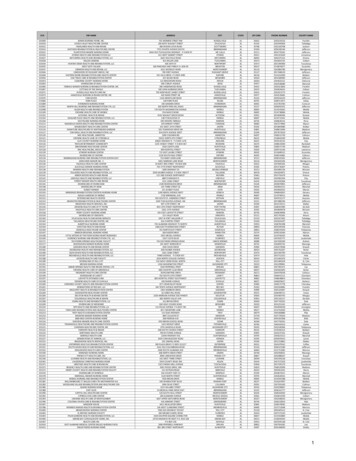
50 17Project CostsUNIT COSTS50 17 00 Project ngMechanicalElectricalTotal Project alTotal Project calTotal Project CostsUniversity, College & Private School Classroom & Admin Total Project CostsUniversity, College & Private School alTotal Project CostsUniversity, College & Private School Science, Eng. & Lab Total Project CostsUniversity, College & Private School Student Union Total Project tricalTotal Project Costs% OF 䊲26S.F.䊲27S.F.䊲28S.F.䊲Copyright The Gordian Group, Inc. 2018
Square Foot Project Size ModifierOne factor that affects the S.F. cost of a particular building is the size. Ingeneral, for buildings built to the same specifications in the same locality, thelarger building will have the lower S.F. cost. This is due mainly to thedecreasing contribution of the exterior walls plus the economy of scaleusually achievable in larger buildings. The Area Conversion Scale shownbelow will give a factor to convert costs for the typical size building to anadjusted cost for the particular project.The Square Foot Base Size lists the median costs, most typical project size inour accumulated data, and the range in size of the projects.The Size Factor for your project is determined by dividing your project areain S.F. by the typical project size for the particular Building Type. Withthis factor, enter the Area Conversion Scale at the appropriate Size Factorand determine the appropriate cost multiplier for your building size.Example: Determine the cost per S.F. for a 152,600 S.F.Multi-family housing.Proposed building area 152,600 S.F. 2.00Typical size from below 76,300 S.F.Enter Area Conversion scale at 2.0, intersect curve,read horizontally the appropriate cost multiplier of .94.Size adjusted cost becomes .94 x 194.00 182.36based on national average costs.Note: For Size Factors less than .50, the Cost Multiplier is 1.1For Size Factors greater than 3.5, the Cost Multiplier is .90Median Cost(Total Project Costs)SystemAuto Sales with RepairBanking InstitutionsDetention CentersFire StationsHospitalsIndustrial BuildingsMedical Clinics & OfficesMixed UseMulti-Family HousingNursing Home & Assisted LivingOffice BuildingsParking GarageParking Garage/Mixed UsePolice StationsPublic Assembly rsity, College & Private School Classroom & Admin BuildingsUniversity, College & Private School DormitoriesUniversity, College & Private School Science, Eng. & Lab BuildingsWarehouses 173.00278.00293.00222.00345.00 116.00Typical SizeGross S.F.(Median of l Range(Low High)(Projects)8,200 28,7003,300 38,10012,300 183,3006,300 29,60054,700 410,3005,100 200,6002,600 327,00014,400 49,90012,500 1,161,5001,500 242,6001,100 930,00099,900 287,0005,300 318,00015,400 31,6002,200 235,3001,500 223,8005,500 42,0005,800 61,0005,500 410,8009,400 196,2001,500 126,90036,000 117,600600 303,800895Copyright The Gordian Group, Inc. 2018
RSMeans data is available through our online application with 24/7 access: Search for unit prices by keyword Leverage the most up-to-date data Build and export estimates Try it free for 30 days! www.rsmeans.com/2018freetrial Project Costs Back by customer demand! You asked and we listened. For customer convenience and estimating ease, we have