Transcription
A Century of Evidence on Trend-Following InvestingBrian HurstPrincipalFall 2012Yao Hua OoiPrincipalLasse H. Pedersen, Ph.D.*PrincipalA Century of Evidence onTrend-Following InvestingExecutive SummaryWe study the performance of trend-following investing across global markets since 1903, extendingthe existing evidence by more than 80 years. We find that trend-following has delivered strongpositive returns and realized a low correlation to traditional asset classes each decade for morethan a century. We analyze trend-following returns through various economic environments andhighlight the diversification benefits the strategy has historically provided in equity bear markets.Finally, we evaluate the recent environment for the strategy in the context of these long-term results.* Brian Hurst and Yao Hua Ooi are at AQR Capital Management, and Lasse Heje Pedersen is at New York University, CopenhagenBusiness School, and AQR Capital Management. We are grateful to Cliff Asness and John Liew for helpful comments, and to Ari Levine,Haitao Fu, and Vineet Patil for excellent research assistance.Please read important disclosures at the end of this paper.AQR Capital Management, LLC I Two Greenwich Plaza, Third Floor I Greenwich, CT 06830 I T : 203.742.3600 I F : 203.742.3100 I www.aqr.comAQR Capital Management, LLCFOR INVESTMENT PROFESSIONAL USE ONLYFOR INVESTMENT PROFESSIONAL USE ONLY1
A Century of Evidence on Trend-Following InvestingSection 1: IntroductionAs an investment style, trend-following has existed for a very longtime. Some 200 years ago, the classical economist David Ricardo’simperative to “cut short your losses” and “let your profits run on”suggests an attention to trends. A century later, the legendarytrader Jesse Livermore stated explicitly that the “big money wasnot in the individual fluctuations but in sizing up the entiremarket and its trend.”1The most basic trend-following strategy is time series momentum– going long markets with recent positive returns and shortingthose with recent negative returns. Time series momentum hasbeen profitable on average since 1985 for nearly all equity indexfutures, fixed income futures, commodity futures, and currencyforwards.2 The strategy explains the strong performance ofManaged Futures funds from the late 1980s, when fund returnsand index data first becomes available.3This paper seeks to establish whether the strong performanceof trend-following is a statistical fluke of the last few decadesor a more robust phenomenon that exists over a wide range ofeconomic conditions. Using historical data from a number ofsources, we construct a time series momentum strategy all theway back to 1903 and find that the strategy has been consistentlyprofitable throughout the past 110 years.4 We examine thestrategy’s decade-by-decade performance, its correlation to majorasset classes, and its performance in historical equity bull and bearmarkets. The wealth of data also provides context for evaluatingthe recent environment for the strategy. We consider the effect ofincreased assets in the strategy as well as the increased correlationsacross markets since the credit crisis. We also review a number ofdevelopments that are potentially favorable for the strategy goingforward, such as lower trading costs, lower fees, and an increasednumber of tradable markets.Section 2: Constructing the Time SeriesMomentum StrategyTrend-following investing involves going long markets that havebeen rising and going short markets that have been falling, bettingthat those trends continue. We create a time series momentum1 Ricardo's trading rules are discussed by Grant (1838) and the quote attributed toLivermore is from Lefèvre (1923).2 Moskowitz, Ooi, and Pedersen (2012).3 Hurst, Ooi, and Pedersen (2012).4 Our century of evidence for time series momentum complements the evidencethat cross-sectional momentum (a closely related strategy based on a security’sperformance relative to its peers) has delivered positive returns in individual equitiesback to 1866 (Chabot, Ghysels, and Jagannathan, 2009) and has worked acrossasset classes (Asness, Moskowitz, and Pedersen, 2012).AQR Capital Management, LLCstrategy that is simple, without many of the often arbitrary choicesof more complex models. Specifically, we construct an equalweighted combination of 1-month, 3-month, and 12-month timeseries momentum strategies for 59 markets across 4 major assetclasses – 24 commodities, 11 equity indices, 15 bond markets,and 9 currency pairs – from January 1903 to June 2012. Sincenot all markets have return data going back to 1903, we constructthe strategies using the largest number of assets for which returndata exist at each point in time. We use futures returns when theyare available. Prior to the availability of futures data, we rely oncash index returns financed at local short rates for each country.Appendix A lists the markets that we consider and the source andlength of historical return data used.For each of the three time series momentum strategies, theposition taken in each market is determined by assessing thepast return in that market over the relevant look-back horizon.A positive past return is considered an “up trend” and leads toa long position; a negative past return is considered a “downtrend” and leads to a short position. Therefore, each strategyalways holds either a long or short position in every market. Eachposition is sized to target the same amount of volatility, both toprovide diversification and to limit the portfolio risk from any onemarket. The positions across the three strategies are aggregatedeach month, and scaled such that the combined portfolio has anannualized ex-ante volatility target of 10%.5 The volatility scalingprocedure ensures that the combined strategy targets a consistentamount of risk over time, regardless of the number of markets thatare traded at each point in time.Finally, we subtract transaction costs and fees. Our transaction costestimates are based on current estimates of average transactioncosts in each of the four asset classes, as well as an estimate ofhow much higher transaction costs were historically compared tothe present, based on Jones (2002). To simulate fees, we apply a2% management fee and a 20% performance fee subject to a highwater-mark, as is typical for Managed Futures managers.6 Detailson transaction costs and fee simulations are given in Appendix B.Our methodology follows that of Moskowitz, Ooi, and Pedersen(2012) and Hurst, Ooi, and Pedersen (2012). These authors findthat time series momentum captures well the performance of theManaged Futures indices and manager returns, including thelargest funds, over the past few decades when data on such fundsexists.5 A simple covariance matrix estimated using rolling 3-year equally weighted monthlyreturns is used in the portfolio volatility scaling process.6 While a 2/20 fee structure has been commonplace in the industry, some managerscharged higher management and performance fees in earlier time periods. On theother hand, there are also managers that charge lower fees for the strategy today.FOR INVESTMENT PROFESSIONAL USE ONLY2
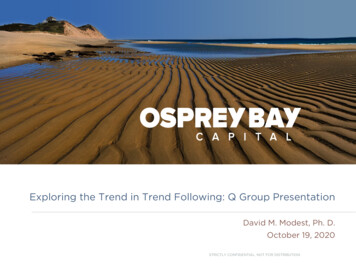
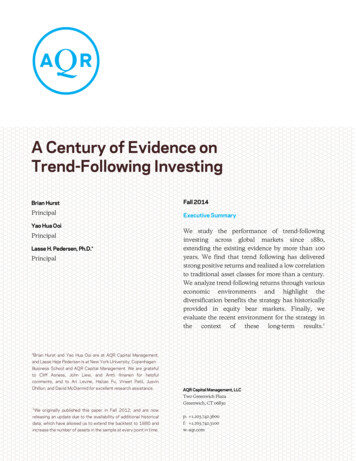
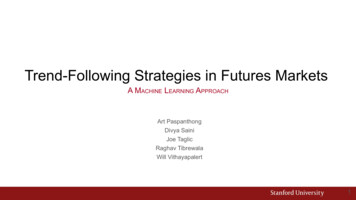
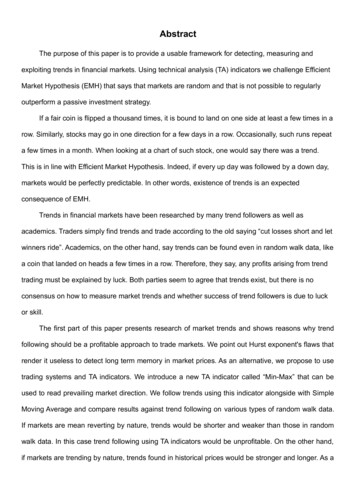
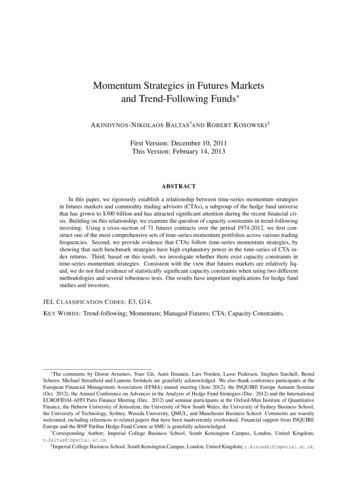
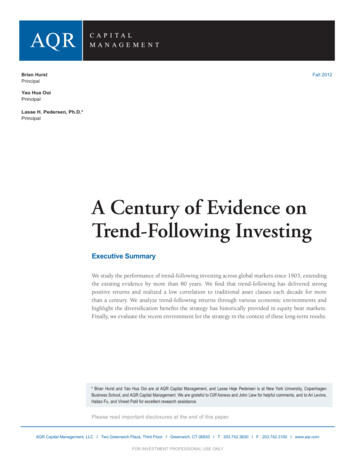
A Century of Evidence on Trend-Following InvestingExhibit 1: Hypothetical Performance of Time Series MomentumStrategy performance after simulated transaction costs both gross and net of hypothetical 2-and-20 fees.Time PeriodFull Sample:Jan 1903 - June 2012By Decade:Jan 1903 - Dec 1912Jan 1913 - Dec 1922Jan 1923 - Dec 1932Jan 1933 - Dec 1942Jan 1943 - Dec 1952Jan 1953 - Dec 1962Jan 1963 - Dec 1972Jan 1973 - Dec 1982Jan 1983 - Dec 1992Jan 1993 - Dec 2002Jan 2003 - June 2012Gross of FeeReturns(Annualized)Net of 2/20Fee 0.18-0.35-0.400.130.320.20Sharpe Ratio, Correlation to S&PNet of Fees500 ReturnsCorrelation to US10-year BondReturnsSource: AQR. Please read important disclosures at the end relating to hypothetical performance and risks.Section 3: Performance over a CenturyExhibit 1 shows the performance of the time series momentumstrategy over the full sample since 1903 as well as for each decadeover this time period. We report the results net of simulatedtransaction costs, and consider returns both before and after fees.The performance has been remarkably consistent over an extensivetime horizon that includes the Great Depression, multiplerecessions and expansions, multiple wars, stagflation, the GlobalFinancial Crisis, and periods of rising and falling interest rates.Skeptics argue that managed futures has benefited mainly fromthe long secular decline in interest rates. While the strategy didperform well over the past 30 years, the best performing decadefor the strategy occurred during the 1973-1982 period, when US10 year treasury yields rose from 6.4% to 10.4% with extremevolatility in between.Our long-term out-of-sample evidence suggests that it is unlikelythat such price trends are a product of statistical randomnessor data mining. Indeed, the first eight decades of data is out-ofsample evidence relative to the literature and the performance isstrong in each of these decades. Trends appear to be a pervasivecharacteristic of speculative financial markets over the long term.Trend-following strategies perform well only if prices trendmore often than not. A large body of research7 has shown thatprice trends exist in part due to long-standing behavioral biasesexhibited by investors, such as anchoring and herding, as wellas the trading activity of non-profit seeking participants, suchas central banks and corporate hedging programs. For instance,when central banks intervene to reduce currency and interestrate volatility, they slow down the rate at which information isincorporated into prices, thus creating trends. The fact that trendfollowing strategies have performed well historically indicates thatthese behavioral biases and non-profit seeking market participantshave likely existed for a long time.The returns to the strategy have exhibited low correlations tostocks and bonds over the full time period, as well as in themajority of sub-periods, as shown in Exhibit 1. Even moreimpressively, the strategy has performed best in large equitybull and bear markets. Exhibit 2 shows the annual hypotheticalreturns to the strategy, plotted against the returns to the S&P500 from 1903-2011. The “smile” shows that trend-followinghas done particularly well in extreme up or down years for thestock market. This strong performance in bear markets over thecentury extends the evidence that has been documented since the1980s, as exemplified most recently with the strong performanceof trend-following during the Global Financial Crisis.7 Barberis, Shleifer, and Vishny (1998), Daniel, Hirshleifer, Subrahmanyam (1998),De Long et al. (1990), Hong and Stein (1999) and Frazzini (2006) discuss a numberof behavioral tendencies that lead to the existence of price trends.AQR Capital Management, LLCFOR INVESTMENT PROFESSIONAL USE ONLY3
A Century of Evidence on Trend-Following Investingsignificant positive returns during a number of these events.The valuable hedging benefits that trend-following strategiesdelivered during the Global Financial Crisis 2007-2009 do notlook unusual when you consider how the strategy has behavedin other deep equity bear markets. Why have trend-followingstrategies tended to do well in bear markets? The intuition is thatthe majority of bear markets have historically occurred graduallyover several months, rather than abruptly over a few days, whichallows trend-followers an opportunity to position themselvesshort after the initial market decline and profit from continuedmarket declines. In fact, the average peak-to-trough drawdownlength of the ten largest 60/40 drawdowns between 1903 and2012 was approximately 18 months.Exhibit 2: Time Series Momentum “Smile”The annual net of fee returns of a time series momentumstrategy versus the S&P 500, 1903-2011.Time Series Momentum Returns80%60%40%20%Given its attractive returns and diversifying characteristics,allocating to a time series momentum strategy would havesignificantly improved a traditional portfolio’s performance overthe past 110 years. Specifically, Exhibit 4 shows the simulatedeffect of allocating 20% of the capital from a 60/40 portfolio tothe time series momentum strategy. We see that such an allocationwould have helped reduce the maximum portfolio drawdown,lowered portfolio volatility, and increased portfolio returns.0%-20%-40%-50%-30%-10%10%30%50%S&P 500 ReturnsExhibit 4: Diversifying 60/40 with anAllocation to Time Series MomentumSource: AQR. Time Series performance is hypothetical as described above. Please read importantdisclosures at the end relating to hypothetical performance.Performance characteristics of the 60/40 portfolio and a portfolio with 80%invested in the 60/40 portfolio and 20% invested in the time seriesmomentum strategy, from January 1903 to June 2012.As another way to evaluate the diversifying properties of trendfollowing investment during extreme events, we consider theperformance during peak-to-trough drawdowns for the typical60-40 portfolio.8 Exhibit 3 shows the performance of the timeseries momentum strategy during the 10 largest drawdownsexperienced by the traditional 60-40 portfolio over the past 110years. We see that the time series momentum strategy experiencedpositive returns in 9 out of 10 of these stress periods and delivered8 The 60/40 portfolio has 60% of the portfolio invested in the S&P 500 and 40% investedin US 10-year bonds. The portfolio is rebalanced to the 60/40 weights at the end of eachmonth, and no fees or transaction costs are subtracted from the portfolio returns.Total Net of FeeRe
Trend-following strategies perform well only if prices trend more often than not. A large body of research7 has shown that price trends exist in part due to long-standing behavioral biases exhibited by investors, such as anchoring and herding, as well as the trading activity of non-profi t seeking participants, such as central banks and corporate hedging programs. For instance, when central .