Transcription
Trend Following StrategiesMidterm Presentation: April 29, 2019Art PaspanthongDivya SainiJoe TaglicRaghav TibrewalaWill Vithayapalert
1.Background & IntroductionTrend Following Strategies
“Cut short your losses;let your profits run on.-David Ricardo3
A Simple Example: Channel breakout signal Systematically find trends inmarket pricesRide themGet out before they revertTake a long (short) position when asignal breaks out of a certain upper(lower) boundary for a range of values.4
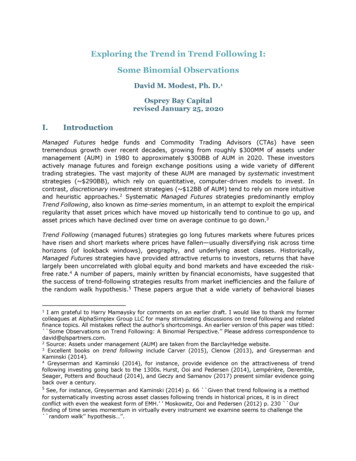
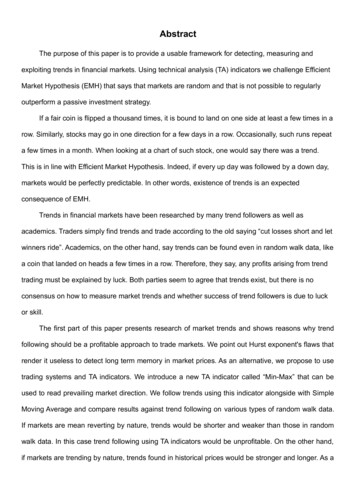
Historical Performance: CTA SmileTrend following returns tendto perform well duringmoments when marketdivergence is the largest.Periods when markets move the most dramatically provide “trends” suitable for trend following strategies.5
Historical Performance: Drawdown The maximum drawdown fortrend following is approximately25% lower than that of thebuy‐and‐hold portfolio. The average of the top fivedrawdowns for trend followingis roughly ⅓ lower than that ofbuy‐and‐hold.Trend following returns exhibit positive skewness. The chance for left tail risk or large drawdowns is relatively small due tothe “let profits run and cut short your losses” nature of more small losses as opposed to large drawdowns.6
Price DataTrading FrameworkTrend SignalsSignal StrengthTrading Signals1.2.3.4.When to enter a positionHow large a position to take onWhen to exit a positionHow much risk to allocate to different sectorsPosition SizingMarketAllocationTrading Execution7
2.Literature ReviewTrend Following Strategies
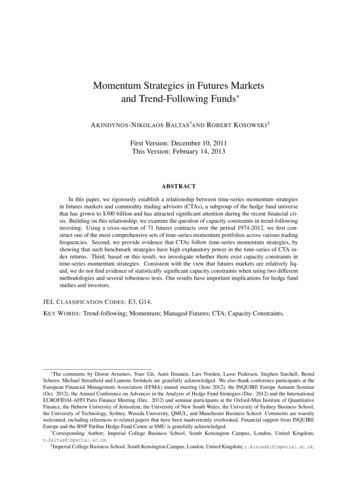
Two centuries of trend following (2014) - Y. Lempérière, C. Deremble, P. Seager, M. Potters The paper gives the evidence of presence of trends in the market over twocenturiesPresence of trends forms the basis for trend following strategiesIn this paper, the signal function is:sn(t) [p(t 1) ⟨p⟩n,t 1] / σn(t 1)where ⟨p⟩ is the exponential moving averageThis sign of the signal function is useful for understanding the position(long or short) taken in the futures marketThe net trend strength used in this paper is:Qn(t) sum [sign[sn(t′)] (p(t′ 1) p(t′)) / σn(t 1)]This is the statistical significance of fictitious profit and loss if we tradedeveryday based on the position taken based on sign of signal function.9
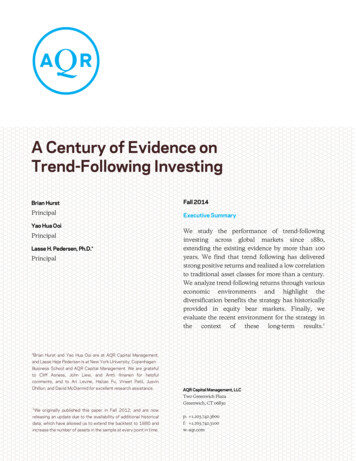
Two centuries of trend following - Results Fig: Fictitious P&L for a pool of futures A t-stat of 5.9 for trend following has beenobserved for a diversified pool of futuresOver two centuries, the t-statistic is around10.We can reject the null hypothesis because ofthe high value of the t-statisticThe highest values of the t-statistic were seenwith commodities data over the last 50 years.However, all asset classes showed high t-statvalues.The paper conclusively shows that:long term trends exist across all assetclasses and are stable in time.10
Which Trend Is Your Friend? (2015) - Ari Levine and Lasse Heje Pedersen This paper introduces the two common ways of measuring trend strengthsand compares them on futures dataThe two strategies are time series momentum (TSMOM) and moving averagecrossover (MACROSS)A TSMOM strategy goes long when prices have been moving up, and shortwhen prices have been moving down. The simplest TSMOM signal is the pastreturn over some time period, say m months or days:TSMOMtm returnt m,tThe MACROSS strategy first computes two moving averages (MA) of prices,which we call MAfast and MAslow. The fast MA puts more weight on recentprices, whereas the slow MA puts more weight on past prices.The MACROSS strategy depends on which MA is higher: the fast one or theslow one.11
Which Trend Is Your Friend? (2015) - Ari Levine and Lasse Heje PedersenTransfer of Momentum StrategyMoving Average Crossover Strategy12
Which Trend Is Your Friend? (2015) - Ari Levine and Lasse Heje Pedersen This paper also writes the MACROSS strategy in the form of weights and thenchooses weights in different ways. Different forms of weights include exponential weighted moving averagecrossover. Weights can also be taken from ordinary least squares.13
Which Trend Is Your Friend? (2015) - Results The paper compared some of these strategies on futures data. Note: The Sharpe Ratios are before transaction costs.14
3.DatasetsFutures of Commodities
Datasets of Commodities FuturesEnergyMetalsAgricultureCrude OilGoldCornNatural GasSilverWheatGasoline(Refined)CopperSoybeanTime Frame: 1-12 months ExpirationSource: Quandl16
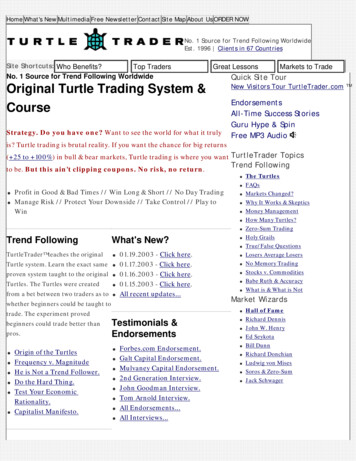
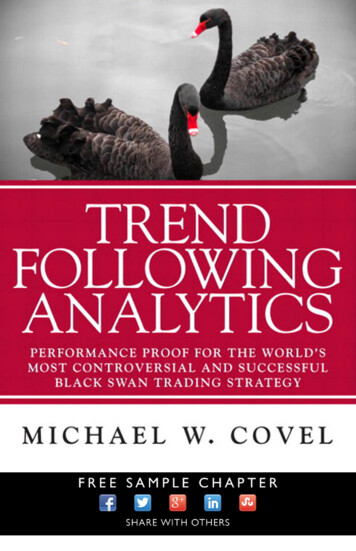
Dataset Exploration: Moving Average Strategy PlotMain TaskSell SignalData PreprocessingFeature EngineeringWeak/FalseModelSignalUsing Machine LearningTechniques to not onlyidentify these signalsbut also evaluate theBuy Signalstrength of the signal17
Signal Generation: Signal to Noise Ratio (SNR)A higher SNR indicatesWeak/FalseSignalSell Signala higher quality oftrend, or higher pricedivergenceThe price trend withlow SNR appears to bevery noisy. The signalfor trading is weak.18
4.Future WorkSignals Generations and Trade Executions
Plan for the Semester1.2.3.Alpha Predictiona. Select and clean a small number of time series, generating simple features and labelsb. Use regression to predict returns based on those featuresTrading Systema. Generate covariance matrix based on empirical datab. Use Modern Portfolio Theory to build a portfolio of contracts at each timestepc. Evaluate effectiveness based on returns, Sharpe ratioIncrease robustnessa. Introduce trading frictions (transaction costs, observe/trade delay, etc.)b. Generate more features to use in the return prediction model (price-based or external)c. Modify learning labels to consider returns of a longer time framed. Use a more sophisticated return prediction algorithm (i.e. artificial neural network)2020
Modern Portfolio TheorynwrCnumber of assets in the universe,length-n vector representing allocation to each asset (typically sums to 100%)length-n vector representing predicted returns of each assetn x n covariance matrixExpected portfolio return is w T rExpected portfolio variance is wT C wStraightforward convex optimization problems to:: Constrain variance (upper bound) and maximize return Constrain return (lower bound) and minimize variance In certain cases, can also maximize explicitly for Sharpe ratio2121
ynAtseuQ?sion22
Trend following returns exhibit positive skewness. The chance for left tail risk or large drawdowns is relatively small due to the “let profits run and cut short your losses” nature of more small losses as opposed to large drawdowns. 1. When to enter a position 2. How large a position to take on 3. When to exit a position 4. How much risk to allocate to different sectors Trading Framework .