Transcription
1NET-ZEROThe Next Frontier for Corporate SustainabilityNet Zero: The NextFrontier for CorporateSustainability9 Data Visualizations that Reveal the US S&P100’s GHG Emissions and Path to Net ZeroDECEMBER 2020Pete Edmunds, Daniela Chona, and Lesley MengYaleCenter for Businessand the Environment
2NET-ZEROThe Next Frontier for Corporate SustainabilityIntroductionWhen it comes to climate change, the science is unequivocal: global temperatures will continueto rise for decades, largely due to greenhouse gases produced by human activities. This will havecatastrophic effects on human health, infrastructure, energy, agriculture, fisheries, sea levels,natural ecosystems, and more. For many, the consequences have felt distant and theoretical — untilnow. Unprecedented wildfires, the world’s first climate-induced war in Syria, PG&E’s climate-fueledbankruptcy, devastating hurricanes, and deadly heatwaves — among a litany of other environmental,social, and economic disasters — have changed this. Following the US’ withdrawal from the ParisAgreement on November 4, it is up to corporations to take direct responsibility for their impact onclimate change.While many corporations, investors, regulators, and consumers agree that corporate sustainability isimperative, identifying best practices and which companies are ‘walking the walk’ can be challenging.Corporate metrics, certifications, and coalitions abound, including the Sustainable AccountingStandards Bureau (SASB), the Global Reporting Initiative (GRI), the Science-Based Targets Initiative(SBTi), the Task Force on Climate-related Financial Disclosures (TCFD), the Greenhouse Gas Protocol,the Renewable Energy 100 (RE100), the Business Roundtable, B Corps, and benefit corporations.Greenwashing — a form of marketing that creates a false perception of a company’s environmentalsustainability — exacerbates this confusion.To cut through the noise, our team from the Yale School of Management narrowed in on one, universalmetric that is the single biggest driver of climate change: greenhouse gas emissions (GHGs), measuredin metric tons of carbon dioxide equivalents. It seems obvious to catalog GHGs from the US’ largestpublic companies and track their goals for reducing them, but after scouring the internet, it becameclear that the data is not publicly available in a free, consolidated format. The Carbon DisclosureProject houses a robust data set on corporate emissions, but requires payment to access, and acrowdsourced Google Doc helps document net zero pledges, but no data source seems to collectand analyze all of this data in aggregate. To change this, we manually tracked down data on the USS&P 100’s historical GHG emissions since 2015, emissions reduction goals, and emissions reductioninitiatives. We then analyzed what we found and have summarized our findings below. While ourinsights cover a range of topics relevant to corporate emissions, two common themes emerged.First, the private sector desperately needs standardized guidelines for GHG emissions measurementand disclosure. Second, the goal of reaching ‘net zero’ emissions, defined by the IPCC as the equalbalancing of anthropogenic greenhouse emissions with anthropogenic greenhouse gas removals overa specific period, has become the new North Star for corporate sustainability.
NET-ZEROThe Next Frontier for Corporate Sustainability3Our goals are to:1inspire companies to learn best practices from their peers on the path to ‘net zero,’2provide a publicly available data source and collection of insights for academics, nonprofits, thinktanks, corporations, and others to study, and3empower concerned global citizens and consumers with information on the culpability of specificUS corporations in fueling climate change so that they can more effectively vote with their dollars,select their employers, and support climate policies.The report is structured around nine data visualizations that communicate the current state of GHGemissions among the US S&P 100 and their stated goals for reducing them. Each visualization isaccompanied by an explanation of select insights that can be drawn from them. A full list of the 100companies included in the analysis can be found in the appendix, and the assembled data source canbe downloaded here, in support of goal #2 described above.The State of EmissionsThere’s no consensus yet on emissions measurement and disclosure practices and what it means tobe ‘net zero.’The lack of consolidated, universal analysis of corporate GHG emissions is due in part to theheterogeneity of companies’ measurement and disclosure practices. Measurement variables include: Value Chain Scope: Scope 1 measures direct emissions from sources owned or controlled by thecompany, such as on-site fossil fuel combustion or fleet fuel consumption. Scope 2 measuresindirect emissions from the generation of purchased electricity, i.e., emissions from utility providersproportional to the amount of energy purchased and consumed. Scope 3 measures all otherindirect emissions from entities not controlled or owned by the company, such as emissionsfrom purchased materials, employee commuting, and use of sold products. Almost all of the 100companies measure and disclose their Scope 1 2 emissions (93 in 2018 and 90 in 2019), but fewercompanies report their Scope 3 emissions (78 in 2018 and 77 in 2019). The companies who failed todisclose this information in either 2018 or 2019 are named in the table below. The key question is:should Scope 3 reporting be required? Geographical Scope: Some US companies separate out their emissions by country borders, whileothers report on global emissions broadly. For the purposes of this analysis, all global emissionswere included due to the global and interconnected nature of climate change, while recognizingthat some of the US S&P 100 companies have larger international footprints than others.
NET-ZEROThe Next Frontier for Corporate Sustainability4 Business Unit Scope: When it comes to GHG emissions reduction goals, some companiesapportion specific business units to strive for the cache of touting ‘carbon neutral flights,’ or ‘netzero cloud computing.’ While these efforts are a step in the right direction, in general they tend tobe misleading claims that obfuscate the total carbon footprint of a company. For this analysis, allbusiness units were included in companies’ GHG emissions data. Use of offsets: 24 of the 100 companies discussed purchasing carbon offsets to mitigate theircarbon footprint. Most subtract out their carbon offsets when reporting on their GHG emissions, butnot all. While carbon offsets can be a powerful, market-based tool that allows companies to reducetheir net carbon emissions in a cost-effective manner, not all carbon offsets are created equal. Forexample, a company might purchase an offset to help pay for a new wind farm, only to find outlater that the wind farm would have been built anyway. According to the American MeteorologicalSociety, for an offset to be effective it must meet the following criteria: (1) additionality: theemissions reduction would not occur without the offset, (2) no leakage: the reductions cannotsimply shift the emissions to another location, (3) no double-counting: offsets for the sameprograms cannot be sold more than once, and (4) no perverse incentives: an organization that sellsoffsets through emissions reduction projects should not have an incentive to fight climate policyfor self-gain. Despite the range of effectiveness of carbon offset programs, this analysis honoredcompanies’ claims of subtracting out offsets from their emissions totals.No Emissions Reporting*Scope 1 2 Reporting Only (No Scope 3)*Berkshire Hathaway Inc.Altria Group IncDanaherCharter Communications Inc.AIGEmerson ElectricKinder Morgan Inc.American TowerExxon MobilNetflix Inc.Booking Holdings Inc.Facebook, Inc.Bristol Myers SquibbGeneral DynamicsCaterpillar Inc.Nextera Energy Inc.Coca-ColaTexas InstrumentsComcastThe Walt Disney CompanyCostcoThermo Fisher Scientific*Companies included on this list failed to meet the stated criteria in both 2018 or 2019. If a companyreported their emissions in either 2018 or 2019, they were credited for their reporting and omitted fromthis list.
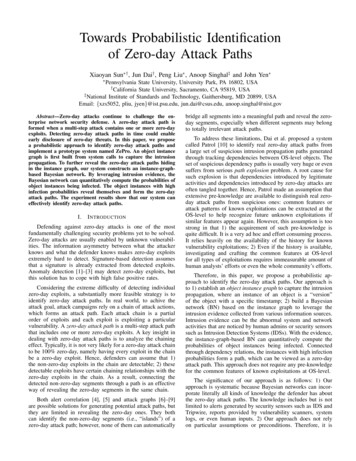
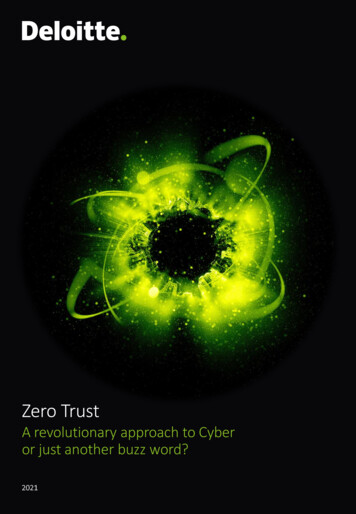
5NET-ZEROThe Next Frontier for Corporate SustainabilityThe 5 biggest emitters contribute over 60% of total S&P 100 Scope 1 and 2 emissions.Scope 1 & 2 Emissions by Company & Sector*Note: Click on the visual above and the others in the report to explore interactive versions of the data.In the visual above, the size of each bubble corresponds to the total number of each company’s 2019Scope 1 and 2 emissions. For a handful of companies who have not yet reported 2019 figures, 2018data was used as a proxy.Exxon Mobil, Nextera, Duke Energy, Southern Company, and Chevron contribute a significantlyoutsized proportion (64%) of the S&P 100’s total Scope 1 and 2 emissions. It is not surprising to see thesefossil-fuel-intensive oil and gas and utilities companies at the top of the list, but the magnitude of theiremissions is striking.
6NET-ZEROThe Next Frontier for Corporate SustainabilityWhile some of these companies have begun modest transitions to lower-carbon business models,others have resisted entirely and are starting to pay the price. Take Exxon Mobil, for example, whichembodies “Big Oil” in the US. Exxon emits more Scope 1 and 2 emissions than any other US company,and recently leaked documents revealed the company’s plans to increase their emissions by 17% by2025, which represents an increase greater than the current GHG emissions of the entire country ofGreece. Nextera, by contrast, is shifting to a renewables portfolio. In early October, Nextera usurpedExxon as the most valuable energy company in the US – a powerful symbol of renewables’ eclipseof oil. Exxon, which was the most valuable company in the world just seven years ago, has sincelost roughly 60% of its value and has faced greater scrutiny by activists, governments, and investorsregarding their handling of climate risk. With renewable energy prices below fossil fuel prices in moststates, similar economic collapses are likely within the oil and gas sector, with Exxon serving as asalient example of what can happen to companies that resist the natural transition to a low-carboneconomy that is already underway.Notably, Conoco made recent headlines as the first US oil company to announce a carbon neutralgoal, with plans to reach net zero by 2050. Other oil giants hold a significant opportunity to curtail UScorporate emissions by following suit.
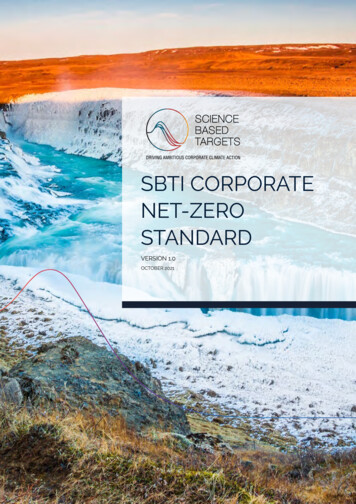
7NET-ZEROThe Next Frontier for Corporate SustainabilityAutomotive and retail companies’ emissions increase significantly when accounting for Scope 3.Scope 1, 2, & 3 Emissions by Sector & IndustryWhile Scope 1 and 2 emissions point to clear culprits in the oil and gas and utilities sectors, accountingfor Scope 3 emissions provides a more complete picture of companies’ total impact on the planet. Asdescribed above, Scope 3 measures indirect emissions including purchasing of raw materials and useof sold products. Under this accounting method, GM and Ford are held responsible for the emissionsthat result from the cars they put on the road, and these companies jump to the third and eighth highestemitters, respectively, of total Scope 1, 2 and 3 emitters among the 78 companies reporting. This isrelatively unsurprising given that the transportation sector recently toppled electricity as the largestemissions sector in the US, at 28%, but it highlights the importance of incorporating a Scope 3 lens andaccelerating the shift towards electric and hybrid vehicles.
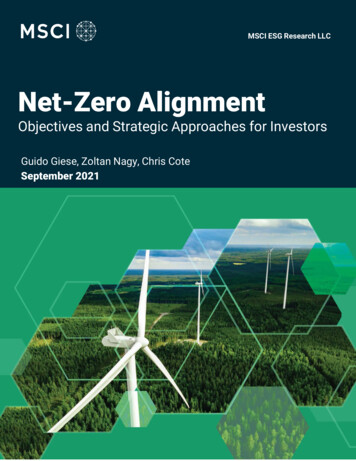
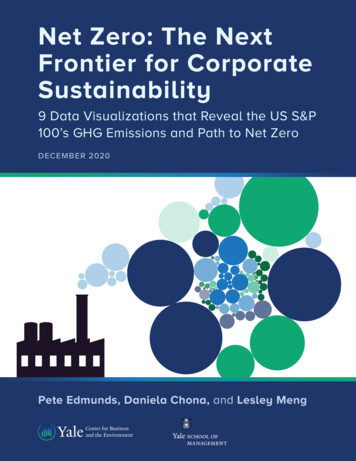
NET-ZEROThe Next Frontier for Corporate SustainabilityThe retail industry within the Consumer Discretionary sector similarly climbs the list of biggestemitters when accounting for Scope 3, trailing only oil and gas. These companies include Procter &Gamble, Home Depot, and Walmart, who rank second, fourth, and fifth, respectively, among thosereporting total Scope 1, 2 and 3 emissions. These companies sell a high volume of products withubiquitous usage, so the emissions from their supply chains and use of sold products (both Scope 3)are astronomically high. Procter & Gamble’s emissions, for example, are approximately 98% Scope 3.These emissions include high volumes of plastic procurement, consumers running washing machineswith Tide detergent, and consumers showering with Pantene shampoo.Contextualizing companies’ emissions relative to their revenues separates sustainability leadersand laggards.2019 Revenue & Emissions by Company2019 Revenue82019 Scope 1 2 Emissions*
9NET-ZEROThe Next Frontier for Corporate SustainabilityWhen considering the carbon footprints of US companies, it is useful to consider them in the context oftheir revenues, with the understanding that the more revenue a company contributes to the economy,the more it should be permitted to emit. For example, one would not hold Walmart accountable to thesame absolute GHG emissions standards as a small mom and pop shop. To account for this, the abovegraph plots revenue against Scope 1 and 2 emissions (the emissions axis is presented on a logarithmicscale to compress outlier data points, as well as a reverse scale, so that the upper right quadrantrepresents a more favorable position). The color of each point indicates the sector of the company.Companies that fall in the top right quadrant represent the sustainability leaders who have keptemissions in check while earning high revenues. These sustainability leaders include Apple, UnitedHealth, Bank of America, and Wells Fargo. The top left quadrant holds the companies with both highrevenues and high emissions, and therefore should be viewed as some of the biggest opportunities foremissions reduction. These corporate behemoths include Exxon, Amazon, Chevon, AT&T, and CVS. Thebottom left represents the ‘worst offenders,’ who emit disproportionately high levels of GHG relative totheir role in the US economy. Some of the worst offenders are Nextera, Southern Company, AmericanTower, and Occidental Petroleum. Finally, the bottom right quadrant includes companies with lowrevenues and low emissions. Like the companies in the top left, these companies meet the status quo interms of proportional emissions and revenues, and include Adobe, Nvidia, Biogen, and BlackRock.
10NET-ZEROThe Next Frontier for Corporate SustainabilityThe Race to Net Zero26 of the US S&P 100 companies have a net zero goal in place.Count of Company Net Zero Goals by SectorCorporate sustainability has a new North Star: net zero. 26 S&P 100 companies have set goals to reacheither carbon neutrality or net zero emissions for their Scope 1 and 2 emissions, and of these 26, 20announced their goals in 2020. Pressure from industry peers, activist NGOs, consumers, employees,and public policy have ushered in a new wave of corporate sustainability commitments that align withthe Paris Agreement’s target of net zero emissions by 2050.The Intergovernmental Panel on Climate Change (IPCC) defines net zero emissions as the equalbalancing of anthropogenic greenhouse emissions with anthropogenic greenhouse gas removals overa specific period. Given the lack of standardized measurement tools and methodologies for emissions,
11NET-ZEROThe Next Frontier for Corporate Sustainabilitythere is some heterogeneity among these net zero claims. Some firms discuss ‘carbon neutrality,’ whichtechnically would require balancing only CO2 emissions with CO2 removals. Net zero, by contrast,covers all six greenhouse gas emissions, such as methane and nitrous oxide. In practice, some firmsuse the term ‘carbon neutral’ to include the CO2-equivalents of all greenhouse gas emissions, and thususe the terms interchangeably.These goals also vary by value chain scope. All 26 companies include Scope 1 and 2 emissions as partof their net zero goals, some include elements of Scope 3 emissions, and none include Scope 3 entirely.These differences among net zero goals point to a need for a shared definition of net zero, similar to theneed for standardized measurement and disclosure practices.The Science-Based Targets initiative verifies the credibility of these net zero goals.Count of Company SBTi-Approved Goals by Sector
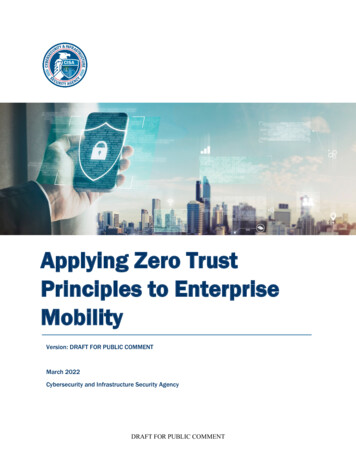
12NET-ZEROThe Next Frontier for Corporate SustainabilityNot all net zero targets are created equal. The Science Based Targets initiative (SBTi) is addressingthis by creating a global, science-based standard for companies to set net zero targets. SBTi assessescompanies’ emissions targets against a robust set of criteria to validate that they: (1) include the properemission sources and activities, (2) align with a Paris Agreement timeline, and (3) include a viablepath to being accomplished. To achieve a successful corporate net-zero strategy, SBTi advocates forreducing value chain emissions with the depth of abatement required to limit warming to 1.5ºC andneutralizing the impact of any residual emissions that remain unfeasible to be eliminated throughpermanent removal of GHG.Only ten of the 26 S&P 100 companies with net zero or carbon neutral goals have had their targetsapproved by SBTi. These companies include Biogen, Philip Morris, Facebook, AT&T, Amazon, Nike,Starbucks, Microsoft, Salesforce, and Walmart. It is important to note, however, that because SBTi isfocused on helping companies reach net zero by 2050, they are not limited to working with companieswho have already set firm targets for net zero. They also partner with and evaluate companies basedon intermediate goals for emissions reduction that are consistent with the level of decarbonizationrequired to limit warming to 1.5ºC or well-below 2ºC, such as McDonald’s SBTi-approved goal ofreducing GHG emissions from restaurants and offices by 36% by 2030 from a 2015 base year. Amongthe US S&P 100, 27 companies have SBTi-approved emission reduction goals, including the 9 with netzero goals.The consumer staples sector – with companies such as PepsiCo, Target, and Kraft Heinz – leads theway on SBTi-approved targets. The financial services sector, by contrast, leads in net zero targets buthas very few emissions reduction goals – two of 18 – that are SBTi-approved.Net zero target dates are clustered heavily by industry.NetZero Company Targets by SectorNet Zero Target YearCommunication ServicesConsumer DiscretionaryConsumer StaplesEnergyFinancial ServicesHealthcareMaterialsTechnologyUtilities
13NET-ZEROThe Next Frontier for Corporate SustainabilitySeveral clusters emerge among the S&P 100 companies with a stated date for reaching net zero. Theseven financial services companies range from 2015 to 2022; Apple and Microsoft both target 2030;AT&T and Verizon sit together at 2035; and four of the five consumer discretionary companies withnet zero targets are aiming for 2050. This is no coincidence – it illustrates three key drivers behindcompanies’ net zero timelines.First, and most obviously, some industries face much more challenging paths to reaching net zero thanothers. Dow, DuPont, and Duke Energy — whose core businesses are extractive and fossil-fuel intensive— must transform fundamentally their products, services, and business models to reach net zero.Financial services companies, by contrast, need only to shift to renewable energy power for their smallfootprint of office buildings and invest in a modest level of carbon offsets in order to net out their Scope1 and 2 emissions.More interestingly, this trend illustrates the power of industry and competitor pressure. Consumers andinvestors are increasingly demanding sustainable practices from the companies they patronize andfinance, so when Verizon announced its goal of net zero by 2035 in 2019, its biggest competitor, AT&T,matched their target date in 2020. Similarly, Ford and GM each announced their net zero target datesof 2050 just months apart.Finally, the timeline of net zero targets underscores the private sector’s acknowledgement of 2050 asa critical date for net zero emissions in order to hold global temperature rise to 1.5ºC, as recommendedby the Paris Agreement and the Intergovernmental Panel on Climate Change. Eight companies clusterat 2050 for their net zero timeline and no S&P 100 companies have set target dates beyond 2050.
NET-ZEROThe Next Frontier for Corporate SustainabilitySome net zero goals seem more feasible than others.Scope 1 & 2 Emissions by Company, Forecasted to Net Zero Target DataScope 1 2 Emissions14Comparing companies’ emissions trends over the past five years against a plotted path to their net zerotarget dates illustrates which companies have the most work to do to achieve their goal. In the chartabove, companies’ emissions are forecasted from their 2019 figure to the date by which they plan to benet zero, assuming a linear decrease in emissions over time.Duke Energy, which was not included on the graph for space limitations because it currently emits over100 million metric tons of CO2-equivalent per year, roughly three times as much as the next net-zeropledging company, has a long way to go to reach net zero by 2050. ConocoPhillips and Walmart mustsimilarly reduce tens of millions of CO2-equivalent emissions per year, but their trendlines from 2015 to2019 suggest that they are on the right path.
NET-ZEROThe Next Frontier for Corporate SustainabilityBanks have staked misleading claims of carbon neutrality, but change is finally underway.2019 Revenue & Emissions by Company2019 Revenue152019 Scope 1 2 Emissions*In terms of Scope 1 and 2 emissions, the financial sector is a clear leader. The median revenue amongthese companies is higher than the S&P 100’s median revenue yet the median emissions are less thanone tenth that of the cohort. Further, the sector leads with the most stated goals for net zero (sevencompanies) and has by far the most near-term targets. Target dates range from 2015 to 2022 forreaching net zero, with most of these seven companies already operating at net zero in terms of Scope1 and 2 emissions.
16NET-ZEROThe Next Frontier for Corporate SustainabilityHowever, these net-zero operations come with a significant asterisk: they omit Scope 3 emissions.While some banks partially include Scope 3 emissions such as business travel, no major US bankreports their total Scope 3 emissions. In the financial services sector, which bankrolls fossil fuels andother extractive industries, these Scope 3 emissions from investments and use of sold products can becolossal. It is difficult to say precisely how large, however, in the absence of complete measurementand reporting.In July, Morgan Stanley bucked this trend by becoming the first major US bank to commit to measuringand disclosing the emissions of its investments and loans. It also joined the Steering Committeeof the Partnership for Carbon Accounting Financials (PCAF) to help address the lack of consistentmeasurement tools and methodologies for emissions. In September, the bank made a more notableannouncement by pledging to reach net zero for financed emissions by 2050. Morgan Stanley, whichfinanced nearly 11 billion in fossil fuel expansion in 2019, has a long way to reach net zero for itsinvestments and loans and has not provided detail on its plans for reaching the goal, but its intentionrepresents a step forward for the industry and has put pressure on competitors to follow their lead.Likely responding to this pressure, JP Morgan announced just two weeks later that it would adopt afinancing commitment that aligns with the goals of the Paris Agreement. To do so, the bank will workwith clients in the high-emissions sectors of oil and gas, electric power, and automotive manufacturingto set emissions targets specific to each sector. The firm will establish its own intermediate emissionstargets for 2030 on the path to the Paris Agreement’s stated goal of net zero emissions by 2050 andwill expand its investments in low- and zero-carbon energy sources and technologies. The firm stoppedshort, however, of divesting from fossil fuel clients, of which it is the largest funder globally.Bank of America will be an important next mover to watch. On a panel on stakeholder capitalism andESG disclosure earlier this year, their CEO proclaimed that all public companies should reach net zero.While Bank of America has been carbon neutral for its Scope 1 and 2 emissions since 2016, they werethe fourth largest financier of fossil fuels globally in 2019. If the bank expands its net zero ambition toits investment and loan portfolio, it could play a significant leadership role in reducing emissions andcreating a more sustainable financing system in the US and globally.
NET-ZEROThe Next Frontier for Corporate Sustainability17Renewable energy, supplier partnerships, and core business initiatives are the most promising netzero strategies.Count of Company RE100 Members by SectorEmission reduction strategies vary widely across the companies surveyed, but several common themesemerged, and are listed roughly in order from least to most effective practices: Offsets: While offsets and carbon credits do play an important role in reaching net zero by 2050,in isolation they do not represent a credible approach to emissions mitigation. Under this strategy,companies purchase certificates that represent the reduction of a specified number of metric tonsof CO2. The certificate is linked to a project elsewhere in the world, run by an external organizationthat promises to reduce emissions by averting an otherwise harmful project. Some companies claimto be carbon neutral through their use of offsets, but Microsoft’s President Brad Smith explainsthe shortcomings of this approach: “[Paying] someone not to cut down the trees on the land theyown.is a good thing, but in effect it pays someone not to do something that would have a negative
NET-ZEROThe Next Frontier for Corporate Sustainability18impact. It doesn’t lead to planting more trees that would have a positive impact by removingcarbon.” While some offset programs do include carbon removal activities such as planting trees,these are less common, difficult to verify, and take a long time to become effective. Relying onoffsets alone does not prevent a company’s GHG emissions from accruing in the atmosphere. Theyshould be used primarily to neutralize any remaining emissions that are unfeasible for a companyto reduce or permanently store after the company has employed meaningful emissions reductionpractices for its own operations. Energy efficiency projects: This table stakes approach entails LED lighting retrofits, HVACupgrades, infrastructure upgrades, demand metering, occupancy sensors, and other basicstrategies to reduce the amount of energy needed to power company-owned buildings andoperations. Almost all of the S&P 100 are engaged in some form of energy efficiency projects. Negative emissions: Distinctive from carbon offsets, which are administered through a third-partyorganization, negative emissions entail direct corporate activity to sequester and permanentlystore GHG from the atmosphere. Microsoft leads in this category and recently launched a 1 billionClimate Innovation Fund to accelerate the global development of carbon reduction, capture,and removal technologies. The company plans to remove all of its historical emissions sincethe company’s founding in 1975 by the year 2050. In theory, this represents a very promisingopportunity for reaching sustainable levels of atmospheric carbon, but in practice it is complicatedby technical feasibility, commercial viability, disruption to the earth during the storage process,and open questions about the permanence of such storage. When done correctly, this can be verypowerful, but it has not yet been proven with certainty to be an effective, scalable strategy. Carbon pricing: Incorporating the cost of GHG externalities into the selection of projects andsuppliers can help to embed emissions reduction into the core strategic decision-making of acompany. Only a handful of S&P 100 companies discuss this practice. Dow integrates carbonpricing into business planning and prioritizing capital projects, and Philip Morris similarly uses aninternal carbon price of 17 per metric ton to allocate its capital. Microsoft, which spearheadedthis approach by implementing an internal carbon fee in 2012, has taken this one step further byactually charging internal business units and suppliers based on their price of 15 per metric ton,whereas Dow and Philip Morris use the pricing theoretically to compare across projects. Renewable energy: Often one of the biggest drivers of a company’s emissions, energy representsa significant opportunity for emissions reduction. To facilitate and structure a path to renewableenergy, the RE100 initiative oversees a pledge for corporations to commit to 100% renewableenergy by a specified date, no later than 2050, in keeping with the Paris Agreement timeline. 29of the S&P 100 companies have signed on to the pledge, with dates ranging from 2014 to 2050.Biogen, Microsoft, and Alphabet lead the way in this category, followed by a series of financialservices companies. Supplier partnerships: More sophisticated sustainability strategies involve upstream anddownstream partnerships to reduce emissions throughout the entire value chain. For example,MetLife required all 103 of their suppliers to disclose their GHG emissions and emissions reductionactivities publicly in 2019. McDonald’s works with farmers, ranchers, beef suppliers, and industry
NET-ZEROThe Next Frontier for Corporate Sustainability19leaders to identify and share best practices on farming, grazing, and conservation. Kraft Heinzmaps its complete supply chain of palm oil and soy to assess and mitigate deforestation risks.Salesforce has committed that its suppliers representing 60% of its Scope 3 emissions willset science-based targets by 2024. These efforts to exp
3 NET-ZER The Next Frontier for Corporate Sustainability Our goals are to: 1 inspire companies to learn best practices from their peers on the path to 'net zero,' 2 provide a publicly available data source and collection of insights for academics, nonprofits, think tanks, corporations, and others to study, and 3 empower concerned global citizens and consumers with information on the .