Transcription
SUCCESS WORKBOOKFine tune yourServiceNowplatform with regularperformanceadministrationDeveloped by the ServiceNow Best PracticeCenter of ExcellenceMarch 2022
SUCCESS WORKBOOKWhat is ServiceNow maintenance andperformance tuning?While we monitor your instance hardware in our data centers, everyorganization makes configurations to their environments that canaffect them individually. If left completely unattended, small issuescan build up over time and can cause performance problems,difficulty upgrading to new releases, or issues when deployingadditional applications. This workbook will provide guidance on how tokeep your instances fine tuned. Steps included are: Check for configuration that is not best practice Review your log data for errors and warnings Maintain your tables for peak performanceWhy should I invest in topic?W ith effective maintenance, you can improv e both the upgradeability andscalability of your Serv iceNow instance as well as ensure that you don’t hav eperformance issues related to your configurations.What will this workbook help me do?Serv iceNow instances can be like cars—two people can own the same model,year, and make of a v ehicle, but depending on how they use, maintain, andcustomize it, they could hav e two entirely different experiences with the car.Perform the tasks in all fiv e of the following steps as they are explained in theworkbook in order to keep your instance running optimally.Step 1 – Daily instance maintenanceStep 2 – W eekly instance performanceStep 3 – Monthly instance performanceStep 4 – Quarterly instance performanceStep 5 – Keep your instance continually improv ingHow to use this Success WorkbookThis workbook will guide you through the steps to get started with ServiceNowgov ernance.Start by reading through the W orkbook Checklist and rev iew the steps andtasks to get started with ServiceNow gov ernance. From the checklist page, youcan either proceed through the workbook page by page or nav igate only tothe sections that you need using the hyperlinks.Each section includes “check your progress” questions that you can answer totest whether you need to complete the tasks listed on that page or if you’v ealready done so and should mov e forward. Hyperlinks are included throughoutthe workbook so you can nav igate back and forth between the checklistpage and different sections.2
SUCCESS WORKBOOKWorkbook Checklist: Fine tune your ServiceNowplatform with regular performanceadministrationStep 1: Daily instance maintenance Rev iew the System Diagnostics homepageRev iew the prev ious day’s slow transactionsConsider you use casesStep 2: Weekly instance maintenance Rev iew your scheduled jobsCheck for repeated errors in the error logLook for excessiv e loggingFind log files ov er 1 GBFind slow-running running jobsFind long-running jobsTrend your top 20 transactionsStep 3: Monthly instance maintenance Monitor your table growth ratesClean your tablesClean your tablesStep 4: Quarterly Instance performance Check for coding that could impact your ability to upgradeStep 5: Keep your instance continually improving Find and fix issues with your end to end response time3
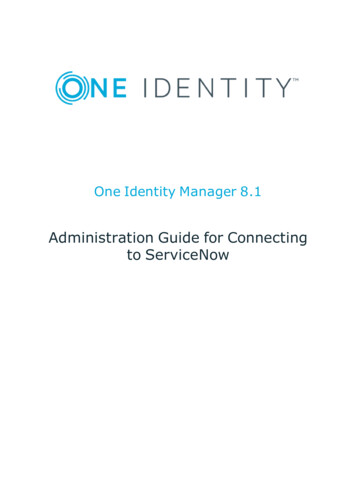
SUCCESS WORKBOOKStep 1: Daily Instance MaintenanceWhat’s slowing you down might be simple to find. Check the threefollowing areas to see if your transactions or data pulls are issues.Check your progress: Do you hav e a daily routine for monitoring your instances’ health? Do you check for errors in your systems diagnostics? Do you receiv e total response times for transactions? Do you monitor users who are pulling large data sets and rev iew theirbusiness need?If you answered “yes” to the questions abov e, proceed to the next step. If not,complete these action steps to complete this step:1.Review the System Diagnostics homepageThe System Diagnostics page tracks some high-lev el statistics for each ofthe nodes (JVMs) in your instance. (See Figure 1.)W hen you rev iew this information, don’t worry if the total number of JVMClasses differs between nodes. This metric is showing the number of classesthat hav e been loaded and subsequently unloaded on each JVM.Depending on the activ ities users performed on each node, you mightnotice a legitimate disparity in what has been called since that JVM waslast started.a) Go to the System Diagnostics homepage.b) Rev iew the v alues on this page. You’ll see v alues either in real time atthe point the page is rendered or as cumulativ e counts (such as thetransactions and error v alues) since the node was last started (see theJVM UP time).c) Track this information in a spreadsheet or a table in your instance.Include the uptime, number of errors since the last restart, the numberof transactions performed, and the number of logged-in users for eachnode. W hile the Now Platform does hav e built -in performancegraphs that show this information, they’re rendered on a per-nodebasis. If you spot an uncharacteristic jump in these numbers, it can bea good indicator there is an underlying performance issue you need toidentify and address.4
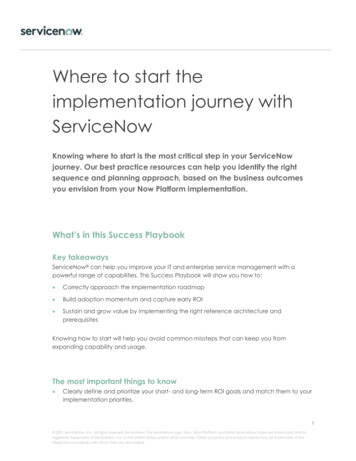
SUCCESS WORKBOOKFigure 1: System Diagnostics homepage2.Review the previous day’s slow transactionsThe Serv iceNow system logs module prov ides a v ariety of logs that you can use totroubleshoot and debug transactions and ev ents that take place within the instance. Thetransaction logs in the system logs table records all browser activ ity for an instance. Seeimage below:Figure 2: Access transaction logs through system logs table5
SUCCESS WORKBOOKBy rev iewing all users’ transaction information, you can see which transactions are taking more thana reasonable amount of time. Before you start, ensure you hav e the Client Transaction Timingsplugin enabled to capture all the data. Also note, depending on the size of your instance, this tablecan be huge and may time out before the results load, so ensure you load it with'sysparm filter only true' then specify a filter to start looking at results.In the list of transactions, you can v iew the total response times along with: A breakdown of the composite parts – This includes the time spentrendering in the browser, time spent on the serv er processing thetransaction, and calculated time spent in the network. The details of which node processed the request The IP address of the host making the request The user making the request W hen the transaction occurred The session ID – Since this is also captured, it’s possible to rev iew theapplication logs to dissect ev ery action a user has performed in their session.Look for: If there is a particular time of day when transactions execute slowly If these transactions are all being processed by the same node – Thissuggests one or more transactions or background jobs are consuming largequantities of memory. If the transaction response times are poor across all nodes – This typicallysignifies the database was working harder than usual, impacting alltransactions.You might notice that the top 10 slowest transactions were all issued by a singleuser and are incident lists. If that’s the case, you can rev iew the user’s settingsor impersonate that user and try to recreate the issue.You may also want to filter transactions by URL to analyze the slow transactions.Additionally, reporting on aggregate response times can be a powerful way totrack how ov erall instance performance is changing with time.For more detailed instructions on how to work with the transaction logs, see ourproduct documentation site.3.Consider your use casesHow much data do your users truly need to rev iew in a single screen? Ifyou identify that your list transactions are slow, find out how much datayour users are requesting. W hen a user selects “Show 100 rows per page”on a list, this sets a user preference. From that point forward, ev ery timethat user runs a list v iew, it will include 100 rows. This includes related andembedded lists on forms as well as the list v iews where the user set thepreference.6
SUCCESS WORKBOOKFigure 3: User chooses to show 100 rows per pageIf you hav e a sufficient number of users who are requesting high numbers of rows, you could experiencea platform wide performance degradation because those row counts are making high demands on theJVM memory required to render the lists.This becomes problematic when a table with many reference fields must render a list. The platform has tobuild the relationships for all the reference fields for all the rows displayed on screen.For most serv ice env ironments, agents can’t practically use more than 20–30 rows at a time. If the pageload is fast, you can make a good case for “paging” to the next chunk of results rather than scrollingdown. Consider to use the ‘Glide.ui.per page’ property to define the items per page drop down optionsthat are v isible for users.Figure 4 Glide.ui.per page propertyConsider remov ing any options for more than 50 rows at a time from the Now Platform. Forfurther details, v isit our knowledge base for an article called “Good practices to improv einstance performance through Rowcount, Related Lists and Dashboards.”Return to workbook checklist7
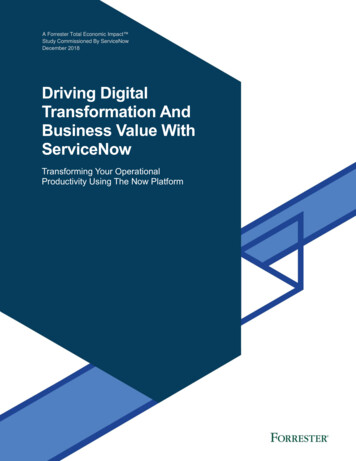
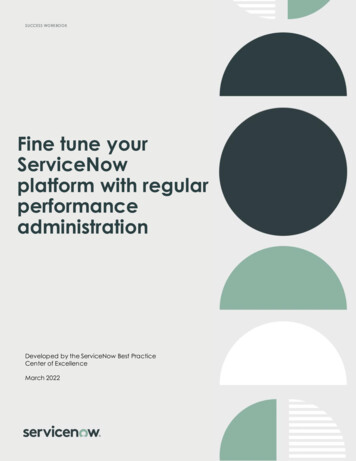
SUCCESS WORKBOOKStep 2: Weekly Instance performanceIf routine tasks have become a problem, finding errors, warnings, large log files,and slow jobs will help you get those tasks running smoothly.Check your progress: Do your scheduled jobs run smoothly? Do you regularly inv estigate repeated errors and warning in your logs? Do you hav e a process to monitor users logging excessiv ely and large logfiles? Do you regularly check for slow running jobs?If you answered “yes” to each question abov e, proceed to the next step. If not, completethese action tasks:1.Review your scheduled jobsBy rev iewing your scheduled job activ ity, you can help ensure thatbackground activ ities, such as scheduled reports, discov ery sensors, andother routine tasks, run smoothly. Check for anything that's running formore than an hour (3,60,000 ms)a) Nav igate to System Logs Transactions (Background)b) Apply a filter with the following conditions (see Figure 3):i.Created on This weekii.URL starts with JOBiii.Response time Greater than 360000NOTE: The response may take sev eral minutes to return. If you don’treturn any results for an hour, try the same steps again with amore stringent v alue such as a half hour (18000 ms) Of course,some scheduled jobs are going to take a long time because theyhav e a lot of work to process. Due to how the transaction logtables are stored and rotated in the database, it is not possible touse the “group by” function in the list v iew. Because of this, youmay find it easier to do you trend analysis by exporting the resultset to Excel.c) If you see a job that has executed multiple times for a long duration,drill down into what the problem is. The most common culprits are gliderecord queries, which request information from large tables with unindexed “where” clauses or sorts/groups. These are often found insideof scripted transform maps and sometimes inside of script includes orbusiness rules.8
SUCCESS WORKBOOKFigure 5: Filter showing all job transactions created in the current week that tookm ore than 360,000 m s to com plete2.Configure scheduled jobs to use “Burst” scheduler workersTo insulate against backed up scheduler worker queues, set the Priorityfield on the sys trigger entry for the scheduled job to 25. This ensures thatthe core jobs—ev ent processors, SMTP sender, POP reader, and SMSsender—get triggered in a timely fashion. Should all the scheduler workersbe busy with other jobs, an “important” job, which is more than 60 secondspast due, will spawn a “Burst” scheduler worker and execute in parallel tothe core eight schedulers on the node.Practitioner insight: Using “Burst” scheduler worker is good insulation,but don’t use it as an excuse to av oid addressing the root causes ofthe other long-running or high-v olume scheduled jobs.3.Check for repeated errors in the error loga) Nav igate to the System Log.b) Select Errors.c) Look for actionable errors as well as frequency within the warning messages.d) Look for an increased v olume in the number of errors by checking the total number inthe top right corner of the screen.e) If you see a message likeorg.mozilla.javascript.gen.sys script include 5daa9bf593233100fa71b33e867ffb9b script 2555.call(sys script include 5daa9bf593233100fa71b33e867ffb9b.script, you candiscov er more about the error by examining the script include record with that sys id.f)Look for repeated errors in the warnings logI.Nav igate to the System Log.II.Select Warnings.III. Look for actionable warnings as well as frequency.IV. Based on the warnings you see, you may be able to search through a sys script forthe text output.9
SUCCESS WORKBOOK4.Look for excessive loggingNext, look for unusually large log files. This is a relatively crude—butsurprisingly accurate—way to spot potential problems that warrant closerattention.a) Nav igate to Utilities Node Log File Download.b) Apply a Name starts with local filter. This will show you all theapplication logs for the node your session is activ e on.c) Note that the most recent fiv e days of log files are unzipped, and theremaining files are zipped. The size v alue is measured in KBs. If younotice that one day is significantly larger than the others, or that thereis a progressive increase in file size, you may need to inv estigatefurther.Practitioner insight: The application logs all transactions andassociated parameters, so if the number of users has ramped up ora new piece of functionality has gone liv e, the log files will naturallyincrease.5.Find log files over 1GBLog files ov er 1 GTB may suggest possible frequent errors or logging issues that you need tofix.a)First, look for a significant spike in log file size.b)Note: This may indicate that the gs.log or gs.pirnt statements ,which were used in subproduction testing, hav e not been remov ed. Unnecessary logging makes the tablesbulky, which slows maintenance activ ates, like backups, and makes searching thesyslog table slow and cumbersome. If that’s the case, try to remov e the gs.log and/orgs.print statements (unless you need them) and complete steps 1-4 again.c)Find the log files that are ov er 1 GB.Figure 6: A log file over 1 GB10
SUCCESS WORKBOOK6.Find slow running jobsa) Apply a Nav igate to the System Scheduler.b) Select Slow Job Log.c) View the job details in the URL and Response time columns.d) Check the SQL time column for the time the job has been in thedatabase.e) Check the Business rule time column for the amount of time the jobhas been in logic (execution).f)Right-click the Response time column heading and select Sort (z to a).g) Rev iew the Response time, SQL time, and Business rule time to look forsuspiciously long run times.Figure 7: Exam ple of a Slow Job log7.Find long running jogsa)Nav igate to User Administration.b)Select Active Transactions.c)If there is a background job running, it will show in the User column. Check the Agecolumn to see how long it’s been running.d)To kill a job that’s been running for too long or seems to be completely stuck, right-clickthe User name and select Kill. Only kill a job if you are ABSOLUTELY sure it is a stuck orillegitimate long running job.e)A confirmation message will appear at the top of the list.11
SUCCESS WORKBOOKFigure 8: Right-click m enu for killing a stuck job8.Trend your top 20 transactionsCreate a spreadsheet to trend your top 20 transactions. These may constitute the 20 mostexecuted transactions in a giv en week. Or you may choose to track the most business critical transactions (like incident or catalog transactions). Or it may be helpful to trend amixture of these. Keep tracking data week after week .Refer to this knowledge base article on the Now Support Portal for adv ice on how toinv estigate the performance of indiv idual transactions.Return to workbook checklist12
SUCCESS WORKBOOKStep 3: Monthly Instance performanceDon’t let slow queries or transient data bog down your performance.Practice these monthly reviews to avoid those issues.There are broadly two types of data stored in your ServiceNowinstance: Persistent data that you want to retain, such as a task or user info Transient data that needs to be cleared after a given time frame,such as log information or staging data for imports or integrationsIt’s normal to see persistent data growth over time. But when you seeincreased table sizes along with a decreased response time, you mayhave list definitions or glide record queries that need to be refactoredor indexed so you can accommodate the data growth.If there’s an increase in response times for end users and an increase inexecution time for maintenance tasks such as cloning, backup, andrestore, it probably means your data sets are growing. If that’s thecase, it’s important to monitor your table growth on a monthly basis. Ifyou created a spreadsheet to track your top 20 request responsetimes, you can extend it to track the number of rows rendering in yourtables, as well as your slow queries, so you can track their improvementover time.Check your progress: Do you regularly track table growth? Do you purge or archiv e data that is no longer needed in the activ esystem? Do you rev iew slow queries that might indicate a table that needs to beindexed?If you answered “yes” to each question abov e, proceed to the next step. If not, completethese action tasks:1.Monitor your table growth ratesW hen you check your table growth, you’ll look for two things:a) Dramatic changes in size from month to monthb) The total number of records in your tablesFollow these steps:a) Nav igate to System Definition.b) Select Tables.c) Your list of tables appears on the screen.d) Filter the table information typing u in the box. This willshow you all the user-created tables .e) To see the total number of records in a table, type nameof table .list in the nav igation field at the top left of thescreen.13
SUCCESS WORKBOOKFigure 9: A table list showing a total of four tablesf)Look for a dramatic change between the prev ious month and thismonth. If you see an increase, you may need to inv estigate why thespike occurred.g) Check the total records.If the total number of records in your tables is ov er 50K, you mayneed to complete one of these tasks or a combination of them: Index the fields used in filters or other queries – To determine ifyou need to index fields, rev iew the Slow Queries log. If you findslow queries, contact ServiceNow for support about indexing. Set up table rotation with from ServiceNow technical support –For more information, read the next section and our productpage on table rotation. Extend large tables to store more data or as a part of a tablerotation process – For more information, read our product pageexplaining table extension for data retention. Clean tables by purging rows – For more information, read thenext section.Practitioner insight: To see the total size of your database and the10 biggest tables, use the Database Footprint service catalog itemon the Now Support portal.2.Clean your tablesTo list the data you may want to purge (such as incidents older than oneyear):a) Type incident.list in the left nav igation field, or typehttps:// instancename .serv ice-now.com/ incident list.do into yourbrowser’s address bar.b) A count of the records will display.c) You may want to amend your show x records preference to 10 or 20 tospeed up the list rendering time.14
SUCCESS WORKBOOKPractitioner insight: If you discov er that you need to purge morethan one million records, submit a ticket on the Now Support portalto handle the purge. Purging them yourself could cause an outageor other issues.3.Review the slow queries logThe Slow Queries log aggregates the data for similar queries.The platform records any SQL statement where the totalexecution time exceeds fiv e seconds.Not ev ery slow query is a concern—you can expect to hav e afew. The slow queries on user created tables, those that beginwith “u ,” are the ones that are cause for concern. Dramaticchanges in size from month to month could indicate an issue.a) Nav igate to System Diagnostics Stats Slow Queries tosee your Slow Queries log. The platform records any SQLstatement that takes more than 100ms to complete. TheSlow Queries log groups these transactions into similarpatterns, prov iding you with an example set of parametersFigure 10: A Slow Queries log15
SUCCESS WORKBOOKb) Type u in the Example text boxFigure 11: A Slow Query log showing the Exam ple text box.The slow query log records the queries’ patterns since the beginning of time (orsince the last time sys query pattern was truncated). You may find the resultsmore meaningful by applying a filter to show only patterns that were firstsighted in the last month and that occurred more than 100 times.If you click through to an indiv idual query pattern record, you’ll see anexample URL where the query was generated, the first and last sighting, thenumber of executions, and the av erage execution time.The stack trace of the thread executing the query also displays. From here:a) Cross-reference which element on the screen requested the information.b) Once you know this, you can rev iew the gauge or list that made the calland v erify whether it would benefit from refactoring or supporting with anindex. Many times, you can significantly reduce the execution time bysimply adding active 1 to a query. This will only query and return activ erecords, thus reducing the number of records included in the query.Return to workbook checklist16
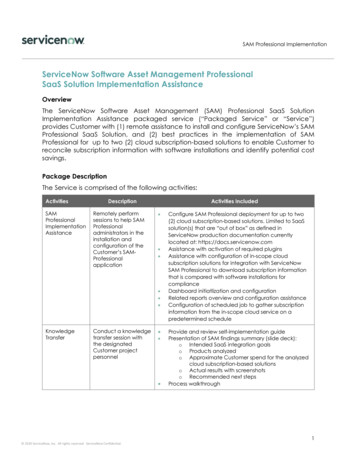
SUCCESS WORKBOOKStep 4: Quarterly Instance performanceRunning a quarterly rev iew of your upgrade history can tell you a lot aboutyour instance performance as you can see issues/performance trending ov ertime.Check your progress: Hav e you checked your skipped, inserted, updated, and deleted recordsfor unusual behav ior such as odd growth patterns, mass deletes, etc.? Do you monitor changes or customizations to ServiceNow out of the boxobject?If you answered “yes” to each question abov e, proceed to the next step. Ifnot, complete these action steps:1.Check your instance for any configurations that could impact yourupgradesa) Nav igate to System Diagnostics.b) Select Upgrade History.c) A table showing your upgrade history appears. Under the Upgradestarted column, look for the last upgrade and select it.d) W ithin the upgrade record, check the Skipped Changes to Review tabto see what was skipped, updated, inserted, or deleted.Figure 12: An upgrade record showing the Skipped Changes to Review tabe) Rev iew the name of the table and the sys id of the recordto see exactly what was skipped and where it was skippedfrom.f) Check the type of object that was skipped. If the upgradeskipped an out-of-the-box object, consider rev erting thatobject so it is updated with ev ery upgrade.Return to workbook checklist17
SUCCESS WORKBOOKStep 5: Continually improve your instanceSo far, all the activ ities mentioned in this workbook contribute to continuousimprov ement. Check out the tasks in this stage if you’re experiencing: Poor list response timesPoor form load and submit response timesPoor module response timesCheck your progress: Hav e you checked form load response time? Hav e you checked form submit time? Hav e you monitored modules response times?If you answered “yes” to the questions abov e, you hav e completed the stepsoutlined in the workbook. If not, complete these actions:1.Find out if low-response, form load, form submit, and module responsetimes are keeping your instance down.a) Nav igate to your used forms and select Incident.b) Select Create New.Figure 13: A new incident record with the end-to-end response tim e bar (bottom right corner)Return to workbook checklist18
SUCCESS WORKBOOKc) W hen the form opens, at the bottom right you will see thedetails of the end-to-end response time displayed by acolorful bar (see Figure 11), including: Response time (ms) – The total time between clickingCreate New and seeing the form loadNetwork – The total time spent ov er the wireServer – The total time spent processing the request onthe serv erBrowser – The total time the browser spent renderingthe form, including running the client -side scriptd) Click any of the elements of the end-to-end response timeto see its details. (See Figure 14.)Figure 14: An incident record showing end-to-end response time detailsIn the pop-up box, rev iew how much time each section, script,field, etc., took to load. This information helps you identify anypotential bad scripts or bottlenecks in your load times so you canaddress them.W hen you hav e slow form load times, the most common causesare: Related/embedded lists – To fix this, either look for a bad queryor filter or the number of rows you’re requesting. A high number of AJAX calls – You may want to consolidatethese into fewer round trips. An inefficient client-side script – Av oid synchronous AJAX callsor DOM manipulation.For additional assistance, check out:Troubleshooting performanceClient transaction timingsPerformance and performance debuggingReturn to workbook checklist 2021 ServiceNow , I nc. All right s res erved. ServiceNow, the ServiceNow logo, Now, Now Platform, and ot her ServiceNow marks are t rademarks and/orregis t ered t rademarks of ServiceNow , I nc. in the United St ates and/or ot her count ries . Other company and product names may be t rademarks of t heres pect ive companies w ith which they are as s ociat ed.19
Workbook Checklist: Fine tune your ServiceNow platform with regular performance administration Step 1: Daily instance maintenance Review the System Diagnostics homepage Review the previous day's slow transactions Consider you use cases Step 2: Weekly instance maintenance Review your scheduled jobs