Transcription
441 G St. N.W.Washington, DC 20548Accessible VersionMarch 31, 2017The Honorable Ron WydenRanking MemberCommittee on FinanceUnited States SenateThe Honorable Frank PalloneRanking MemberCommittee on Energy and CommerceHouse of RepresentativesMedicaid Managed Care: Compensation of Medicaid Directors and Managed CareOrganization Executives in Selected States in 2015In fiscal year 2017, Medicaid is projected to finance the health care coverage for an estimated74 million beneficiaries with estimated expenditures of 596 billion.1 State Medicaid directorsoversee the day-to-day operations of their state Medicaid programs, and are responsible for awide array of activities including benefit and payment determinations; procurement of services;and processing of claims for fee-for-service (FFS) delivery services and making payments tomanaged care organizations (MCOs). Executives of MCOs have a variety of responsibilities indelivering services to Medicaid beneficiaries, some of which are similar to those of stateMedicaid directors and others that are different. For example, a MCO executive may overseethe enrollment and payment of providers in managed care—similar to what a state Medicaiddirector might do for the state’s FFS operations. However, MCO executives may also overseemarketing functions, manage operations across multiple states, or address the capital needs ofthe organization.2 As of July 2014, almost 77 percent of total Medicaid enrollment was in sometype of managed care arrangement.3 MCOs can be for-profit or nonprofit, stand-alone plans, orthey can be members of a group of insurers or other holding companies.1Medicaid, a joint federal-state health program for low-income and medically needy individuals, finances the deliveryof health care services to beneficiaries through fee-for-service (FFS) payments to participating providers andcapitated payments to Medicaid managed care organizations (MCOs). Under managed care arrangements, statescontract with MCOs to provide certain services to beneficiaries. States may use other Medicaid managed carearrangements, such as prepaid inpatient health plans (PIHP) and prepaid ambulatory health plans (PAHP); theseplans are not included in this report.Spending for Medicaid managed care has grown significantly, representing over one-third of federal spending onMedicaid in 2014.Office of the Actuary, Centers for Medicare & Medicaid Services, United States Department of Health and HumanServices: 2016 Actuarial Report on the Financial Outlook for Medicaid, (2016).2Under the managed care delivery model, states typically contract with MCOs to provide a specific set of Medicaidcovered services to beneficiaries and pay them a set amount per beneficiary per month to provide those services.3The most recent year for which enrollment data were available at the time of the report was 2014. Percentagerepresents enrollment in all types of managed care, which, according to Centers for Medicare & Medicaid Servicesofficials includes MCOs, PHIP, PAHP, Program of All Inclusive Care for Elderly (PACE), and Primary CaseManagement.Page 1GAO-17-427R Medicaid Managed Care Compensation
You requested that we examine executive compensation in Medicaid managed care. This reportexamines what is known about the 2015 compensation of Medicaid directors and top paid MCOexecutives in selected states offering Medicaid managed care.To determine what is known about the 2015 compensation of Medicaid directors and top paidMCO executives in states offering Medicaid managed care, we judgmentally selected 10 statesthat offered comprehensive, risk-based managed care in 2015.4 These states had varying levelsof Medicaid enrollment in managed care, but at least 50 percent in 2014; required at least someof their MCOs to file National Association of Insurance Commissioners (NAIC) annual financialreports; and were geographically diverse.5 We collected the 2015 compensation—salaries andadditional benefits—of Medicaid directors in the 10 selected states by reviewing the 10 states’websites for compensation data. Where necessary, we also contacted officials of the Medicaidprograms in those states to obtain compensation information. We obtained information on thesalaries of the Medicaid directors from all 10 states and information on additional benefits from 9of the states. The information we gathered cannot be generalized to other states.We collected information about the 2015 compensation—salaries and supplementalcompensation, such as stock options—of top paid MCO executives in the 10 selected states.We did so by reviewing two applicable sections of the NAIC financial reports that the MCOs filedwith their state’s office of insurance for 2015.6 These sections provided information on thecontribution of Medicaid premiums to total MCO revenues and executive compensation.7 Weobtained all requested NAIC files from 9 states. We selected MCOs whose Medicaid premiumscontributed more than half of their total revenue in 2015. We excluded MCOs that weremembers of a group of insurers or other holding company system and that reported the amountof the executives’ compensation that was allocated to the specific MCO in the state, rather thanthe entire compensation these executives received in 2015. This was the case for all MCOs in 2States may have different types of managed care arrangements in Medicaid. In this report, where we refer toMedicaid managed care, we are referring to comprehensive, risk-based managed care, the most common type ofmanaged care arrangement.4For purposes of this report, we refer to “top paid” executives as those executives who either acted as principalexecutive officer or principal financial officer, or similar capacity, or whose total compensation exceeded 100,000 in2015.5The 10 selected states were Florida, Hawaii, Indiana, Louisiana, Massachusetts, New Mexico, New York,Tennessee, Washington, and Wisconsin.NAIC is the United States standard-setting and regulatory support organization created and governed by the chiefinsurance regulators from the 50 states, the District of Columbia, and five U.S. territories. Through NAIC, stateinsurance regulators establish standards and best practices, conduct peer review, and coordinate their regulatoryoversight. States’ offices of insurance may require insurance plans to file annual financial statements using NAIC’sfinancial report.6In MCO executives’ compensation we included salary paid, bonuses, stock awards, option awards, sign-onpayments, and severance payments. We excluded other benefits the executives might have received in 2015, suchas MCO contributions to vested and unvested defined contribution plans and the dollar value of any insurancepremiums paid by, or on behalf of the MCO because we did not have similar information for Medicaid directors.7We identified MCOs that served Medicaid beneficiaries in the 10 selected states in 2015 by contacting Medicaidofficials in these states. We requested from the states’ offices of insurance in 9 states and a state’s Medicaid programtwo files that are part of MCO’s NAIC financial reports. Specifically, we requested the NAIC financial reports’Supplemental Compensation Exhibit, which represents information on the compensation of the principal executiveand financial officers and other top paid executives, and Schedule T, which includes information on the portion of theMCOs’ revenues attributable to Medicaid premiums.Page 2GAO-17-427R Medicaid Managed Care Compensation
states, and therefore we do not provide MCO executive compensation for these 2 states. Weexcluded executives whose total compensation was within the top and bottom 5 percent of totalcompensation of all executives in order to minimize the number of outliers in our data. Weanalyzed NAIC compensation data for the remaining 133 executives in 15 MCOs in 7 selectedstates.8 The results are not generalizable to executives in other MCOs or other states.We also interviewed former Medicaid directors about their compensation as Medicaid directorsand MCO executives, and reviewed reports with national data and related information onMedicaid directors’ compensation. To select the former Medicaid directors, we used an iterativeprocess to identify former Medicaid directors who then became MCO executives, and selectedfor interviews those who would provide us with perspectives on their experiences andcompensation both at the state and MCO level.9 We also obtained national data on Medicaiddirectors’ compensation and tenure by interviewing officials at the National Association ofMedicaid Directors (NAMD), and obtained and reviewed NAMD’s national data from their annualoperations surveys.10 We also reviewed recent reports on Medicaid managed care andMedicaid directors’ compensation.11We conducted this performance audit from May 2016 to March 2017 in accordance withgenerally accepted government auditing standards. Those standards require that we plan andperform the audit to obtain sufficient, appropriate evidence to provide a reasonable basis for ourfindings and conclusions based on our audit objective. We believe that the evidence obtainedprovided a reasonable basis for our findings and conclusions based on our audit objective.Medicaid Directors Earned Less than Most Top Paid MCO Executives in SelectedStates in 2015In 10 selected states, the average salary for Medicaid directors in 2015 was 152,439, whichwas less than the 236,007 average salary paid to MCO executives in 7 of these states.However, according to MCO executives who were former Medicaid directors, their roles andresponsibilities as Medicaid directors were generally more complex and time consuming thantheir roles as MCO executives.Medicaid Directors’ Compensation in 2015 was Less than Most Top Paid MCOExecutives in Selected StatesMedicaid directors’ salaries in the 10 selected states ranged from 103,020 to 260,088, with anaverage of 152,439 and a median of 141,000 in 2015. Our data on the 10 selected states is8MCOs reported compensation information in various levels of detail. MCOs generally did not identify thoseexecutives for whom the reported compensation did not represent the entire year. For example, there were instanceswhen an executive only worked for part of the year; in such cases, the reported information only representedcompensation paid for the portion of the year during which the executive was employed with the MCO.9At each interview, we solicited names of additional former Medicaid directors who then became MCO executivesand who the interviewees thought would be useful to interview, ending the process after interviewing eight formerMedicaid directors. This process is often referred to as “snowball sampling.”10National Association of Medicaid Directors (NAMD), State Medicaid Operations Surveys, 2012-2016.11Medicaid and CHIP Payment and Access Commission (MACPAC), Report to the Congress on Medicaid and CHIP(Washington, D.C.: June 13, 2014); and Andy Allison, Milbank Memorial Fund, The Role of State Medicaid Directors:A Leadership Imperative (New York, N.Y.: 2015).Page 3GAO-17-427R Medicaid Managed Care Compensation
generally consistent with national data collected by NAMD on the salaries of Medicaid directors.Specifically, NAMD found that Medicaid directors made between 105,000 and 260,000, withan average of 152,518 and a median of 142,000 in 2016. In addition, data from the 9 selectedstates that provided us with information on additional benefits provided to Medicaid directorsindicated that Medicaid directors in those states received health insurance, paid leave, and lifeinsurance in 2015 in addition to their salaries.12 Table 1 provides information on the 2015benefits in addition to salary of Medicaid directors in 9 of the 10 selected states.Table 1: Type of Benefits in Addition to Salary Provided to Medicaid Directors in Selected States, CalendarYear tLongOthertermtermbenefitsdisability disabilitySource: GAO analysis of state Medicaid information. GAO-17-427RNote: None of the nine states indicated that any additional cash benefits, such as bonuses or awards were providedto their Medicaid director in 2015.According to the Supplemental Compensation Exhibits submitted by selected MCOs that wereviewed, the top paid executives’ total compensation—salaries and supplementalcompensation—in 2015 ranged from 110,740 to 1,904,431, with an average of 314,278 anda median of 270,713.13 The 2015 salaries paid to 133 top paid executives in seven of theselected states that we included in our analysis ranged from 108,598 to 796,732, with anaverage of 236,007 and a median of 229,442.14 In addition to their salary, these executives12We did not collect information on the dollar value of the additional benefits.13We also analyzed the executive compensation data by type of MCO. Specifically, we examined the data to identifyany major differences in compensation between for-profit and nonprofit MCOs, and among MCOs with different levelsof contribution of Medicaid premiums to the MCO’s overall revenues. This analysis did not identify any majordifferences among the types of MCOs we examined.14The NAIC files show the amounts paid for the time the executive worked for the MCO in 2015. Therefore, they mayrepresent salaries and compensation paid for less than one year.Page 4GAO-17-427R Medicaid Managed Care Compensation
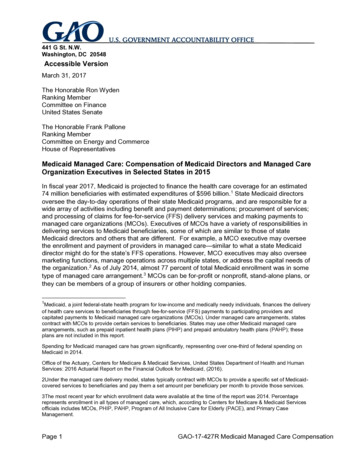
received supplemental compensation, such as bonuses, stock awards, and option awards,adding an average of about 78,271.15Based on our analysis, the 2015 salary of Medicaid directors was lower than most top paidMCO executives in 6 of the 7 selected states for which we had MCO executive compensationdata. Overall, the Medicaid directors’ average salary was 84,645 less than the MCOexecutives’ average salary, and 162,916 less than the average total compensation. Table 2shows the Medicaid director’s salary in each of the 10 selected states compared to averageMCO executive’s compensation.Table 2: Medicaid Directors’ Salaries and Selected Managed Care Organizations’ (MCOs) Top PaidExecutives’ Compensation Paid, in Selected States, Calendar Year 2015b,cState12345678910Average2015 Medicaidadirector salary 140,000 119,932 171,710 142,000 210,000 146,400 260,088 103,020 116,084 115,156 152,4392015 MCO executives’ compensation paidNumber ofAverage totalexecutivesAverage salary paidcompensation paid29 285,559 385,06028 169,605 191,744ddd171027 194,953 186,017 265,211 263,697 200,518 318,973ddd202 255,749 454,325 320,869 1,872,855dddN/A 236,007 314,278Source: GAO analysis of data obtained from selected states’ websites or provided by selected states’ Medicaid andoffice of insurance officials. GAO-17-427RNote: For purposes of this report, we refer to “top paid” executives as those executives who either acted as principalexecutive officer or principal financial officer, or similar capacity, or whose total compensation exceeded 100,000 in2015.aThe Medicaid director’s salary for one of the 10 selected states was for fiscal year 2015. The rest of the salarieswere for calendar year 2015.bThe data on MCO executives’ compensation generally does not indicate whether the executives worked for theentire year in 2015.Therefore, the figures presented represent the amounts paid for the time the executives worked atthe plans.cIn MCO executives’ compensation we included salary paid, bonuses, stock awards, option awards, sign-onpayments, and severance payments. We excluded other benefits the executives might have received in 2015, suchas MCO contributions to vested and unvested defined contribution plans and the dollar value of any insurancepremiums paid by, or on behalf of the MCO, because we did not have similar information for Medicaid directors.dExecutive compensation information is not presented for 3 of the 10 states. Selected MCOs in 2 of the 3 states wereexcluded from our analysis, because they were members of a group of insurers or other holding company system andonly reported partial compensation for their executives.The compensation they reported for their executives was theportion of the executives’ total compensation that was allocated to the specific plan in the state, rather than the entirecompensation these executives received in 2015. The third state did not provide us with information on executives’compensation in selected MCOs.The total compensation paid to 109, or 82 percent, of the 133 executives in our selected MCOswas higher than the average Medicaid director’s salary, while the total compensation paid to 24executives, or 18 percent, was less. Figure 1 illustrates how the actual total compensation of the133 MCO executives in 7 selected states compares with the average Medicaid director’s salaryin the 10 selected states.15We excluded from our analysis other benefits the executives might have received in 2015, such as MCOcontributions to vested and unvested defined contribution plans and the dollar value of any insurance premiums paidby or on behalf of the MCO, because we did not have similar information for Medicaid directors.Page 5GAO-17-427R Medicaid Managed Care Compensation
Figure 1: Highest, Lowest, and Average Medicaid Director’s Salary and Selected Managed CareOrganizations’ (MCOs) Top Paid Executives’ Compensation Paid, in Selected States, Calendar Year 2015Notes: For purposes of this report, we refer to “top paid” executives as those executives who either acted as principalexecutive officer or principal financial officer, or similar capacity, or whose total compensation exceeded 100,000 in2015.The Medicaid director salary for one state was for fiscal year 2015. The rest of the Medicaid directors’ salaries werefor calendar year 2015.Compensation data for top paid MCOs is presented for 133 executives in the 15 MCOs in 7 of 10 selected states.Executive compensation information is not presented for 3 of the 10 states. Selected MCOs in 2 of the 3 states wereexcluded from our analysis, because they were members of a group of insurers or other holding company system andonly reported partial compensation for their executives. The compensation they reported for their executives was theportion of the executives’ total compensation that was allocated to the specific plan in the state, rather than the entirecompensation these executives received in 2015. The third state did not provide us with information on executives’compensation in selected MCOs.In MCO executives’ compensation we included salary paid, bonuses, stock awards, option awards, sign-onpayments, and severance payments. We excluded other benefits the executives might have received in 2015, suchPage 6GAO-17-427R Medicaid Managed Care Compensation
as MCO contributions to vested and unvested defined contribution plans and the dollar value of any insurancepremiums paid by or on behalf of the MCO, because we did not have similar information for Medicaid directors.Our review of the data suggests that at least some compensation figures reflect partial years—executives who were in their position in the selected MCO for only a portion of the year. Partialcompensation data would depress the overall average compensation figures for the MCOexecutives, as well as the difference between the Medicaid directors’ salaries and MCOexecutives’ compensation. Thus, the difference between the Medicaid directors’ salaries andMCO executives’ compensation would have been greater had plans reported a full year ofcompensation for all of the MCO executives.Former Medicaid Directors Said They Earned Less as Medicaid Directors and Had MoreComplex and Time Consuming Roles than They Experienced as MCO ExecutivesFormer Medicaid directors we interviewed said that their roles and responsibilities as Medicaiddirectors were generally more complex and time consuming than their roles as MCO executives.In addition, they said their compensation as Medicaid directors was lower than theircompensation as MCO executives. They described their responsibilities as Medicaid directorsas being numerous and diverse, including overseeingthe provision of several services—ranging from mental health services to long termservices and supports;· many programs—including different agencies and sub-agencies within their states thatmay be responsible for the various aspects of Medicaid;· two different Medicaid delivery systems, depending on the state—FFS and Medicaidmanaged care; and· different functions—including provider and beneficiary enrollment, payment rate setting,management of the claims processing system, program integrity audits, testifying incourt cases involving Medicaid, and negotiating contracts with MCOs.In addition, the former Medicaid directors said they were held accountable for their state’sMedicaid program to the federal government, their governor and legislature, the media, and thepublic. They added that they managed large budgets ranging from 3 million to 13 billion. Theformer directors said that their responsibilities were very complex and time consuming, requiringa range of skills including leadership, communication, flexibility, good negotiation ability, andknowledge of all Medicaid related issues and programs.·In contrast, the former Medicaid directors said that their roles as MCO executives weregenerally less complex and time consuming. They said that MCO executives develop strategyand oversee, develop, and run the MCOs’ functional areas. For example, they may beresponsible for overseeing specific functions, such as government and investor relations,Medicaid, expansion to other states, and business development. They said that they aregenerally not held accountable to various entities, such as state legislatures and the public, tothe same degree as Medicaid directors.The former Medicaid directors said that it is not uncommon for Medicaid directors to take higherpaying jobs in the private sector. They noted that MCOs often recruit Medicaid directors,because of their extensive programmatic knowledge and experience. One former Medicaiddirector said that this has resulted in a loss of institutional knowledge in state Medicaidprograms. The former Medicaid directors also commented that state Medicaid programs arehaving difficulty attracting new Medicaid directors with the right skills and programmaticPage 7GAO-17-427R Medicaid Managed Care Compensation
experience to fill vacant positions.16 In particular, they said that states usually have difficulty inraising the salaries of Medicaid directors in order to retain them or attract new individuals withthe right skills for the job. For example, two former directors said that states may be constrainedby state laws that cap Medicaid directors’ compensation, or concerns about negativeperceptions associated with raising the salary of the head of a social services program.National studies also suggest that Medicaid directors’ compensation is not competitive with thecompensation of individuals completing similar tasks in the private sector. For example, a 2015Milbank report noted growth in Medicaid and the related increase in the responsibilities andinfluence of Medicaid directors; on the other hand, it noted that Medicaid directors’compensation has been stagnant relative to the private sector.17 Similarly, a 2014 report by theMedicaid and CHIP Payment and Access Commission found that in the midst of increasingMedicaid program demands and complexity, state Medicaid programs are experiencing a “braindrain” as seasoned state Medicaid directors leave.18 The report concluded that high turnovercompromises the ability of the Medicaid program to sustain focus and achieve larger programgoals. According to national data that NAMD has been collecting through surveys of Medicaiddirectors since 2012, Medicaid directors’ responsibilities and budgets have been growing astheir salaries have remained flat, and tenure has been declining, often because Medicaiddirectors leave to join the private sector. For example, according to the NAMD data, Medicaiddirectors in 2016 had been in their position for a median of less than 2 years. This was downfrom a median of almost 4 years when compared to the states’ previous Medicaid directors,according to NAMD officials we spoke to. Also, according to the NAMD data, in 2016, fewerthan 27 percent of Medicaid directors had been in that position for over 2 years.19Agency CommentsWe provided a copy of this report to the Department of Health and Human Services (HHS) forcomment. HHS did not have any comments.As agreed with your offices, unless you publicly announce the contents of this report earlier, weplan no further distribution until 30 days from the report date. At that time, we will send copies tothe Secretary of the Department of Health and Human Services, and other interested parties. Inaddition, the report is available at no charge on the GAO website at http://www.gao.gov.16The former Medicaid directors said that new Medicaid directors often may join the program for a short time—enough to gain experience before taking a private sector job.17Andy Allison, The Role of State Medicaid Directors: A Leadership Imperative.18Medicaid and CHIP Payment and Access Commission (MACPAC), Report to the Congress on Medicaid and CHIP(Washington, D.C.: June 2014).19thNational Association of Medicaid Directors (NAMD), State Medicaid Operations Survey: 5 Annual Survey ofMedicaid Directors, (Washington D.C.: December 2016).Page 8GAO-17-427R Medicaid Managed Care Compensation
If you or your staffs have any questions about this report, please contact me at (202) 512-7114or yocomc@gao.gov. Contact points for our Offices of Congressional Relations and PublicAffairs may be found on the last page of this report. GAO staff who made key contributions tothis report are listed in enclosure I.Carolyn L. YocomDirector, Health CarePage 9GAO-17-427R Medicaid Managed Care Compensation
Enclosure I: GAO Contact and Staff AcknowledgementsGAO Contact: Carolyn L. Yocom, (202) 512- 7114 or yocomc@gao.govStaff Acknowledgments: In addition to the contact named above, Thomas Conahan (AssistantDirector), Pauline Adams (Analyst-in-Charge), Julie Flowers, Jacquelyn Hamilton, Drew Long,and Katya Rodriguez made key contributions to this report.(100814)Page 10GAO-17-427R Medicaid Managed Care Compensation
State Medicaid Operations Surveys, 2012-2016. 11. Medicaid and CHIP Payment and Access Commission (MACPAC), Report to the Congress on Medicaid and CHIP (Washington, D.C.: June 13, 2014); and Andy Allison, Milbank Memorial Fund, The Role of State Medicaid Directors: A Leadership Imperative (New York, N.Y.: 2015).