Transcription
6Quantitative TechnologyForecasting TechniquesSteven R. WalkOld Dominion UniversityUSA1. IntroductionProjecting technology performance and evolution has been improving over the years. Reliablequantitative forecasting methods have been developed that project the growth, diffusion, andperformance of technology in time, including projecting technology substitutions, saturationlevels, and performance improvements. These forecasts can be applied at the early stages oftechnology planning to better predict future technology performance, assure the successfulselection of new technology, and to improve technology management overall.Often what is regarded as a technology forecast is, in essence, simply conjecture, or guessing(albeit intelligent guessing perhaps based on statistical inferences) and usually made byextrapolating recent trends into the future, with perhaps some subjective insight added.Typically, the accuracy of such predictions falls rapidly with distance in time. Quantitativetechnology forecasting (QTF), on the other hand, includes the study of historic data toidentify one of or a combination of several demonstrated technology diffusion orsubstitution patterns. In the same manner that quantitative models of physical phenomenaprovide excellent predictions of systems behavior, so do QTF models provide reliabletechnological performance trajectories.In practice, a quantitative technology forecast is completed to ascertain with confidence whenthe projected performance of a technology or system of technologies will occur. Such projectionsprovide reliable time-referenced information when considering cost and performance trade-offsin maintaining, replacing, or migrating a technology, component, or system.Quantitative technology forecasting includes the study of historic data to identify one of or acombination of several recognized universal technology diffusion or substitution patterns.This chapter introduces various quantitative technology forecasting techniques, discusses howforecasts are conducted, and illustrates their practical use through sample applications.2. Introduction to quantitative technology forecastingQuantitative technology forecasting is the process of projecting in time the intersection ofhuman activity and technological capabilities using quantitative methods. For the purposesof forecasting, technology is defined as any human creation that provides a compellingadvantage to sustain or improve that creation, such as materials, methods, or systems thatwww.intechopen.com
104Technological Changedisplace, support, amplify, or enable human activity in meeting human needs. It will beshown how rates of new technology adoption and rates of change in technologyperformance take on certain characteristic patterns in time.A quantitative technology forecast includes the study of historic data to identify one ofseveral common technology diffusion or substitution trends. Patterns to be identifiedinclude constant percentage rates of change (such as the so-called “Moore’s Law”), logisticgrowth, logistic substitution, performance envelopes, anthropological invariants, lead/lag(precursor) relationships, and other phenomena. These quantitative projections have provenaccurate in modeling and simulating technological and social change in thousands ofapplications as diverse as consumer electronics and carbon-based primary fuels, on timescales covering only months to spanning centuries.Invariant, or at least well-bounded, human individual and social behavior, and selected(genetic) human drives underlie technology stasis as well as change. In essence, humans andtechnology co-evolve in an ecosystem that includes the local environment, our internalphysiology, and technology (where the technology can be considered external orcomplementary physiology). The fundamental reliability of quantitative technology forecastsis being supported by ongoing developments in modeling and simulation derived fromsystems theory, including complex adaptive systems and other systems of systems research.Carrying out a quantitative technology forecast includes selecting a technology of interest,gathering historic data related to changes in or adoption of that technology, identifyingcandidate “compelling advantages” that appear to be drivers of the technology change, andcomparing the rate of technology change over time against recognized characteristicpatterns of technology change and diffusion. Once a classic pattern is identified, a reliableprojection of technology change can be made and appropriate action taken to plan for ormeet specific technology function or performance objectives.QTF as defined here, as it seeks to determine the ‘fit’ of time-stamped growth or diffusion oftechnological data to ubiquitous yet mathematically simple models, does not includeprobabilistic, non-temporal based, or other relational methods that are seeing increased usein data-mining and data visualization efforts in determining technological and social trends.Many commercial products are now available that perform statistical and other algorithmicanalyses among data in large databases to determine otherwise indiscernible relationships.Such analyses can be useful, for example, in marketing and sales, business intelligence, andother activities requiring a better understanding of relationships among systems of complexinteractions among components or agents, and the system or individual response to change.While these practices do include observing or trending change over time, the analysesusually involve only secondarily linear temporal projections including statistically basedmeasures of uncertainty or risk. Moreover, the focus of these methods is most oftenunderstanding or visualizing static or cause-effect relationships, rather than understandingprimarily the growth, diffusion, substitution, etc., which are primary foci of the highlytemporal-based QTF methods.2.1 MethodologiesQuantitative technology forecasting has been applied successfully across a broad range oftechnologies including communications, energy, medicine, transportation, and many other areas.www.intechopen.com
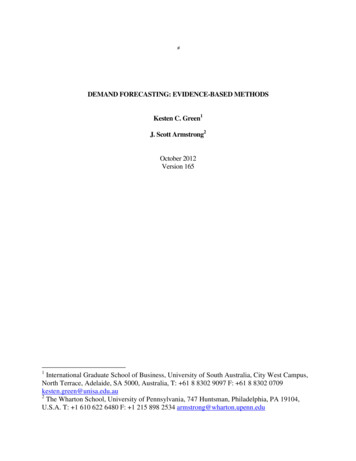
Quantitative Technology Forecasting Techniques105A quantitative technology forecast will include the study of historic data to identify one of or acombination of several recognized universal technology diffusion or substitution trends. Rates ofnew technology adoption and rates of change of technology performance characteristics oftencan be modeled using one of only a relatively small number of common patterns. The discoveryof such a pattern indicates that a fundamental diffusion trajectory, envelope curve, or othercommon pattern has been found and that reliable forecasts then can be made.The quantitative forecasting techniques are “explanatory principles” (Bateson 1977), that is,sufficient by their reliability for the purposes of modeling technology diffusion patterns andforecasting technology adoption. Many researchers have attempted to develop fundamentaltheories underlying substantiate the commonly found patterns, such as extending theoriesof system kinematics and other advanced systems theories, to varying success andacceptance in the field. The ubiquity of the various patterns has been studied also usingsystems theory and complexity modeling, such as the complex adaptive systems approach.2.1.1 Logistic growth projectionForecasters had their first significant successes in predicting technological change when theyused exponential models to project new technological and social change (e.g., Malthus, 1798,as cited in ). It was deemed only logical that a new technology at first would be selected byone, than perhaps two others, and these people in turn, two others each, and so on, in apattern of exponential growth. Ultimately however, as in any natural system, a limit orbound on total selections would be reached, leading early researchers to the use of thelogistic (or so-called S-curve) to model technological and social change.In the late 20th Century, researchers in the United States such as Lenz (Lenz, 1985), Martino(Martino, 1972, 1973), and Vanston (Vanston, 1988), and others around the world, such asthe very prolific Marchetti (Marchetti 1977, 1994, 1996) refined forecasting methods andshowed that the logistic model was an excellent construct for forecasting technologicalchange. The logistic displayed virtually universal application for modelling technologyadoption, as well as for modeling effectively many other individual and social behaviors.The classical logistic curve is given by:P(t) κ/{1 exp[- (t- )]}(1)This simple three-point curve is defined by κ, the asymptotic maximum, often called thecarrying capacity; , the rate of change of growth; and , the inflection point or mid-point ofthe curve. Figure 1 illustrates the idealized logistic curve of technology adoption or diffusion.A popular means to visualize the growth match to the ideal logistic curve is by way of a lineartransformation of the data. The Fisher-Pry transform (Fisher and Pry 1971) is given by:P’(t) F(t)/[1 – F(t)], where F(t) P(t)/κ(2)where F(t) is the fraction of growth at time t, given byF(t) P(t)/κ(3)The Fisher-Pry transform projects the ratio of per unit complete and per unit remaining of agrowth variable.www.intechopen.com
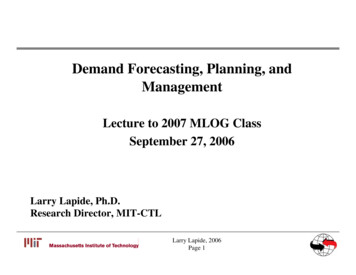
106Technological ChangeFig. 1. Ideal logistic growth curve (Adapted from Meyer et al, 1998).Figure 1 illustrates the idealized logistic curve of technology adoption or diffusion. Figure 2shows the logistic growth of the supertanker of maritime fleets presented in a popularformat developed by Fisher and Pry (Fisher and Pry 1971) that renders the logistic curvelinear. Figure 3 shows the growth pattern of a computer virus that infected computers onworldwide networks.Note that the time and level of saturation (peaking) of the logistic trajectory is a keyindicator of change: it can signal the emergence of new or substitute technology.2.1.2 Constant rate of change (performance envelope)Technology change occurs within dynamic and complex systems of human behavior. Thegrowth and diffusion of technology influences and is influenced by the activities of humansas individuals and groups at varying scales. The adoption of new technology requiresintellectual, material, energy, and other resources to be redirected, increased, and otherwisemanaged as required in the implementation of the new technology.When a new technology emerges having the substantive compelling advantage such that itwill successfully substitute for an incumbent technology at some higher, but still(physiologically complementary) practical performance level, humans in groups tend to goabout the changeover in a methodical way, managing to maintain equilibrium in the vastarray of a culture’s interaction and interdependent social, material, and economic systems.www.intechopen.com
Quantitative Technology Forecasting Techniques107Fig. 2. Logistic growth of the supertanker (Adapted from Modis 1992).Fig. 3. Logistic growth of a network computer virus (Data from Danyliw and Householder,2001).www.intechopen.com
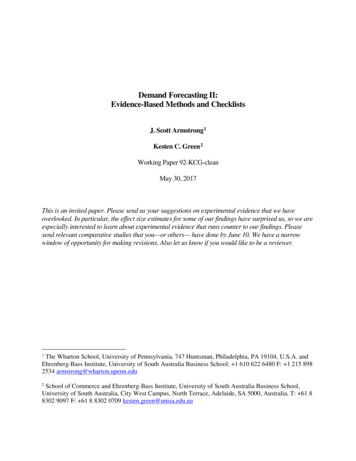
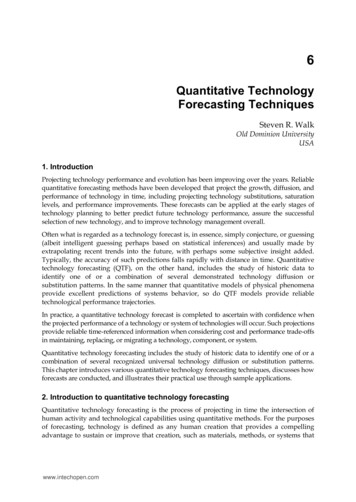
108Technological ChangeThe result suggests strongly that the adoption and change of substitute technologies is farfrom random and rarely sudden, and usually follows a smooth transition, at a rate of changedependent on the either consciously or unconsciously maintained by individual andcollective forces for equilibrium.This result contradicts theories of “disruptive technology”. It is true that individuals orsubgroups can face significant disruption when a new technology arrives and displaces,especially if rapidly, the incumbent technology. However, QTF research suggests thatcareful study can unveil the technological or physiological parameter that governs or pacesthe technological changeover, reflected in a smooth trajectory of the change characteristic ona larger scale. Marchetti commented, “Show me the disrupting technology, and I will findyou the logistic curve”, (personal communication, February 2007).Forecasters call the curve of sequential performance levels of adopted technologies aperformance characteristic curve, and search for its telltale shape in the history of atechnological area of interest. The nature of the curve is exponential growth, where, if aquantity x depends exponentially on time t the growth expression isx(t) b/т(4)where the constant a is the initial value of x,x(0) (5)and the constant b is a positive growth factor, and τ is the time required for x to increase by afactor of b.Figure 4 shows an example of the performance characteristic curve for transistor density ona microprocessor chip, the popular “Moore’s Law”. Intel CEO Gordon Moore could targetthe timing of the introduction of new technology performance and thereby target R&Defforts to a horizon performance. The performance envelope shows that the successfulemergence and integration of a new technology can be predicted inversely, i.e., theperformance envelope provides a future order of merit that an incubating technology must achieve. Inother words, the horizon drives the technology, not the other way around.Figure 5 shows the performance envelope history of primary industrial energy conversion.Note that the performance trajectory technique identifies the horizon of expectedtechnological performance, in this case, an energy conversion efficiency of about 75% in2050. Along this trajectory, we see that only fuel cell technologies, of all emerging energyconversion technologies, are capable of meeting the 2050 efficiency horizon.Core performance envelopes have been identified in many industries, and likely exist forall industries and technology areas. The performance envelope is a valuable index anddecision tool for technology planning, including technology watch and horizon scanningactivities.2.1.3 Logistic substitutionTransitions from one technology or performance level to the next tend to follow neat,manageable patterns. In the 1960’s, Fisher and Pry (Fisher and Pry 1971) analyzed hundredsof technological substitutions in history and devised a method to graph the substitutionwww.intechopen.com
109Quantitative Technology Forecasting TechniquesMoore's Law109Transistors (Log scale)8765Microprocessor4Performance Envelope321970198019902000Year2010Fig. 4. Moore’s Law - Performance envelope of microchip transistor density (Data from IntelCorp. 2001)Fig. 5. Performance envelope of industrial energy conversion technology, projection to 2050(Adapted from Ausubel and Marchetti, 1997).www.intechopen.com
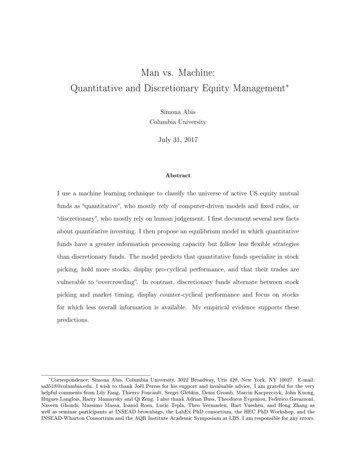
110Technological Changepatterns in linear form. The curve-fit is more easily estimated by observation of the straightline of the Fisher-Pry transform as compared to estimating fit along the sweeping logisticcurve.Figure 6 illustrates a typical logistic substitution pattern, here the substitution ofautomobiles for horses as the preferred ‘personal vehicle’ for transportation. Studies haveidentified the logistic substitution pattern in technologies as diverse as substitutions in fiberoptic transmission networks (Vanston 2008) and the substitution of latex for oil-based paints(Modis 1992). In the maritime industry there evolved a multiple-pulse logistic substitutionof motor-over-steam-over-sail in ship propulsion technology (Figure 7).Being able to predict the emergence and diffusion of substitute (often disruptive, on localscales) technology is a powerful tool in any comprehensive, strategic technology watchprogram. Knowing the trajectory of an overcoming technology enables reliable projectionsof critical time horizons of technology change. QTF Logistic Substitution provides astraightforward method to illuminate these evolving patterns of current and future events.Share of Personal Travel Modes:Horses v. Cars21.5Log F/1-F10.50CarsHorses-0.5-1-1.5-21895 1900 1905 1910 1915 1920 1925 1930 1935YearFig. 6. Logistic substitution of primary personal travel mode (Fisher-Pry display format).2.1.4 Precursor (lead-lag) growth relationshipThe implementation or adoption of a technology has been shown to vary logistically. Whenone technology is dependent on or otherwise closely related to a previous development, thetwo trajectories are found to synchronize in a steady lead-lag relationship (see Figure 8).www.intechopen.com
111Quantitative Technology Forecasting TechniquesFig. 7. Substitution of US maritime propulsion technology (Adapted from Modis 1992).Typical Technology Precusror Relationship90%DiffusionConstant Lead-Lag Gap10%TimeFig. 8. Constant lead-lag logistic relationship.www.intechopen.com
112Technological ChangeStudies have shown that the worldwide discovery of petroleum resources has led theproduction of oil by a fixed period over many decades (Modis 2000). Studies have shownalso that the diffusion in the USA industry of networked desktop personal computersfollowed the same shape logistic trajectory as the precursor technology, stand-alone PCs(Poitras and Hodges 1996).Figure 9 shows the lead-lag relationship between patents and research publications inquantum dot technology. Academic publications and US patent office databases were minedto capture the two parallel logistic growth pulses. Notice again the nearly constant 4-yeartime lag from beginning to end of the pulses. It would have been readily forecast around theyear 2000 that within six more years the early patent pulse would end and quantum dottechnology would next evolve into broad applications and commercial viability.'Quantum Dot' Patent and PublicationPulses21.5PublicationsPatentsLog YearFig. 9. Approximate constant 2-year precursor relationship between quantum dottechnology patents and publications (Data from Walk 2011b).2.1.5 Anthropological invariantsIn the grand history of the progression of technological change, one of the striking results isevidence, otherwise not identified or identifiable, of the invariance of certain humanbehaviors. While technologies offer many and perhaps infinite varieties of how to get thingsdone, the things humans do want to get done, generally, have remained the same forwww.intechopen.com
113Quantitative Technology Forecasting Techniqueshundreds and thousands, and perhaps millions of years. For example, travel andcommunication patterns, depicted in broad averages of commuting or foraging times, or innumbers of human exchanges, have been shown to be constant across time and cultures.In the case of the commuter, the average commute in the United States has remained atabout one half hour since the automobile became the main choice of personal mobility acentury ago. The advice to automobile manufacturers is that seat design need onlyaccommodate the average drive, about 30 minutes. No matter how much the manufacturer’sinvestment, no matter how much more advertised, the average user is going to drive theautomobile a half hour per day, out and back.The compelling advantages in the design and performance of technologies can be viewed asartifacts of unchanging human behavioral preferences. As an example, Figure 10 shows themore or less constant acceptable (and, by complex social feedback mechanisms, soengineered and designed) risk of death by automobile in the United States, over nearly anentire century.Automobile Fatilities for USADeatrhs per 100,000 Population30252015105019201940196019802000YearFig. 10. Risk of having a fatal automobile accident in the US (Adapted from Marchetti 1994).2.2 Sample published QTF applicationsThousands of studies using QTF techniques to project or monitor technological change haveresulted in identifying the underlying logistic, performance envelope, substitution, or otherwww.intechopen.com
114Technological Changeubiquitous fundamental trajectory. Table 1 provides a very short list of sample publishedstudies.Sections 2.2.1 and 2.2.2 provide further examples of QTF studies with more in depthdiscussion of the process of understanding and extracting strategic meaning from studyresults.QTF TechniqueLogistic GrowthLogistic SubstitutionPerformance EnvelopeApplicationPublication SourceAluminum in AutomobilesBright 1973Commercial Space LaunchesWalk 2011aPopular Recording MediaMeyer, et al 1999World Primary EnergySubstitutionMarchetti 2000Hard Drive DensityChristenson 1997Internet BandwidthNielsen 2011PrecursorsOil Discovery and UseModis 2000FORTRANWalk 2011bAnthropological InvariantAge of world shipping fleetcasualtiesWalk 2004Share price of DJIA stockModis 1992Table 1. Sample QTF published studies2.2.1 Human travel: Wanderlust, exploration, and settlementsMarchetti published a remarkable series of quantified technological studies of the locomotivehabits of humans (Marchetti 1994). Modis (Modis 1992) provides a very interesting graph ofthe ‘discovery’ of the Americas, of which Figure 11 is an adaptation. While many interestinginsights flow from this remarkably simple set of sailings across the Atlantic, the reader’sattention is called to the fundamentally logistic growth in probing the New World.The proceeding graphs (Figures 12 to 14) show human exploration patterns of our sailingsacross space: to the Moon, Venus, and Mars. The Mars probes were plotted using a 5-yearrunning average to smooth the clusters of probes launched when Mars and Earth were inoptimal launch positions. Note the two distinct pulses of Mars probe activity, the secondapproaching 90% of saturation at the time of writing this chapter. These various space probelogistic patterns would be nearly interchangeable if we were to normalize scales.At the end of the logistic saturation in Columbus’ era, in the early 1700’s, ‘permanent’settlements in the ‘new’ world had been established and commercial trade was in earlyflourish. The ‘new’ world was much like the ‘old’ world in almost every aspect of habitability,our legacy of inherited survival needs could be met readily, and so we relocated.The logistic pattern of discovery, of which the probes to the ‘new world’ are an excellentexample, is repeated in space explorations. However, the probes have not been followed bythe settlements and commercial trade phase.www.intechopen.com
Quantitative Technology Forecasting TechniquesFig. 11. Logistic pattern of discovery voyages of the Western Hemisphere (Adapted fromModis 1992).Fig. 12. Logistic growth of Moon Probes (Data from NASA 1958-1976)www.intechopen.com115
116Technological ChangeFig. 13. Logistic growth of Venus Probes (Data from NASA 1960-1990)Let us consider, in this example, what the consistent patterns in world and solar systemprobes might tell us. Among many things, the studies tell us what is obvious, but that can belost in heady visions of technology promise: we simply do not inhabit places we do not likeafter having visited them. QTF studies have shown there exist identified and unidentified,i.e., conscious or unconscious, invariants in human behavior apparently lain down bymillions of years of gene-coded and cultural evolution that we cannot override by ourwishing, will, or law. For example, after exploring the far polar regions, by air, on land, andunder the sea, people have not settled there. The landscapes simply are too inhospitable, thecriteria of hospitableness being a short list of bounded behaviors and needs, some identifiedin the history of technological adoption and change. We have not built cities under the sea,as was projected by futurists and popular media in the late 20thcentury, and QTFperspectives indicate it is extremely unlikely we ever will.We might, then, consider seriously that we have reached the end of our Moon, Venus, andMars explorations, and that the idea of anyone ever settling either Moon, Mars, or Venus, isa wish fading from our collective mind.The results of this sample QTF study suggest a larger perspective on space travel. Humanshave learned to travel the ocean, and even penetrate a short distance beneath its surface totravel and meet other physiological (e.g., nutritional) needs, but we have not chosen to livebelow the ocean surface. We can look at this frontier geometrically, as that of a well-traveledouter spherical surface of a downwardly vast and uninhabitable ocean of water.We can look at the space frontier by an analogous geometrical stretch of the imagination.Consider our very active and frequently travelled low earth orbit (LEO, up to 2000 km)www.intechopen.com
Quantitative Technology Forecasting Techniques117Fig. 14. Two-pulse logistic growth of Mars Probes (Data from NASA 1961-2011)sphere as an interior spherical surface of an outwardly vast ocean of space. We have learnedto travel this space ocean ‘surface’, and even penetrated to a short distance (in a radiallyoutward direction, such as across our solar system). However, we appear to be balking onhabitations to any ‘depth’ of space beyond LEO.2.2.2 Sample of linked research and production trajectoriesFigure 15 reveals an interesting and telling symmetry in the superposition of the logisticdiffusions of supertankers and engineering publications related to supertankers. The initialpublication citations began about 20 years before the commencement of commercialwww.intechopen.com
118Technological ChangeFig. 15. Growth of research and production of supertankers (Production data from Modis1992. Publication data by search of Compendex database.)production, and ended about the same period following the cessation of production. Theyear of peak rates of growth of publications and production, the mid-points of the logisticcurves, was the same. We wrote about them, built them, and wrote about them some more,in a tightly choreographed pas de deux of logistic movement.Note the advantage of such information in technology watch and horizon scanningprograms: knowing the relationship between publications and production can yieldimportant timing intelligence for both trending technology and performance trajectories ordiffusion in a technology watch program, and for timing of peak saturation and likelyemergence of new technology in a horizon scanning program.3. Typical QTF study procedures and practical considerationsThe following tasks outline the typical procedure followed in a QTF study effort.1.Identify candidate forecast technologies for which the following criteria are met: The technology or technology performance requirement lies on a critical path in astrategic development plan or in a specific program requirement. Reliably accurate, time-referenced data of prior technology adoption rates orperformance change rates are available quickly and at reasonable cost. The forecast can be prepared in no longer than three monthswww.intechopen.com
Quantitative Technology Forecasting Techniques119 2.3.4.5.6.7.The forecast will provide the opportunity to undertake follow-on forecasts, eitherby further increasing the forecast scope or scale in the selected technology, or bybranching into related technologies or applications.Select the best candidate technology or technology performance requirement for theproject based on the selection criteria.Gather experts in the history, application, or research and development of the selectedtechnology or performance requirement.Hold discussions that stress conceptual thinking to develop hypotheses of 1) the (single)performance criteria that led to the adoption, substitution, and overall evolution of thetechnology, and 2) the (fundamental) human utility driving the technology changes.Obtain time-referenced data to test the hypotheses developed in the expert discussions.Analyze the results of the forecasts. Revisit, clarify, and reaffirm the rationale of the hypotheses underlying the forecast. Corroborate the results, if possible, through the analysis of analogous or paralleltechnology change. Consider future extreme external events that could significantly influence theforecast.Repeat steps 1-6 for other candidate critical technologies, and learning from theoutcomes of the forecasts, identify further opportunities for routine technologyforecasting in future technology planning and development.3.1 Determining growth metricsQuantitative technology forecasts focus on changes in time of fundamental characteristics oftechnologies or systems of technologies. While the models and mathematics are relativelysimple, time-based, quantitative constructs, expertise in the technology, social regime, orother discipline of the studied data is required to identify the index (metric or measure) thatis the locus of change, and which becomes the variable on the vertical scale of the plots, andto assure the reliability of subsequent forecasts. A look back at the many sample plots in thischapter show a wide variety of indices. Often, the index or metric is not an intuitivemeasure. The reader is encouraged to review the indices identified in achieving thepublished results shown in Table 1 to observe the wide variation in metrics, and to notethose metrics that at first blush might not be considered in initial trajectory analyses.It is important to remember in all cases that successful technological innovation, technologychange, and technology performance are linked fundamentally to relatively narrowlyinvariant behaviors or strong preferences in human needs and behavior. Candidate‘improved’ or ‘next-generation’ technologies must match individual human or sociallyadvantageous human needs and capabilities to survive. Too fast, too small, too big, and soforth, and the new technology will fail, i.e., not be adopted, even though it might providesignificant ‘improvement’ in some performance measure. Technology can be said to besimply extended physiology, and those technologies that have too high a behavior penaltyor too low a behavior advantage will not be chosen.As an example of this phenomena, the commercial airline industry growth was found tofollow a performance trajectory based on a metric including passenger seat and speed(Bright and Schoeman, 1973). The number of seats and cruising speeds were logical and
2. Introduction to quantitative technology forecasting Quantitative technology forecasting is the process of projecting in time the intersection of human activity and technological capabilities us ing quantitative methods. For the purposes of forecasting, technology is defined as any human creation that provides a compelling