Transcription
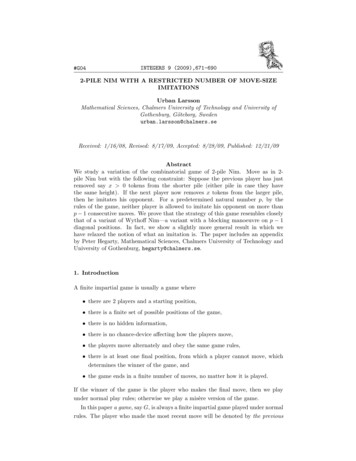
Pile Driving Formulas RevisitedRyan Allin, P.E., M.ASCE1, Garland Likins, P.E., M.ASCE2, Jon Honeycutt, E.I.T.31Senior Engineer, Pile Dynamics, Inc., 30725 Aurora Road, Cleveland, OH 44139Senior Partner, Pile Dynamics, Inc., 30725 Aurora Road, Cleveland, OH 441393Staff Engineer, GRL Engineers, Inc., 511 Old Covington Highway, Hammond, LA 704032ABSTRACT: Energy formulas have historically been used to estimate capacity fordriven piles. Some engineers still rely on them today and researchers attempt torefine the safety factors or resistance factors to allow a more economic result.However, energy formulas make broad assumptions about “average hammerperformance” that cannot always be properly accounted for during installation andthus leave themselves open to gross inaccuracies on any “individual project”, andtherefore significant risk. Additionally, since common energy formulas do not modelthe driving system or pile or soil, observing hammer stroke and blow count is notsufficient to guarantee a specific capacity has been achieved on an individual project.It has been well documented by measurements that supposedly similarly ratedhammers can transfer significantly different energies to the pile. Using the waveequation analysis to model these vastly different hammer system efficiencies, theresulting variance on calculated capacity from commonly used energy formulas isinvestigated and presented. Set-up assumptions contribute to further inaccuracies.INTRODUCTIONDriven piles have long been a choice for foundations where the supported structureis on soft soils at the ground surface. Herodotus in his book “The Histories” datedaround 450 B.C. reports on pile driving activity, and the Romans are well known tohave used driven piles. As noted in FIG. 1, one can find use of pile driversthroughout the centuries, and that includes the very first European settlement in NorthAmerica at Jamestown Virginia where a 1500 pound drop weight was discovered andthe model presented at their museum. FIG. 1 likely represents the general process,although some have used groups of humans to hoist the drop weight rather than beastsof burden.Obviously, timber piles were all that was then available and could only be installedto relatively low pile capacity, even when driven full length or to refusal. Due to thenavailable drop or steam powered hammers of relatively small size, these low capacitytimber piles dominated until the early to middle of the 20th century. Into this culture,“pile driving formulas” were developed to try and estimate the ultimate capacity ofthe installed piles based on the observed set of the pile and the energy rating of thehammer.Page 1
FIG. 1. Model pile driver at Jamestown Virginia.The first North American uses of a “pile driving formula” (Howe, 1898) were in1845 by Col. Mason for Fort Montgomery at Lake Champlain and in 1848 by MajorSanders for Fort Delaware on Pea Island to protect the harbors of Wilmington andPhiladelphia. The 6000 yellow pine timber piles at Fort Delaware were installed overa period of three years by a steam hammer with a 2000 pound ram weight. Sanders’simple formula (R Wh/8s, where R is the capacity, W the ram weight, h the dropheight, and s the pile set per blow) used a nominal safety factor of eight, the term inthe denominator.Arthur Wellington in the December 29, 1888 issue of Engineering News publishedhis ‘Engineering News’ formula, again designed for drop hammers and timber pilesand it added a “lost set” term into the basic equation used by Sanders (Chellis, 1951:Chellis lists 20 different formulas in this classic book). In 1925, A. Hiley introduceda more “complete” formula trying to account for various “losses”. More recentformulas developed after 1940 include the Gates formula, promoted by the U.S.Bureau of Public Roads (later the Federal Highway Administration). Several of theselong-ago formulas (some simple and others complex) are still in some use today.Pile driving formulas were commonly used in the early 1900s to estimate drivenpile capacity, because then there was really not much alternative, and manycomparisons were then made with static loading tests. ASCE formed a Committee in1930 to review the accuracy of the pile driving formulas then in use. After a decadelong study, the “Committee on Pile Driving Formulae and Tests” produced tworeports in May 1941 and sparked a remarkable series in the ASCE Proceedings of 28discussions by Terzaghi, Casagrande, Peck, Tschebotarioff, Dames & Moore, andPage 2
Proctor, to mention only a few very prominent responding engineers. It is prudent toreview what these geotechnical "giants" said about pile driving formulas. A summary(Likins et al. 2012) has reported on the main conclusions of each discussion.Remembering this past should guide the current engineering community tounderstand what should, or should not, be done in the present. But the end result ofthis extensive study was all pile driving formulas, including both simple and complexformulas, were widely discouraged as inaccurate, and the only reliable method forcapacity determination was deemed to be a static loading test which was then the onlyother alternative.In the last few decades, pile dimensions have greatly increased and pile drivinghammer rated energies have grown enormously, resulting in significant increases inthe typical loads assigned to the installed piles, far beyond the meager loads achievedfor timber piles driven by drop hammers which are the basis for pile driving formulas.Yet, amazingly, these formulas are still applied, even when they are far from theoriginal experience database for their development. It should be further noted thatthese formula are crude and generally do not consider pile length, or pile weight, orsoil type, or driving system components such as cushions or helmets, or thesignificantly different impact features of now-common diesel hammers. Formulasincorrectly consider the pile to be rigid, rather than transmitting stress waves.Pile driving formulas were developed to be used with end of drive data since thatwas correlated with static tests; they then assume the soil damping during driving willbalance the set-up usually experienced with time. This premise, while true onaverage, remains dangerously false for any individual project site as discussed byRausche et.al. (2004).While it had been long recognized that pile driving created travelling “stresswaves”, solutions solving real issues were not available until the advent of the digitalcomputer. A practical solution called the “wave equation” was first developed andimplemented on IBM computers by the mid 1950’s by E.A.L. Smith of the RaymondConcrete Pile Company. Smith (1960) published his method which was a finitedifference solution using masses and springs to realistically model the variouscomponents using the engineering properties of the hammer, driving systemcomponents (helmet and cushions), elastic pile allowing stress wave propagation, andsoils of various types having both static and damping behavior. This analysis kepttrack of the each mass’s relative movement, allowing investigation of driving stresseswhich were before impossible to determine with simple pile driving formulas. For aseries of assumed ultimate capacities at one depth and with the same relativeresistance distribution, the corresponding computed net displacement (“set” per blow)could be computed and then compiled in a resistance versus blow count (inverse of“set”) plot called a “bearing graph”.The wave equation allowed modeling of their non-uniform mandrels for theirproprietary step taper piles, and to investigate the driving stresses in concrete piles,particularly tension stresses that were causing considerable pile damage.This wave equation method became widely available in the mid 1970’s with theadvent of the “WEAP” program (“Wave Equation Analysis of Piles”) which includedan enhanced thermodynamic model for diesel hammers and comparison against actualfield measurements (Goble and Rausche, 1976). This program has been subsequentlyPage 3
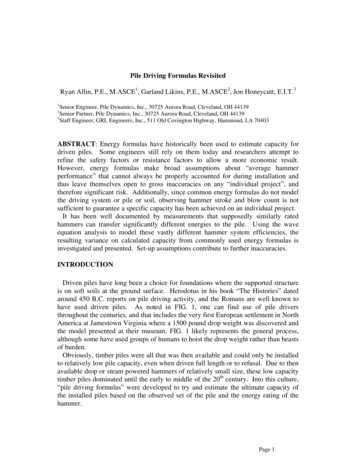
extensively expanded to include analysis of residual stresses and additional input andoutput options including “Inspector’s Charts” and “Drivability Analysis” (whichincorporates static analyses versus depth with factors to account for changed stressconditions during driving) to predict the blow count as a function of pile embedmentduring installation and the subsequent effects of set-up or relaxation.Lawton et al (1986) made an extensive literature study, including results of ninepublished correlation studies by others, and a survey of most of the State Departmentsof Transportation. They found that “the ENR formula, either in its original form ormore often in a modified version, is by far the most popular dynamic formula used.”This is alarming since 8 of the 9 correlation studies “found the ENR and modifiedENR formulas to be among the worst.” Lawton also found “All investigators wereconsistent with regard to wave equation methods. A wave equation analysis of staticpile capacity was consistently equal to or better than the best formula predictions,despite old versions of wave equation computer programs being used in many studiesin which input information was not always accurate.” They reasonably surmise bettercorrelations with newer wave equation programs and accurate input information.PILE DRIVING VARIABLESOne of the many deficiencies in using pile driving formulas is the assumption thatthe pile is rigid, or that the elastic nature of a pile can be accounted for in some broadbased ‘set loss’. FIG. 2 shows wave equation results from an HP14x89 H-pile drivento refusal blow counts with a J&M 82 hydraulic hammer (operated at full 4 ft stroke;rated at 32.8 kip ft). The soil model had 90% end bearing and 10% shaft resistance,all quakes were 0.1 inch and Smith damping was 0.15 sec/ft for both shaft and toe.Note the analysis, which models the pile as a linear elastic rod, indicates a greatvariance of capacity based only on varying the pile length. For the short 20 ft pilelength, 20.9 kip-ft energy is transferred to pile top but only 9.9 kip ft is transmitted tothe bottom, while for the 80 ft pile the respective energies are higher at the top (23.9kip ft) and lower at the bottom (8.0 kip ft). The wave equation demonstrates longerpiles accept more energy initially before part is returned to the hammer, but much ofthe energy is used by storing as elastic pile compression and less is actually availableat the pile toe to advance the pile or activate the resistance. With less energyavailable at the toe, the longer piles reach refusal at a lower capacity, as the waveequation demonstrates. Pile driving formulas however, would yield the same pilecapacity regardless of pile length, which is obviously incorrect. Further, these piledriving formulas do not even take into account the pile section size which is absurdconsidering even the most basic static analysis method would require knowledge ofthe pile section area and circumference to estimate pile capacity.Page 4
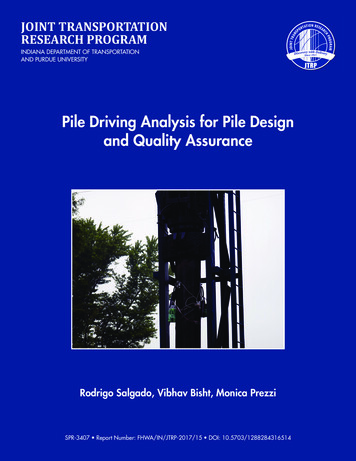
Pile Capacity (kips)90080070060050020304050607080Pile Length (feet)FIG. 2. Wave equation shows capacity depends on pile length at refusal.Beyond the issue of pile length, pile driving formulas generally do not included anyconsideration for pile cross sectional area, pile or hammer cushions, helmets weights,motive power (cable, air pressure, diesel cycle), or soil behavior (soil type or pileembedment). These components can all be modeled in a wave equation and eachvariable makes a difference in the solutions obtained in wave equation. But the realmajor problems are likely to be soil and hammer performance. These majordifficulties are further discussed in the following sections.Another potential difference is drop height for same energy rating. A dieselhammer with a high stroke and relatively low ram weight will create a higher impactforce than a hydraulic or air hammer at same rated energy but with fixed lower strokeand heavier ram. From basic wave mechanics considerations, the higher stroke dieselhammer will then outperform the low stroke air hammer when the driving gets hardsince the higher impact force, resulting from the diesel hammer’s higher stroke, willovercome higher soil resistances and drive the pile further. Any pile driving formulawill not recognize this difference and give the same result for a similar rated energy.SOIL EFFECTSIn addition to pile length effects, soil “quakes” (elasticity limits) and dampingparameters can have drastic effects on capacity versus blow count. FIG. 3 models a75 ft long 14x89 H-pile being driven with a Vulcan 506 air hammer with a 5 ft stroke.The wave equation used the standard efficiency of 67%, which account for reductionsdue to friction losses during the drop, and two different soil conditions, namely a sandPage 5
FIG. 3. Comparison of formula with wave equation.(SA) having 22% of the resistance with a triangular shaft resistance distribution, and aclay (CL) with 90% of the resistance on the shaft. Note that just by modifying thedynamic soil parameters (soil damping and quake, nad resistance distribution) that thewave equation model will yield quite different results. It is further noted from thiscomparison that above about 500 kips that EN formula overpredicts the capacitysubstantially while the Gates formula overpredicts capacity at the lower blow countsor if the soil conditions are cohesive. Caution is given to assume formulas are safe atany level since changing the pile cross section can alter the wave equation resultsubstantially, so the “relative” differences in FIG. 3 cannot be reliable either.Several discussers in the 1940’s study noted that formulas should be restricted tocohesionless soil applications. Chellis (1951) states “a formula can apply only in thecase of cohesionless strata, such as sand, gravel or permeable fill”. Yet today thisintended restriction is ignored.HAMMER EFFICIENCYThe Hiley formula tries to at least account for total pile weight; however thisformula, or any formula, generally assumes normal hammer performance. In additionthere are considerable safety concerns of requiring an individual to record the “setrebound” of the pile, as required by Hiley, while standing adjacent to the pile directlybelow the operating pile hammer; in the USA this would be prohibited as unsafe.An extremely serious weakness of using only a pile driving formula or even waveequation analysis for any specific project is that the actual hammer performance ofPage 6
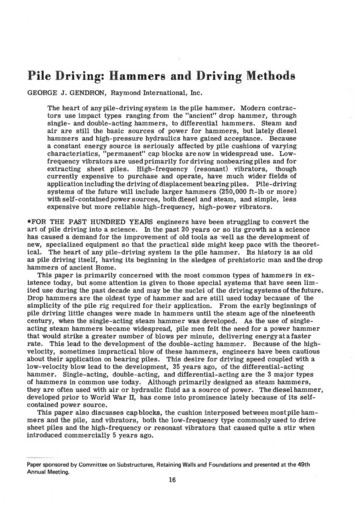
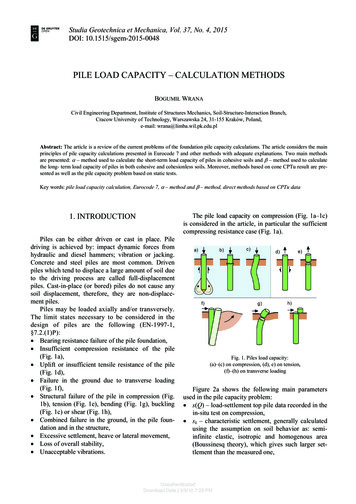
any individual hammer can be quite variable — and unknown — and this seriouslimitation applies to any pure analysis method that lacks measurements. Moderndynamic testing (Likins et al, 2008) measures the force and velocity during the pileimpact which can be used to estimate capacity, driving stresses, pile integrity andenergy transferred to the pile; energy transfer is particularly relevant to thisdiscussion. These measurements clearly show wide variability in measured transferenergy in their ratio to the manufacturer’s rated energy; differences of factors of twoin energy transfer are common between supposedly identical hammers operating inthe same hammer-pile-soil systems, and for most formulas this would result in factorof two differences in capacity!30%25%MEAN 41.8%STANDARD DEVIATION 11.4%FREQUENCY20%15%10%5%0%ENERGY TRANSFER RATIO [EMX/E‐RATED]FIG. 4: Measured transfer ratio of air/steam hammers on concrete piles(n 156); courtesy GRL.FIG. 4 shows the measured transfer efficiency of Air/Steam hammers on Concretepiles compiled over 30 years. As is shown in FIG. 4, the average transfer efficiencyis approximately 42% with a standard deviation of 11.4%. If we model a Vulcan 506driving a 16” square concrete pile so that the transfer efficiency mimics the averagevalues reported in FIG. 4 at 420 kips and then vary the hammer efficiency even withinone standard deviation of the mean transfer efficiency, that would result in a changein blow count of as much as 57% of the value derived by assuming the standardtransfer efficiency (FIG. 5). From FIG. 5 the potential variation within two standarddeviations (one in twenty tests would fall outside even this generous limit) wouldresult in a variance of the capacity versus blow count that would render anyconnection with the original development of the formula meaningless. Most of thedeviations compared to normal hammer performance are due to malfunctions in thehammer such as excess friction on the guides, pile cushion issues for concrete piles,valve timing irregularities causing preadmission of the motive air pressure for airPage 7
hammers, or preignition in diesel hammers. The result would be a premature higherblow count indicating an overprediction of capacity, but at a reduced embedmentdepth and reduced actual capacity compared with the correct depth required for thetrue desired capacity, an unsafe situation that easily leads to distress or failure in thefoundation.FIG. 5: Capacity and blow count variation with varying hammer efficiencies.Using a Vulcan 506 air hammer and the same H-pile and soils as the study of FIG. 3.Comparison of formula with wave equation. (with both sand-SA and clay-CL soils),the effect of hammer performance is shown in FIG. 6 for both soil types and varyinghammer efficiencies. The hammer efficiencies causing a normal energy transfer ratio(hammer efficiency 62%; transfer ratio 56%) and two standard deviations abovenormal (efficiency 85%; transfer ratio 81%) and two standard deviations belownormal (efficiency 33%; transfer ratio 31%) are investigated. It becomes clear thatsoil type and hammer efficiency cannot be ignored since at any given observed blowcount the capacity determined may then vary by more than a factor of two. Bycontrast, pile driving formulas would not consider these important parameters andproduce the curves for pile driving formulas already shown in FIG. 3.Page 8
Bearing graphs ‐ Vul 506 ‐ H14x89W.E.SA 85%W.E. CL 85%W.E. SA 62%W.E. CL 62%W.E. SA 33%W.E. CL 33%Ultimate Capacity (kips)700600500400300200100004080120160Blow count (bl/ft)l200240FIG. 6. Wave equation with varying soil type and hammer efficiency.The soil types should be known on a site from a proper soils investigation, and cantherefore be properly modeled in a wave equation analysis (but not in a pile drivingformula). However soil strength from the typical SPT N-values has shown widevariability so a simple static analysis is widely viewed with caution withknowledgeable engineers selecting properties very conservatively for very smallprojects, or by requiring either static testing or dynamic testing on projects of anyreasonable size and importance.However, hammer performance can only be properly assessed by dynamic testingmeasurements during pile installation. The risk of not detecting an underperforminghammer, causing a less than sufficient embedment and low capacity, can be avoidedby simply requiring even a minimum amount of dynamic testing to assure thehammer is performing to normal expectations, and on larger projects to have periodictests to assure consistent performance for the duration of the pile driving activity.Once hammer performance is known from measurements, and soil resistanceassessed, then a “refined wave equation analysis” (Rausche, 2009) would provide agood method to select the final termination criteria for installation.Page 9
Table 1. Statistical comparisons of 220.740.460.410.48Hannigan et al (2006) presents statistical results (Table 1) from comparing staticload tests with pile driving formulas, wave equation (WEAP), and dynamic testingfrom the signal matching software CAPWAP for both end of drive (EOD) and beginof restrike (BOR). As observed in Table 1, the statistical mean for the formulas areboth better for EOD than for BOR, although the coefficient of variation (C.O.V.),which is a better measure of the reliability, are higher (worse) for formulas than forthe other methods. If a static test is not available, dynamic testing with CAPWAP atBOR has the lowest or best C.O.V. and, with a mean of just under unity, is clearlythen the preferred method to confirm capacity. A dynamic test at BOR best considersthe changing soil response, usually due to strength gains from set-up, but in some soilconditions from losses in relaxation.CONCLUSIONSWhile pile driving formulas have been widely used historically in the pile drivingindustry, their use is coupled with the acceptance of gross assumptions and thereforegross inaccuracies. Pile Driving formula, assuming a rigid pile while ignoring the soiltype, and not taking into account various hammer components or hammer type or theactual transfer efficiency of a specific hammer, make any positive correlation ofcapacity to driving resistance coincidental at best. Considering that pile drivingformulas were developed for conditions far removed from today’s common practice,and that the correlation with static load tests is very poor, the recommendations of anesteemed 1930’s task group studying formulas to discredit formulas and avoid theiruse remains the best advice for today.The Wave Equation offers a much more realistic pile, soil and hammer model andcan better correlate a capacity to an observed blow count, based on normal hammerefficiency and reasonable assumptions of soil properties based on a soil boring. Theremaining problem then becomes how to verify the hammer and soil assumptions arecorrect. Assuming the soils are reasonably known from a proper soils investigation,wave equation analysis is useful to refine the driving criteria after some dynamictesting has been performed to confirm the actual hammer performance.Load testing, either statically or dynamically, are both viable means to verify pilecapacity. In addition to lower cost, dynamic testing has the major benefit of assessinghammer performance to avoid otherwise undetected hammer malfunctions andevaluating piles stresses during installation which both aid in developing drivingPage 10
criteria during the installation process. Ultimately field measurements of some kindwill always be necessary to assure proper pile serviceability and for any drivingcriteria to be meaningful.REFERENCESChellis, R.D. (1951). Pile Foundations. McGraw Hill Book CompanyGoble, G. and Rausche, F., 1976, “Wave Equation Analysis of Piles – WEAPProgram, U.S. Department of Transportation, Federal Highway Administration,Office of Research and Development, Washington D.C., (Volumes I-IV).Hannigan, P.J., Goble, G., Likins, G. and Rausche, F. (2006). Design andConstruction of Driven Pile Foundations, (Volume II), Report FHWA-NHI-05043, National Highway Institute, Federal Highway Administration.Howe, Horace, 1898. “Some Instances of Piles and Pile Driving, New and Old”,Journal of the Association of Engineering Societies, (Volume XX, No. 4), pp257-312.Lawton, E. C., Fragaszy, R. J., Higgins, J. D., Kilian, A. P., and Peters, A. J. (1986)."Review of Methods for Estimating Pile Capacity," Transportation ResearchRecord No. 1105: Structure Foundations, Transportation Research Board, pp. 3240.Likins, G.E., Fellenius, B.H., and Holtz, R.D., (2012). "Pile Driving Formulas—Pastand Present." Full-Scale Testing in Foundation Design, Geotechnical SpecialPublication 227, ASCE, Reston, VA, pp. 17.Likins, G. E., Piscsalko, G., Roppel, S., Rausche, F., September 2008. PDA Testing:2008 State of the Art. Proceedings of the Eighth International Conference on theApplication of Stress Wave Theory to Piles 2008: Lisbon, Portugal; pp. 395-402Rausche, F., Nagy, M., Webster, S., Liang, L., May 2009. CAPWAP and RefinedWave Equation Analyses for Drivability Predictions and Capacity Assessment ofOffshore Pile Installations. Proceedings of the ASME 28TH InternationalConference on Ocean, Offshore and Arctic Engineering: Honolulu, Hawaii; 1-9.Rausche, F., Robinson, B., Likins, G.E. (2004). On the prediction of long term pilecapacity from end-of-driving information". Current Practices and Future Trendsin Deep Foundations, ASCE Geotechnical Special Publication, GSP125, pp. 7795.Smith, E.A.L. (1960) Pile-Driving Analysis by the Wave Equation. Journal of theEngineering Mechanics Division, Proceedings of the American Society of CivilEngineers. (Volume 86, No. EM 4), August, pp.35-61Committee on the Bearing Value of Pile Foundations (1941). “Pile Driving Formulas:Progress Report of the Committee,” Proceedings of the American Society ofCivil Engineers, (Volume 67, No. 5), pp. 853-866.Page 11
Discussions in Proceedings of the American Society of Civil Engineers:67(7) Issue of September 1941G.G. Greulichpp. 1391 - 1396C.O. Emerson D.O. Northruppp. 1396 - 1398H.J. Engelpp. 1398 - 1400J.D. Watsonpp. 1400 - 140167(8) Issue of October 1941R.D. Chellispp. 1517 - 1537L. Whitepp. 1538 - 1541J. G. Masonpp. 1541 - 1544C.S. Proctorpp. 1544 - 1545G. Paaswellpp. 1545 - 1547A. Woolfpp. 1547 - 154867(9) Issue of November 1941H.T. Evanspp. 1784 - 1789W.G. Atwoodpp. 1789 – 1790D.M. Burmisterpp. 1790 - 1791W.E. Belcherpp. 1791 - 1793C.C. Williamspp. 1793 - 1794D.P. Kryninepp. 1794 – 179867(10) Issue of December 1941T. Dames & W. Moore pp. 1939 - 1946M.M. Upsonpp. 1947 - 1949G.G. Tschebotarioff pp. 1949 - 1951R.F. Leggetpp. 1951 - 1954J. Feldpp. 1954 - 195668(1) Issue of January 1942L.C. Wilcoxenpp. 169 - 170H.A. Mohrpp. 170 - 172A.E. Cummingspp. 172 - 18168(2) Issue of February 1942K. Terzaghipp. 311 - 323R.B. Peckpp. 323 - 324A. Casagrandepp. 324 - 33168(3) Issue of March 1942C.W. Dunhampp. 445 - 44668(5) Issue of May 1942R.E. Bakenhus (Closure)pp. 7885 - 800Page 12
Page 13
"pile driving formulas" were developed to try and estimate the ultimate capacity of the installed piles based on the observed set of the pile and the energy rating of the hammer. Page 2 The first North American uses of a "pile driving formula" (Howe, 1898) were in 1845 by Col. Mason for Fort Montgomery at Lake Champlain and in 1848 by .


![Pile Foundation Design[1] - ITD](/img/29/pilefoundationdesign.jpg)